Regular readers recognize that my inner investor is bullish on stocks, though my inner trader remains a little leery and expects further market choppiness (see Profit by thinking like Big Money). Despite my longer term bullishness, I tweeted this morning that I had tactically taken a small, underline the word “small”, short position in SPX in my trading account.

I did it for the following reasons:
- The market was due for a bounce – and bounce it did;
- The market moved quickly from oversold to overbought; and
- The technical structure of market action is a bearish structure.
Market due for a bounce
Last week, the selling had become so unrelenting that the market had become sufficiently oversold for stocks to stage an oversold rally. Trade Followers, who monitors Twitter breadth, summarized conditions this way:
The most compelling sign comes from stock market sector sentiment generated from the Twitter stream. In bull markets when every sector was positive on a weekly basis it almost always marked short term tops. We’re now in a bear market and all sectors are negative. I view this as a capitulation of sorts, where traders and investors are selling everything. This is the first time since we’ve been collecting the data that I’ve seen this condition, but the track record of all positive sectors in a bull market gives some credence to the current condition being short term bullish.

From oversold to overbought
Other measures of market breadth, like this one from IndexIndicators, tell a similar story. Readings had become gotten oversold that a rally was more or less inevitable (red dot my estimate for today). However, the chart also shows that the market had quickly moved from an oversold condition, which bottomed out last Thursday, to an overbought condition today in the space of three trading days.

Intermediate term (1 week horizon) readings also gave the same picture of an overbought condition.

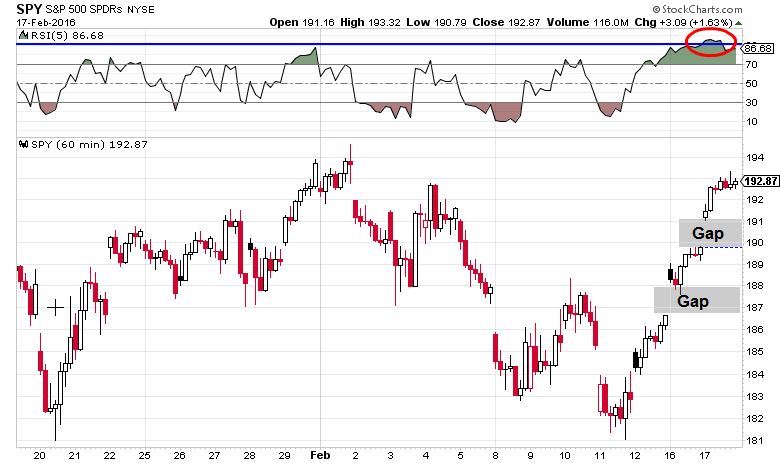
Looking even shorter term, the 5 hour RSI on the SPY chart went over 90 today. It never stays that overbought for long and a retreat is likely. Moreover, there are a couple of downside gaps that potentially need to get filled.
Bear market structure
I was speaking to my former Merrill Lynch colleague and technical analyst Fred Meissner, of The Fred Report, on the weekend. He said that, technically, he believed that the tone of the market is a bear market structure, characterized by poor breadth participation and a pattern of lower highs and lower lows. Fred graciously invited me to quote from his work and he wrote in his latest sector report that he is maintaining his defensive posture:
SPY is down around 1.50 points since the last Sector Review, but it has been a good bit lower throughout the month. Caution flags are out. We will leave sector weightings the same for now – the market may be making a tradable bottom and if so we may make changes intra-month…
We still believe that deflation and China weakness (and now devaluation concerns) are the “elephant in the room”. This could exacerbate the bear market structure we are already in. We were one of the first to propound this view. It still bears watching, as Japan’s recent negative reaction to negative rates suggests.
While Fred and I don`t always agree on everything, I have a great deal of respect for his technical views. He also reminded me that this week is option expiry (OpEx), which tends to have a bullish bias. As a reminder, here is a slightly dated table from Rob Hanna of OpEx performance. February tends to be slightly positive, but not as positive as other months. If OpEx weeks have bullish biases, statistics also show that the week after OpEx tend to be mean reverting and display a bearish tendency.

Another well respected technician, Peter L. Brandt, recently made the case that US indices are forming potential tops. I won`t go through all of his charts, but here is the Dow as a sample of his thinking.

Note that Brandt qualified his opinion as “potential tops”, because as every good technician knows, a head and shoulders formation is incomplete until the neckline breaks.
Regular readers will also recall that I have fretted over a lack of capitulation selling during this latest market downturn. TRIN has stubbornly refused to spike above 2, which is indicative of “margin clerk” price insensitive selling that are the typical of a washout bottom (also see Bracing for more pain). Just compare recent TRIN readings to the behavior of TRIN during the last sell-off in August and September:

Defining my risk
I would underline the fact that my SPX short position is a tactical trading call. As with all trading calls, I am defining my risk in terms of a potential Zweig Breadth Thrust (ZBT) that may be forming (for details of a ZBT see Bingo! We have a buy signal!). The chart below shows the ZBT signals on the top panel, the ZBT indicator in the third panel, which has 10 days from day 0 (last Thursday) to move from below 0.40 to 0.615. As Stockcharts can be a little slow in updating their signals, I have approximated a real-time ZBT indicator in the bottom panel.
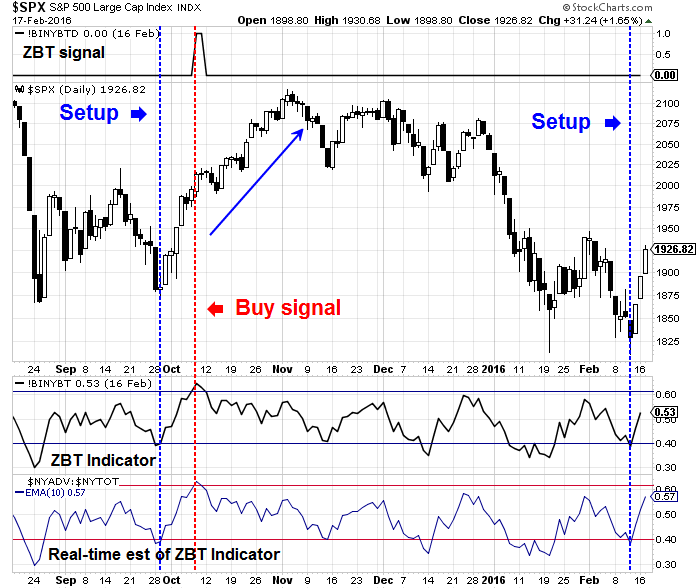
Readers who want to follow along at home can use this link for real-time updates of this chart. While I am not holding for a ZBT signal, as they are extremely rare, I am keeping an open mind and using it to define the risk of my short position.
Disclosure: Long SPXU
Cam, thank for the update. It’s helpful to understand your tweet earlier today. While I get the quantification of your downside risk for your tactical short today in terms of potential ZBT trigger, I’m not clear on the upside target for your tactical short today. Are you possibly targeting the first gap fill (190) or the second gap (187) as the short term upside target for your tactical short position today?
Assuming that the short position works out for me, I would define my profit triggers as oversold readings on the various metrics that I follow.
Gotcha, thank you.
Cam, While not all of us follow you on Twitter, I believe that most of your subscribers would appreciate a simultaneous email on any trades you announce on Twitter.
Thanks
I will do that in the future, but I don’t want to turn the focus of this site to tactical trading.
In response to reader comments in the recent survey, I have added a mid-week technical comment. (Also see last Wednesday`s post: Bracing for more pain).
Further tactical trading commentary is highly labor intensive and would probably involve creating a new tier of service, whose market rate is around USD 100 per month. I doubt if there is that much demand at those kinds of pricing levels.
Cam- I agree with Stephen that it would be most helpful to your subscribers who may not be able to follow you on Twitter all day if you would send a simultaneous e-mail when you were taking a position. Thank you!
I second Stephen’s opinion !
Cam, the comments made by Janice, Stephen and Cedric are probably just saying that a quick email that has a copy-paste of your twitter post would suffice not necessarily a detailed tactical note unless you plan on covering that in your mid-week tactical comment.
On the other hand, the present service is, in my mind, really excellent value for money, and if we start asking for more, then Cam might figure he needs to hike the subscription rate to make it worth his while. For me, it’s really no problem to spend 90 seconds each afternoon to check his Twitter.
I’d agree with Martin. Taking a break from work and checking Twitter (while walking if you are an office dweller) is a good idea.
I agree. Not only that but too much actions might affect quality.
Cam, Interesting to see you going short here based on TRIN and 10MA % where in the past you have looked at the VIX and cumulative cashflow bear & M Mkt which are showing just the opposite and also note a more bearish tone. To me one thing that has been useful (as I trade mostly intermediate to long term) has been the % of stocks over the 200 MA once this goes below 40% markets tend to favour the downside. Hindsight is 20/20 but I guess if we look back the high yield and transports last year were signalling what we are now seeing in the market. Based on Lowrys work past bottoms have formed once we get some capitulation followed by 90% up days – the last ZBT signal was not stellar. Nevertheless the line in the sand still remains if we hold 1800 on the S&P. Appreciate your insight as it has helped me look at a few more tools. Cheers!