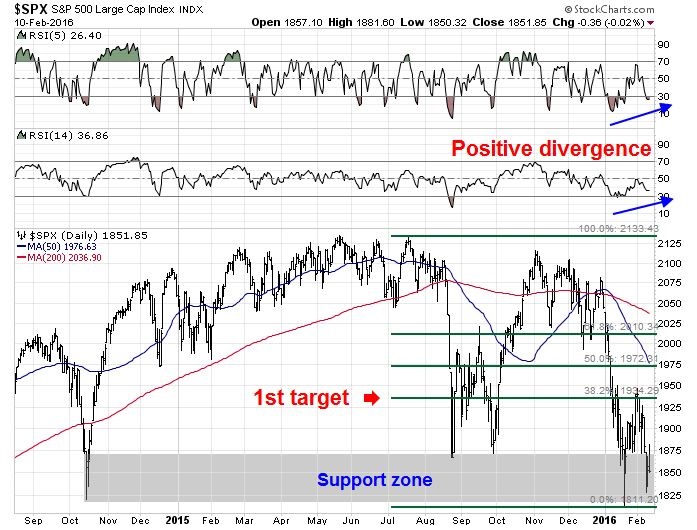
In theory, stock prices should be poised to rally. The SPX is testing a key support zone dating back to October 2014 and it is experiencing positive divergences on the 5 and 14 day RSI. If it did bottom here, the initial target would be the first Fibonacci retracement level at about 1935, with further resistance at about 1975 and 2010.
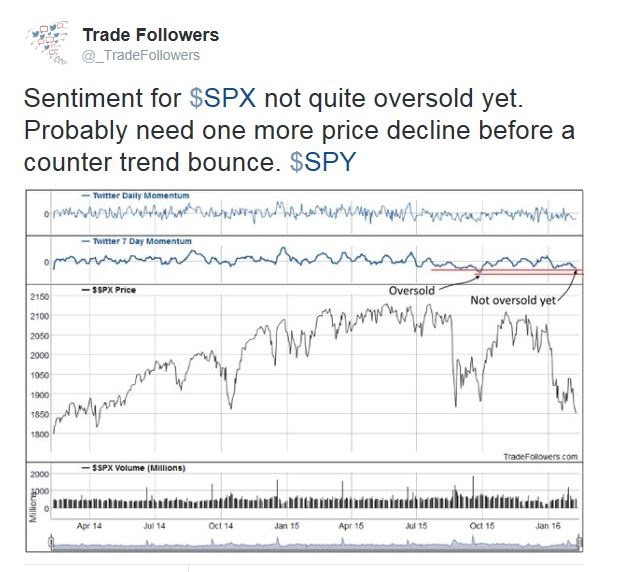
The bulls are set up for some short-term disappointment. I wrote on Sunday that I expected further stock market weakness ahead for this week because momentum was weak and readings were not oversold (see Waiting for the market to heal). Monday’s market action did not disappoint that forecast.
The omens were positive for for a bullish reversal on Wednesday. Overnight, the shares of Deutsche Bank soared on a rumor of a buyback of its senior debt as a demonstration of its balance sheet strength and European bourses rallied in sympathy. At one point, ES futures were up over 1% in the overnight market. By the time the dust settled at Wednesday’s close, the SPX was flat on the day.
Bears still in control

No panic
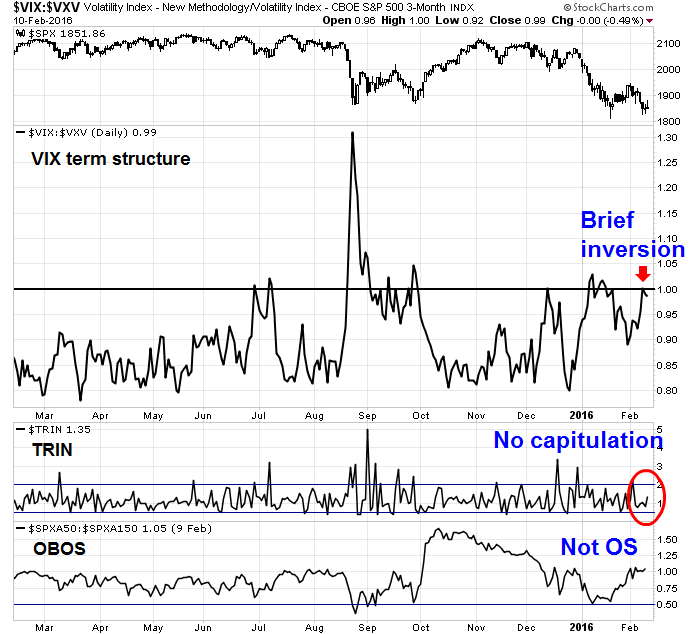
In addition, we have not seen the kind of panicky capitulation wash-out that are the characteristic of V-shaped market bottoms. The readings my Trifecta Bottom Model, which has had an uncanny ability to spot bottoms in the last three years (full description here), is disturbing. The Trifecta Model consists of the following three components:
- VIX term structure inversion: Which measures rising fear in the option market much better than the absolute level of the VIX Index;
- TRIN: When TRIN is above 2, it is often an indication of capitulative price-insensitive selling, otherwise known as margin clerk market; and
- OBOS: This is an intermediate term oversold indicator which indicates an oversold condition when the indicator falls below 0.5.
The chart below shows the Trifecta Model readings today. The term structure of VIX inverted briefly on Monday, which indicates rising panic among option traders. However, the medium term OBOS model is nowhere near an oversold reading. More importantly, TRIN is showing zero evidence of price insensitive selling, where traders get taps on the shoulder from their risk managers to reduce position sizes and individual investors are forced to sell by margin clerks.
Throughout this period of market weakness in 2016, I have felt a sense of unease over the lack of capitulation (see Explaining the lack of capitulation (and what it means)). Michael Batnick at The Irrelevant Investor also made the same observation about the lack of market panic.
Maybe we will get the flush or maybe we won’t. Maybe we get a flush, consolidation, then more flushing. Who knows? There is no formula for markets like this, which is what makes it so fascinating to watch. In the short term, fundamentals mean literally nothing and lines in the sand are drawn and erased daily. Psychology takes over and selling begets more selling until….”and then just like that, somebody turned off the rain and the sun came out.”
Bottom line: The bulls tried to push prices up today and failed. The bears remain in control of the tape. My inner trader is staying in an all-cash portfolio and bracing for more market pain ahead.
I repeat my question from previous post(s), do you have history of your trifecta model going back to 2006-2009? I’m wondering if the readings from those severe time periods tell us something about the lack of a market panic or tradeable “flush”?
Furthermore, I believe the bulls were hoping for friendly/dovish comments from Yellen’s testimony today but they didn’t get that from what I can make out. She seemed to communicate that 1) the FOMC is confused about the appropriate action, 2) need more time i.e. data dependent, 3) suggested nothing by saying rates can go up (stay course) or go down (NIRP) depending on # 2…all these comments imply more strength to the bears by the implication that the Fed isn’t coming to the rescue anytime soon.
Thanks Cam for these posts.
Just heard a webcast form Fidelity’s Jurrien Timmer. Sees three drivers of market: liquidity, earnings and valuation. First 2 negative last neutral. Credit and low commodity prices also dragging down market. My opinion is this all points to something worst than 2011 or 1998 but maybe not as bad as 2000, 2008. Anyone agree??
Looks more like 2011. 2008 was a two-three sigma event and shouldn’t be repeated for a hundred years.
Technical analysis is both art and science. If my analysis is a little of each– and knowing that I know very little and that the markets are always right– it appears to me that:
(1) The dominant trend is down
(2) If ES remains below the 1900-1925 area ( as I type this ES is at 1841) we are setting up for a decline to at least 1800 and likely lower on ES.
(3) Real people ( not algos) will leave the markets in droves, driven by fear, disgust and fatigue. They will likely leave just before a turn comes, since human nature does not change, and fear is almost always stronger than greed. The algos will be frolicking all the way down and up.
While the $SPX is down even more since the most recent prior low on ~1/21, the ratio of the $SPXEW to the $SPX, the $BPSPX and the $SPXA200R all show positive divergence since 1/21. So maybe there is some light at the end of the tunnel.
On the volume side, the Force Indicator shows positive divergence, but Chaiken’s Oscillator and On Balance Volume don’t confirm it, so maybe there’s a few more down days before a turnaround ensues. We shall see.
-RAS
In a down market, technical analysis and point of view becomes dominant while I think fundamentals outweigh in the long run. So Cam, what is the view fundamentally?
How did your Trifecta Model look today at the lows when S&P broke 1812?
Reading the comments here, it looks like Cam’s capitulation signal might be just around the corner. 😉
I can’t foresee NIRP in the US right now, Isn’t this what the FED would have been expecting … that people freak once they start tightening. Crashing oil prices and talk of China landing–hard or soft–has been going on now for five years.
Didn’t mean to imply oil crashing for five years… Just talk of China crashing. Even Roubini isn’t expecting another 2008. Just a bumpy ride sideways for a while.
The situation on the market now looks much better. I have a feeling that I have missed the beginning of the rally. The question is if to enter long positions on Monday or not. Look forward to your analysis.