Preface: Explaining our market timing models
We maintain several market timing models, each with differing time horizons. The “Ultimate Market Timing Model” is a long-term market timing model based on the research outlined in our post, Building the ultimate market timing model. This model tends to generate only a handful of signals each decade.
The Trend Model is an asset allocation model which applies trend following principles based on the inputs of global stock and commodity price. This model has a shorter time horizon and tends to turn over about 4-6 times a year. In essence, it seeks to answer the question, “Is the trend in the global economy expansion (bullish) or contraction (bearish)?”
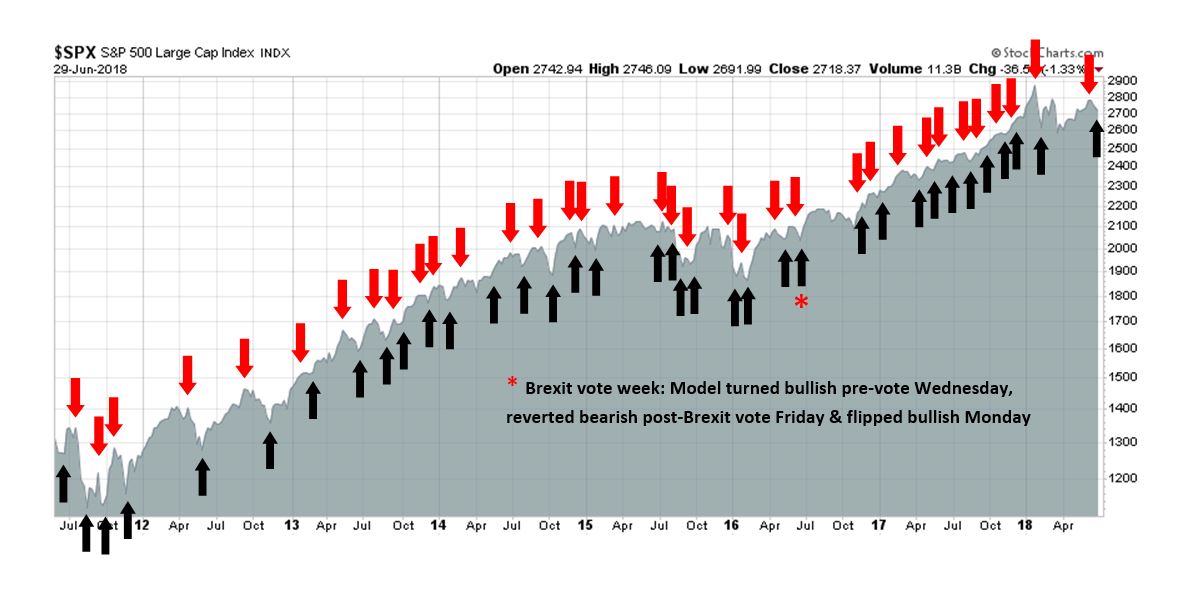
My inner trader uses the trading component of the Trend Model to look for changes in the direction of the main Trend Model signal. A bullish Trend Model signal that gets less bullish is a trading “sell” signal. Conversely, a bearish Trend Model signal that gets less bearish is a trading “buy” signal. The history of actual out-of-sample (not backtested) signals of the trading model are shown by the arrows in the chart below. The turnover rate of the trading model is high, and it has varied between 150% to 200% per month.
Subscribers receive real-time alerts of model changes, and a hypothetical trading record of the those email alerts are updated weekly here.
The latest signals of each model are as follows:
- Ultimate market timing model: Buy equities
- Trend Model signal: Neutral
- Trading model: Bullish
Update schedule: I generally update model readings on my site on weekends and tweet mid-week observations at @humblestudent. Subscribers receive real-time alerts of trading model changes, and a hypothetical trading record of the those email alerts is shown here.
Non-US weakness = ?
The markets have taken a risk-off tone recently, which raises the perception of a global slowdown. The protectionist measures announced by the Trump administration have not helped matters, and it appears the global economy is becoming increasingly fragile.
Three weeks ago, I asked if global markets could rise if it depended on purely US leadership (see Can America still lead the world?). Since then, US stocks have staged an upside relative breakout against the MSCI All-Country World Index (ACWI). The performance of non-US equities in both the developed countries (EAFE) and emerging market countries (EM) appear challenging.

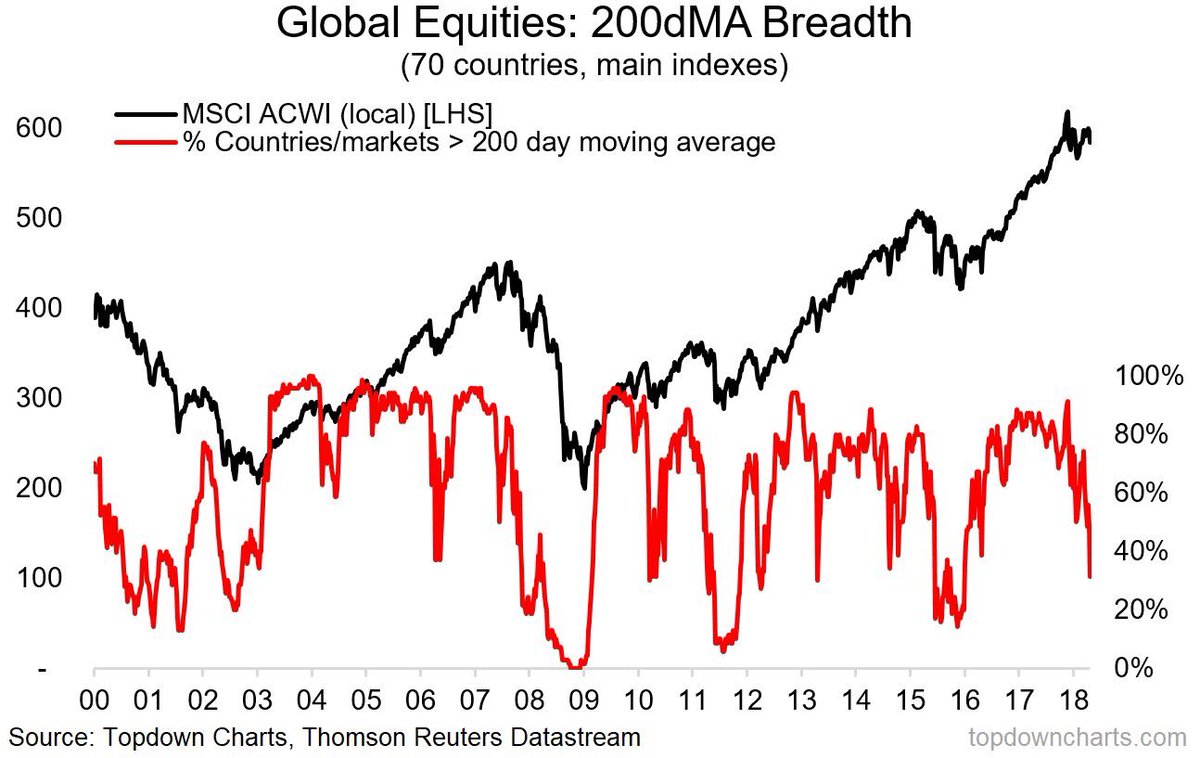
The following chart from Topdown Charts shows that global breadth is deteriorating. The number of countries whose stock indices are above their 200 day moving averages (dma) has plunged precipitously.
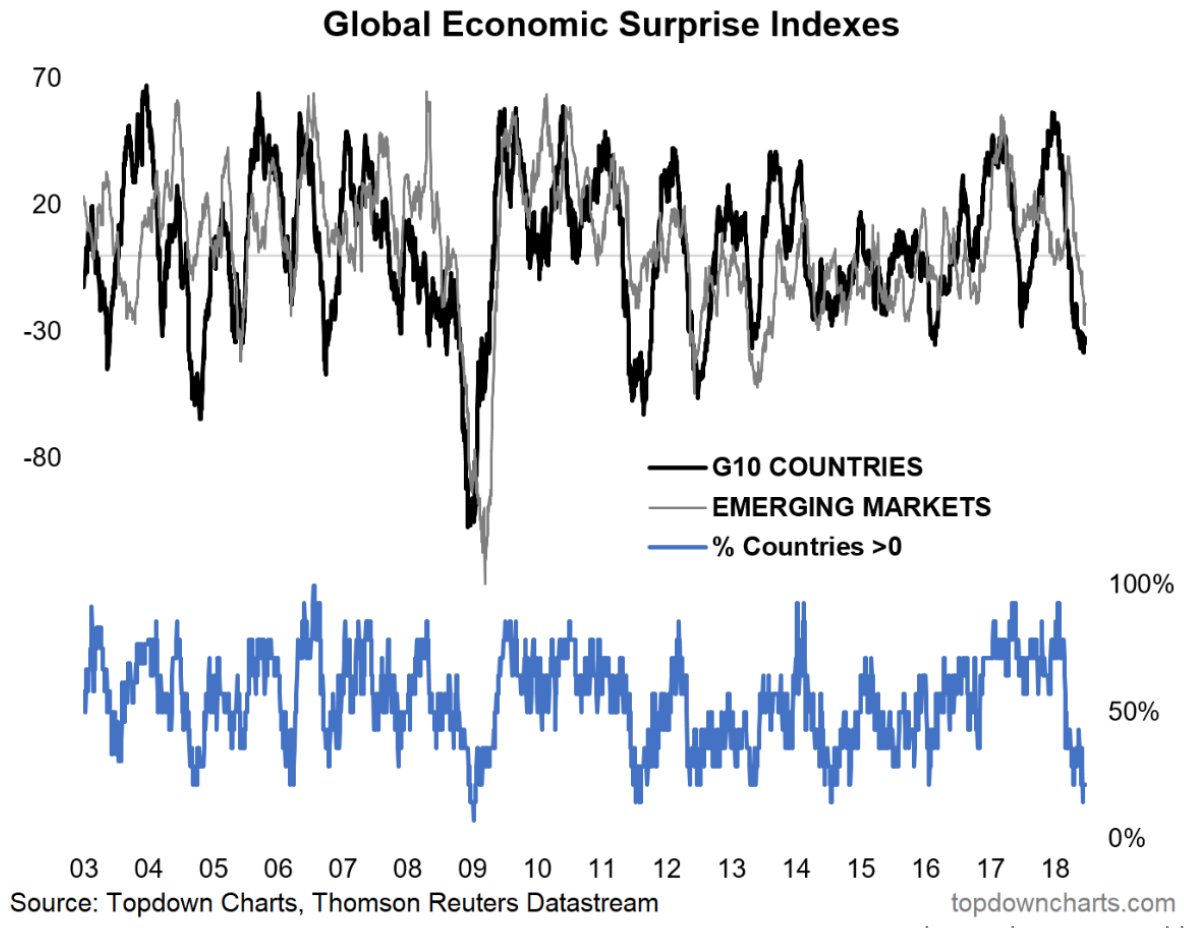
These readings either represent a terrific buying opportunity, or an ominous signal of an impending global recession. The bear case is supported by the deterioration in global economic surprise indices (ESI), which measure whether economic releases are beating or missing expectations. As the following chart shows, global ESIs have been falling. Moreover, the bottom panel shows that the percentage of countries with ESI greater than 0, indicating a balance between positive and negative surprises, are at recessionary lows.
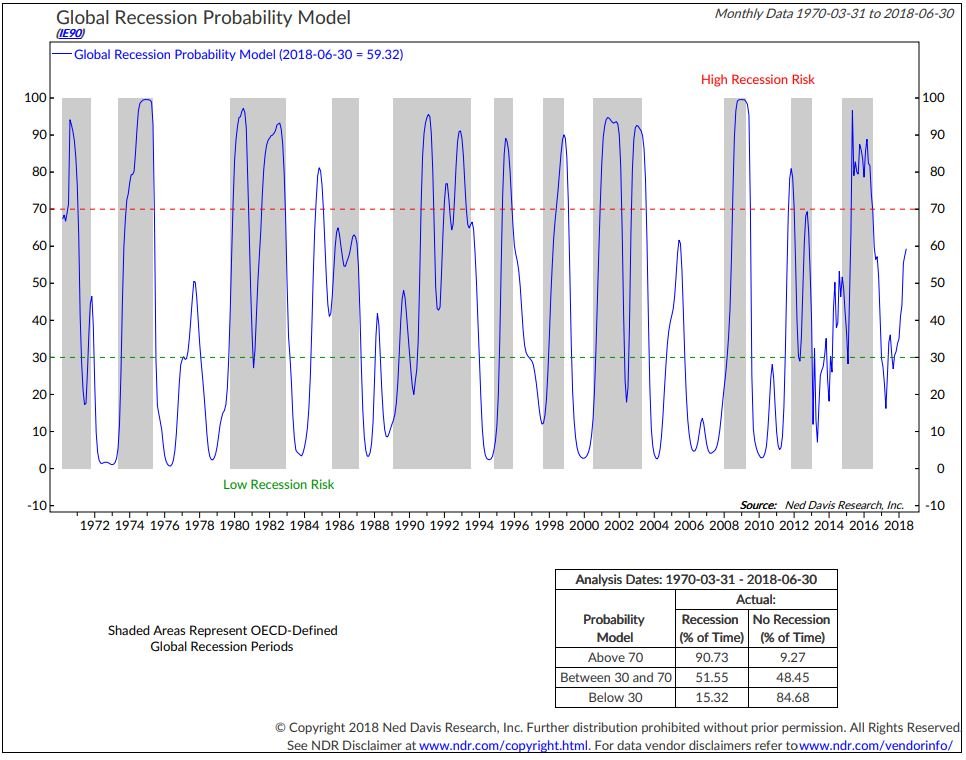
The probability of a global recession is rising rapidly, according to Ned Davis Research.
Is this the beginning of the end? Is the world about to crash into a global slowdown? To answer those questions, I consider the outlook for the three major trading blocs, the US, China, and Europe. During the course of my analysis, I discovered a bullish catalyst hiding in plain sight.
Upbeat America
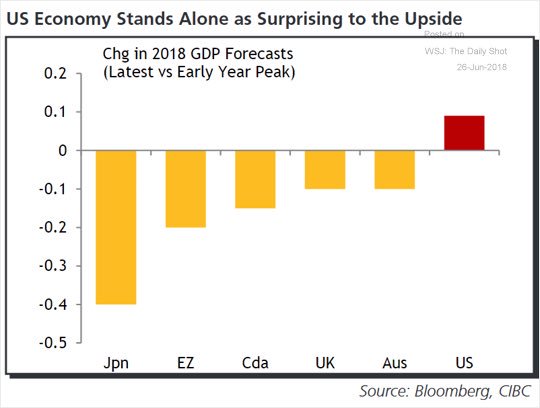
Starting in in the United States, this region is the bright spot of global growth. The Atlanta Fed’s nowcast of Q2 GDP growth stands at a blistering 4.5%, though the estimate has pulled back from its previous highs.
An examination of global growth expectations shows that American economy stands along as surprising to the upside.
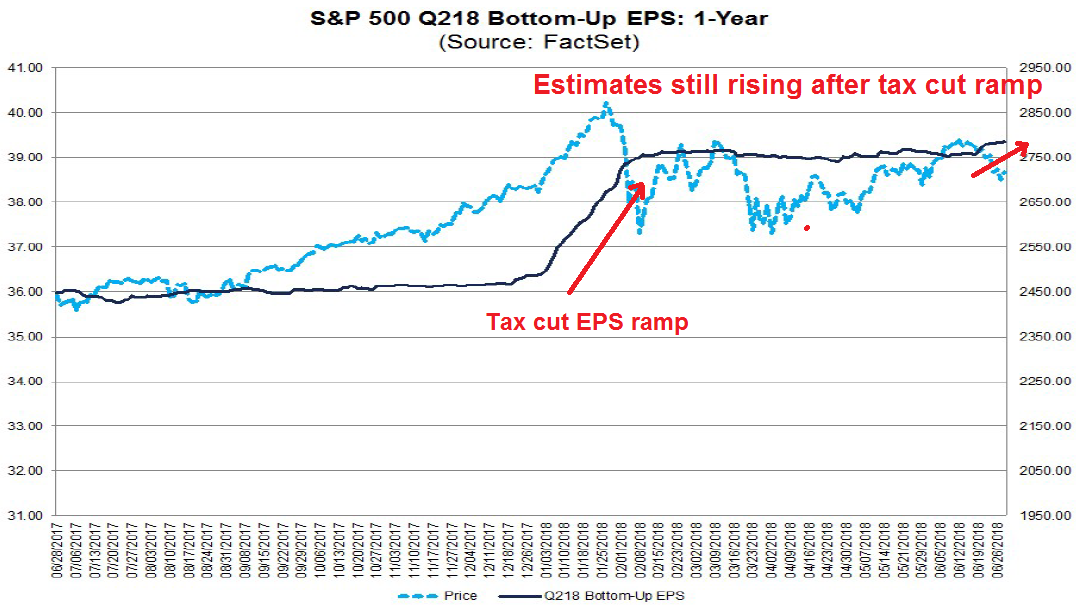
The latest update of the evolution of Q2 2018 EPS estimates from FactSet shows that earnings estimates are still rising even after the tax cut ramp. In the past, EPS estimates has shown a pattern of excess optimism and getting revised downwards as reporting date approaches.
Enough said. There is nothing wrong with the US economy. As I pointed out previously, the US is not at the immediate risk of a recession (see How close are we to a recession?)
Decelerating and overleveraged China
China is a different story. We all know about the trouble brewing in China. Fathom Consulting’s indicators show that growth is rolling over, and its estimate of actual GDP growth is 6.2%, which is well below the GDP growth rate.

Financial leverage remains a problem. In the wake the PBOC’s RRR cut which cut yuan borrowing costs, non-RMB debt costs are still stubbornly high. USD borrowing costs for highly indebted Chinese companies are breaching 10%.

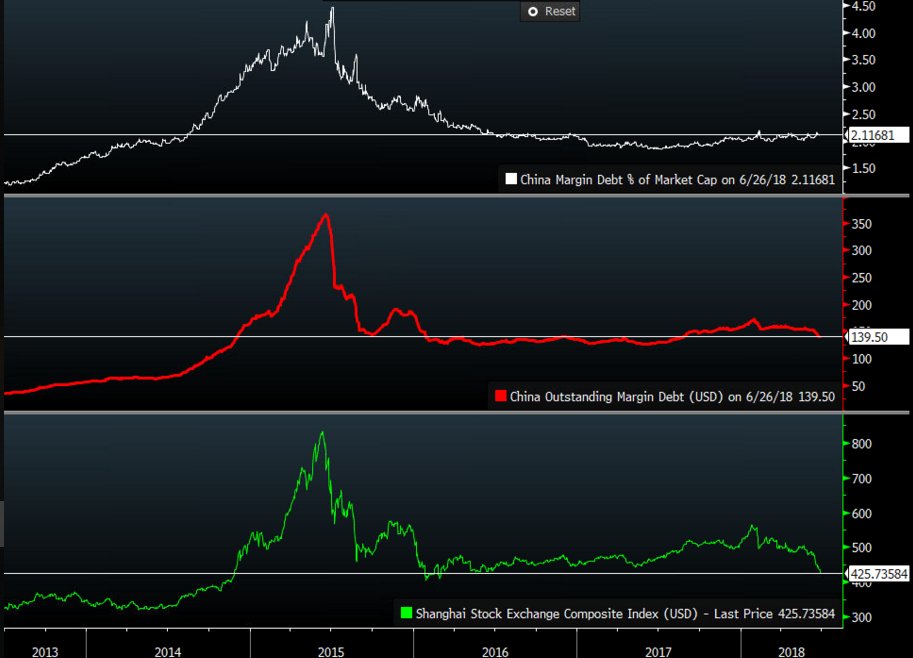
In addition, the PBOC’s move to cut the RRR has seriously weakened the CNYUSD exchange rate. While the RRR cut could be viewed as a technical adjustment to raise onshore liquidity so that Chinese banks could bring shadow banking assets back onto their balance sheets, it has also been interpreted as an effort to weaken the currency in the face of a brewing trade war with America. This brings up the spectre of a repeat of the episode of 2015, when a falling yuan cratered the Shanghai Index by 50%, and sparked a correction in global equity markets.

Here is the bull case. First, the current CNY weakness episode is different from 2015. As the above chart shows, the CNY devaluation occurred independent of the USD. Today, CNY exchange rate movement is largely attributable to changes in the USD Index.
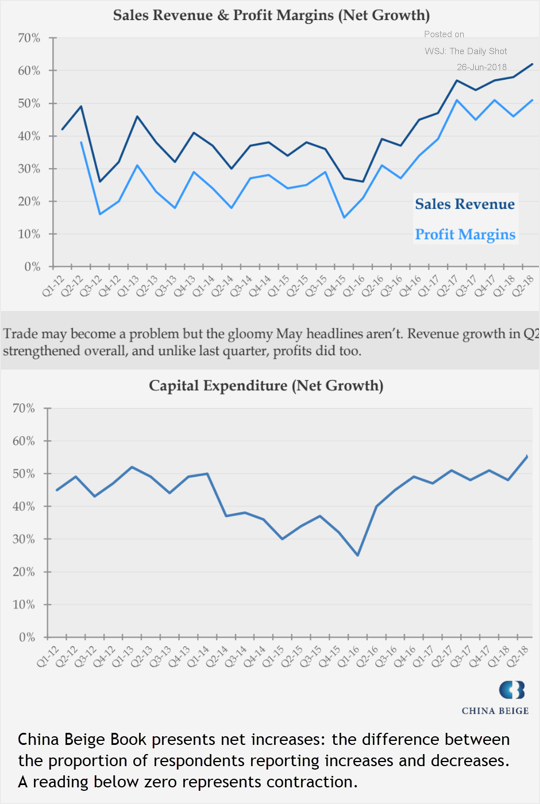
As well, Leland Miller of China Beige Book stated in a CNBC interview that Chinese growth is better than expected, and Beijing appears to be starting a stimulative cycle after a period of contractionary fiscal and monetary policy. China Beige Book found that sales and profits are rising, and so are capital expenditures.
In addition, the risks of a 2015-style crash in the Chinese stock market are overblown. In 2015, the decline in Chinese stocks was fueled by skyrocketing margin loans. This time, margin loans are nowhere near the levels seen in 2015.
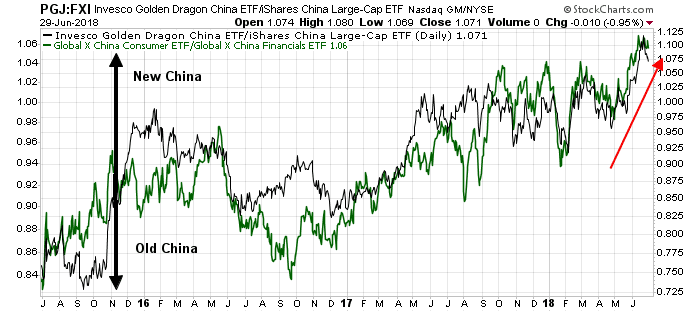
My own real-time market based indicators of Chinese rebalancing are on track. I track two pairs of New (consumer) China ETFs against Old (financial and infrastructure) China ETFs. Both pairs are pointing to the ascendancy of the New China.
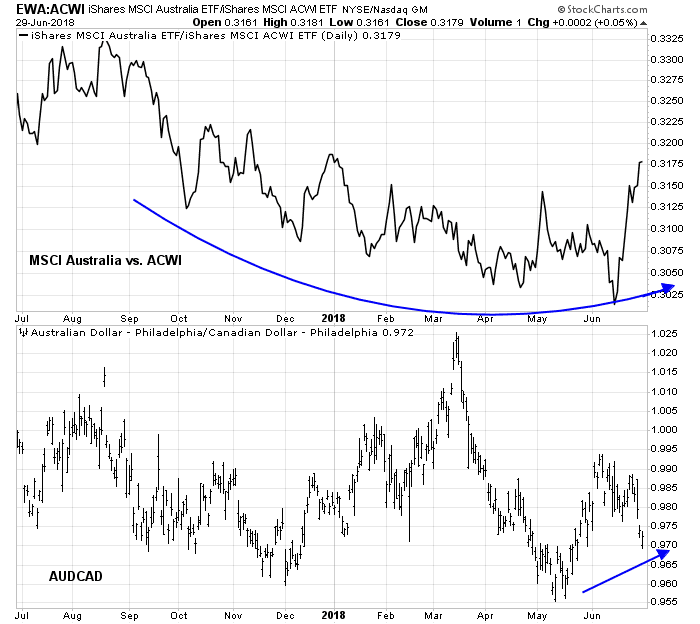
Here is one other real-time puzzle for the China bears. If the Chinese economy is tanking, why is Australia performing so well. The top panel of the accompanying chart shows the performance of MSCI Australia against ACWI, and the bottom panel shows the AUDCAD exchange rate. The economies of both Australia and Canada have similar resource-like characteristics, except that Australia is more sensitive to China, while Canada is more sensitive to US growth.
Dismal Europe
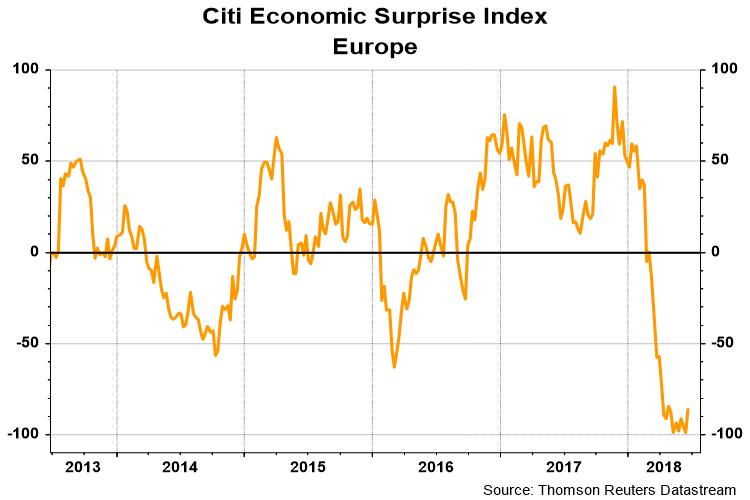
The apparent view in Europe also appears to be dismal. Angela Merkel is fighting for her political life. European ESI is rock bottom near -100, which is as low as it can get.
The shares of Deutsche Bank are hitting new lows virtually on a daily basis, and its performance is an illustration of how Europe never solved its banking problems since the Great Financial Crisis.

On the other hand, there are a number of silver linings in the European dark cloud. First, Italian consumer confidence unexpectedly rose last week. Wait, what? Yes, that Italy. The political unrest Italy. The Italy governed by the alliance between anti-immigrant Lega Nord and popular Five-Star Movement.

In addition, European stocks appear attractive. FT Alphaville reported that Citi strategist Jonathan Stubbs pointed out that the Free Cash Flow (FCF) of European companies have more than enough to cover their dividends. Stubbs went on to forecast a dividend bull market for European equities.

BNP Paribas strategists outlined a different bull case, namely that European ESI is as bad as it gets, and therefore they are contrarian bullish:
Economic surprise rebound could be a boost? Our analysis suggests that a recovery in surprise indices from an extreme low, as is currently being seen, could be followed by nearly 15% European equity market returns over the next six months . We believe that the latest dovish ECB meeting could be a catalyst for this change.
We just need a positive growth surprise and European equities will soar.
The bullish catalyst hiding in plain sight
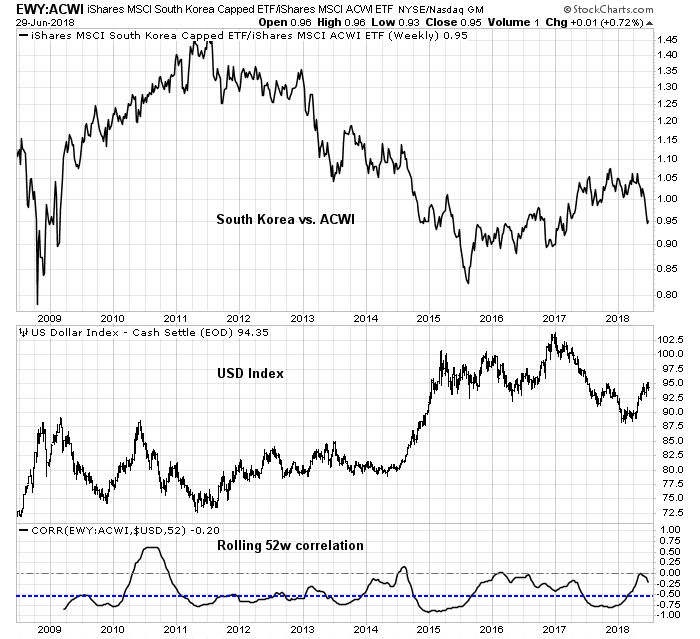
This brings me to my final point of a bullish catalyst for non-US equity, the US Dollar. The level of the USD is important because its performance has historically been inversely correlated to the relative returns of non-US markets. The accompanying chart shows the relative performance of emerging market stocks against ACWI, along with the USD Index. Historically, the rolling 52-week correlation between the two series has been negative. In other words, USD strength leads to EM underperformance.

Here is a chart of the relative returns of South Korea. I chose the Korean market for two reasons. First, it is highly sensitive to Chinese growth because of the physical proximity and trading relationship between the two countries. As well, the South Korean economy is a global indicator of cyclical growth. The long-term correlation between the relative performance of Korean stocks and the USD Index is also negative.
Over in Europe, the chart below shows the relative performance of the Euro STOXX 50 against ACWI (all in USD). While the recent relationship has turned negative, the long-term correlation pattern between the EURUSD exchange rate, which is largely the inverse of the USD Index, has historically been positive.

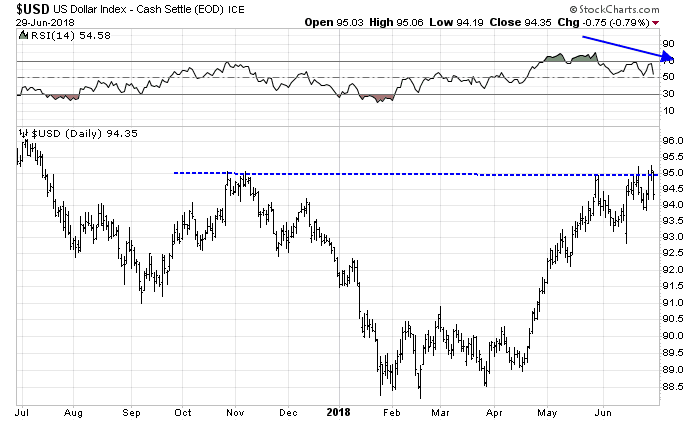
The bullish catalyst hiding in plain sight for non-US stocks is USD weakness. From a technical perspective, the outlook is hopeful. The USD recently failed at resistance while exhibiting a negative RSI divergence, which is bearish for the currency.
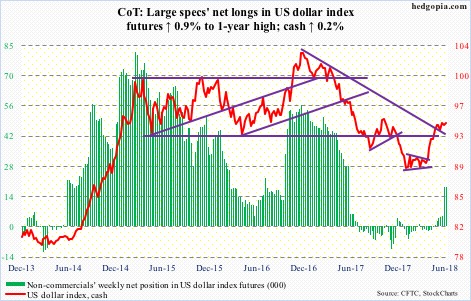
Moreover, the summary of the Commitment of Traders report from Hedgopia indicates that large speculators have pivoted from a net short to a net long position in USD futures. Dollar bulls today no longer have COT positioning as a sentiment tailwind.
We just have to wait for a fundamental catalyst for USD weakness. This could occur in the form of a non-US growth surprise, either in Europe or China. Expectations are extremely low in Europe, and analysis from China Beige Book indicates that it has already detected a Chinese growth surprise that is not reflected in the data.
Another possible trigger for USD weakness might be Trump toning back his belligerent trade rhetoric. As he embarks on the campaign trail for Republican candidates during the mid-term elections, he is likely to receive pushback from businesses as his tariffs begin to bite. These comments from the Dallas Fed’s manufacturing survey is just one example.
Fabricated Metal Product Manufacturing
- Steel tariffs to NAFTA partners is a mistake. Higher steel prices could slow down strong projects and the manufacturing recovery which started in fourth quarter 2017
- I can’t believe the effect the tariff response has had on the metals trade. Somebody needs their head examined if they think this is good for the American economy
- We are about to raise prices for the first time in six years due to the rising cost of steel and aluminum. This is going to cause some uncertainty, with our customers looking elsewhere to purchase products we manufacture
Machinery Manufacturing
- There is lots of uncertainty among manufacturers regarding the impact of the steel tariffs. Even steel sourced from the U.S. is rapidly in price due to capacity constraints
Consider these selected comments from the Kansas City Fed’s manufacturing survey:
“The steel tariffs are not helpful. Material prices are rising and these costs have to be passed along to the consumer.”
“Bracing for the worst concerning China tariffs. We will move the last of manufacturing off shore. Loss of business due to tariffs will have a larger impact than interest rates.”
CNN Money reported that about 21,000 companies have filed for tariff exclusions, indicating that trade actions are starting to bite. Unless these business concerns are adequately addressed, this kind of grassroots opposition from businesses is likely to create electoral headwinds for the Republicans.
In summary, I began this publication with the rhetorical question. Does the current round of non-US equity weakness represent a buying opportunity, or a signal of the beginning of a global recession? Current readings indicate that no signs of a uncontrolled deceleration in any of the three major regions. The ECB recently released a round-up of eurozone growth. They attributed the slowdown to a combination of cyclical and temporary factors, but the expansion remains solid.
Overall, the economic expansion should remain solid, supported by the underlying strength of the euro area economy. Although survey results have again moderated somewhat, they remain consistent with further solid growth. Going forward, the solid growth is expected to continue, albeit possibly at lower rates, as the ECB’s monetary policy measures continue to underpin domestic demand. Private consumption should continue to be supported by employment gains and rising household wealth. Investment is expected to strengthen further on the back of very favourable financing conditions, rising corporate profitability and solid demand. In addition, the broad-based global expansion is providing impetus to euro area exports.
A “solid expansion” is also a reasonable characterization of the global economy. In the absence of recession risk, I can only conclude that the current corrective period is a buying opportunity.
The most likely bullish catalyst is USD weakness. The USD Index is technically primed to pull back. We just have to wait for the fundamental trigger.
The week ahead: Bull or bear?
Looking to the week ahead, the market will be faced with a number of cross-currents. Asset prices are likely to respond to the headline of the day, but it is unclear which news they will focus on. On one hand, Caixin reported that China opened the economy to more foreign investments. Such a development could be interpreted as conciliatory and serve to lower trade tensions, which is bullish.
The National Development and Reform Commission (NDRC), China’s top economic planner, and the Ministry of Commerce jointly published the 2018 version of the so-called “negative list” on Thursday, which removed foreign ownership restrictions on some industries in China.
The number of restricted items on the latest list dropped to 48 from 63 the previous year. The new list will take effect on July 28.
In a statement on its website, the NDRC said that the culling of the negative list illustrated China’s commitment to further opening up its market to foreign investment.
The new list mapped out opening-up measures in 22 industries, including banking, mining, automotive, shipping, airplane design and manufacturing, railway construction, and agriculture.
On the other hand, the expected victory of left leaning Obrador in Mexico’s election Sunday is likely to cast a chill on US-Mexican relations, and heighten the risk of a collapse of the NAFTA negotiations. As well, the news that North Korea is covertly increasing their nuclear warhead production could raise geopolitical in North Asia.
A similar set of bullish and bearish cross-currents can be found from a sentiment analysis perspective. I had written last week that one of the obstacles to a sustainable rally was the lack of fear, and the market may need a final wash-out before stock prices can rise in a sustainable fashion (see A trader`s guide to spotting market bottoms).
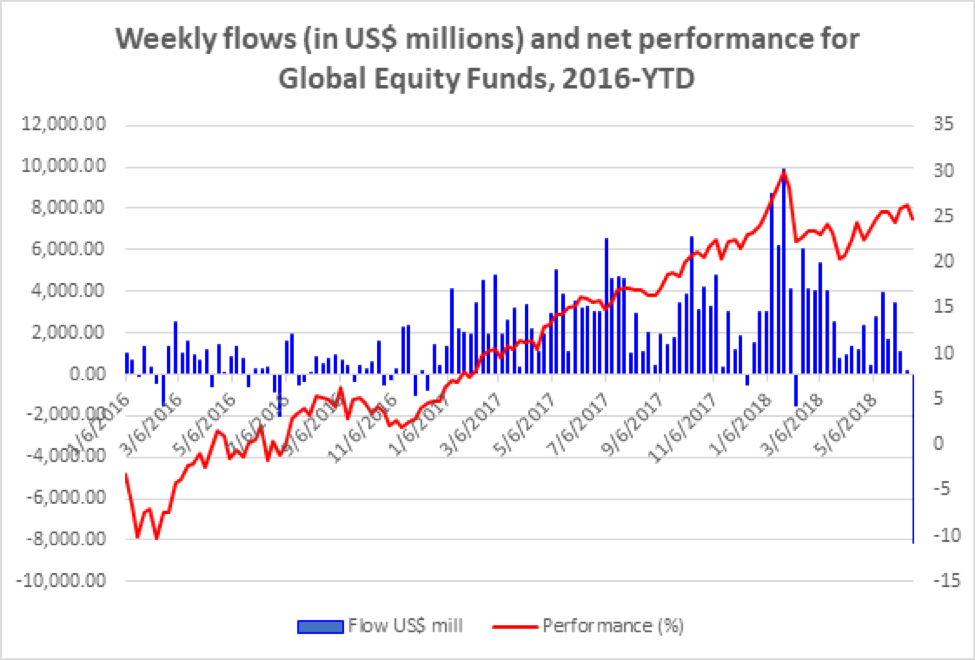
Since I wrote those words, BAML`s funds flow report found that last week was the second largest weekly outflow from equities in its recorded history, and it was the thrd larges ever outflow from US equities.
In addition, the CBOE put/call ratio spiked indicating rising anxiety. Even more encouraging were the days the put/call ratio rose when the market rallied, indicating price strength skepticism.

Jeff Hirsch at Trader’s Almanac also observed that July 1 is seasonally the second best day of the year for stock prices.
On the other hand, I pointed out that Saturday, June 30, is a major QT day for the Fed, when over $30b in Treasury securities are rolling off the balance sheet (see 4 reasons why the bull is still alive).
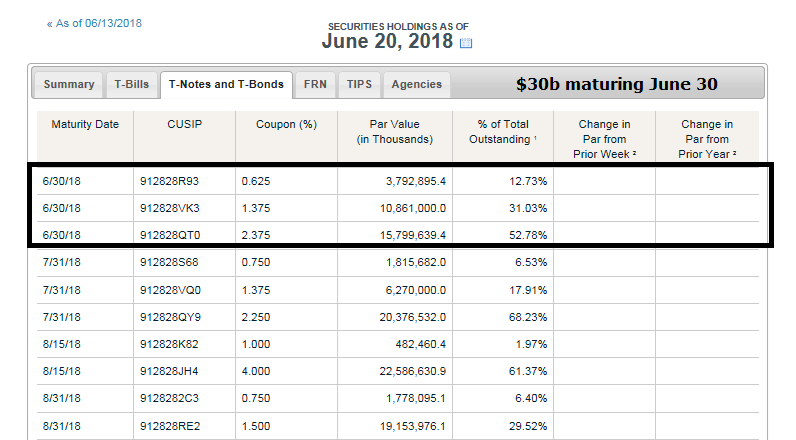
Kevin Muir at the Macro Tourist observed that QT days have been bearish for equities. Monday, July 1, will be a major test of the QT market weakness thesis.

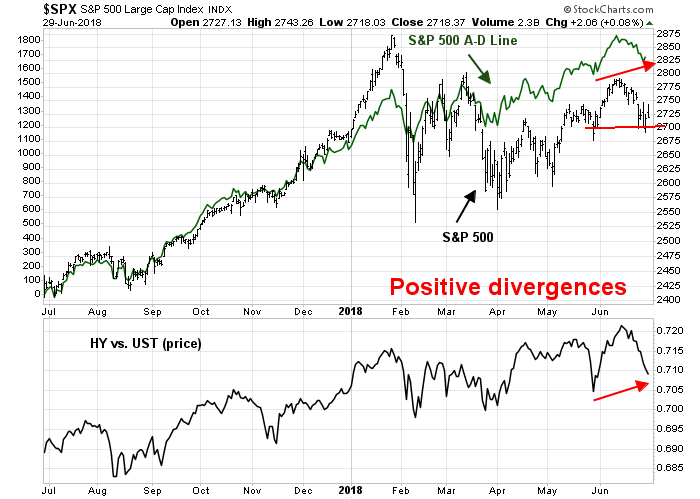
My inner investor remains constructive on equity prices. The intermediate term outlook remains positive, as measured by breadth and credit market risk appetite.
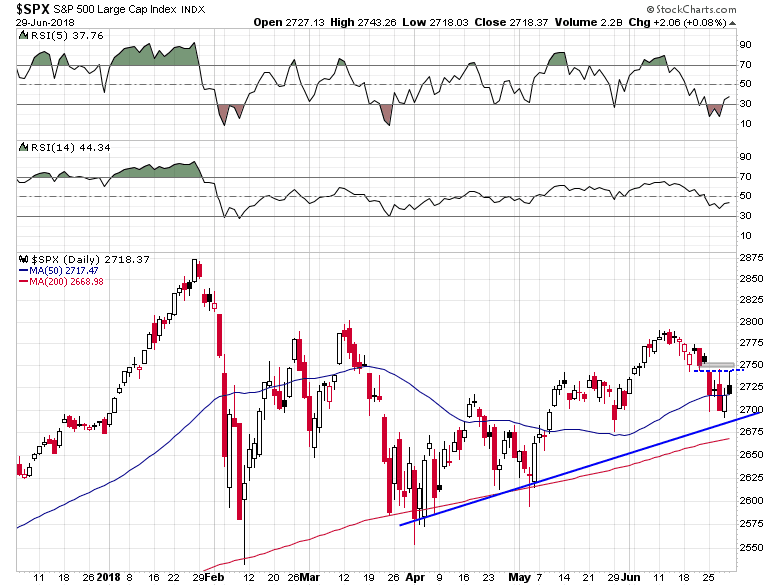
My inner trader covered his short positions early last week and dipped his toe in on the long side. He expects to add to his long position on Monday should the market hit an air pocket, or if the SPX stages an upside breakout above resistance at 2740 and fills the gap at 2740-2750.
Disclosure: Long SPXL
In my experience the performance of investor oriented companies is a bull/bear market indicator. They are currently breaking down after leading the market. That’s a clear bear market sign.
Here are two examples, Morgan Stanley, the most wealth management oriented bank and the Broker Dealers ETF that covers the industry.
Morgan Stanley
https://product.datastream.com/dscharting/gateway.aspx?guid=e4a7d8f6-6072-44ba-aeca-91343edc83a2&action=REFRESH
U.S. Broker-Dealers ETF
https://product.datastream.com/dscharting/gateway.aspx?guid=3a1f8633-35a7-47ee-b1ac-55dda3ab987c&action=REFRESH