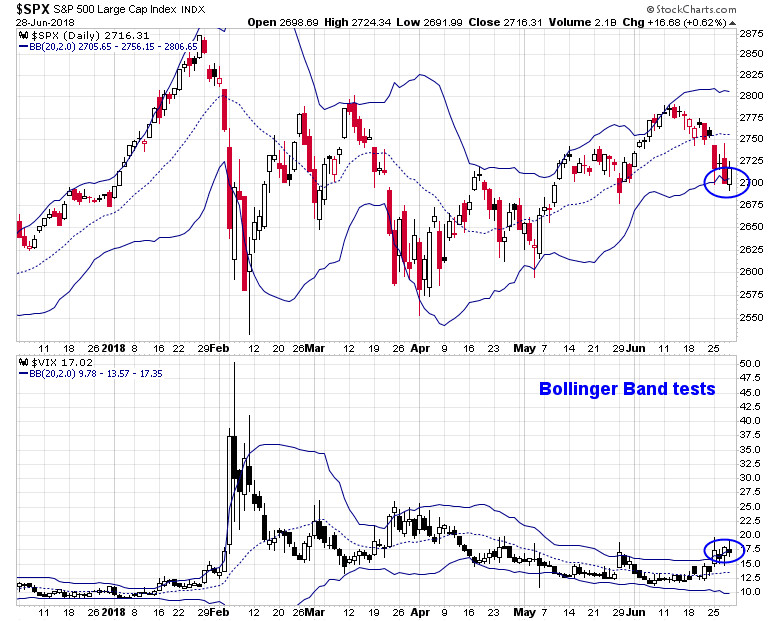
Now that the SPX flirted with the combination of the 2700 level and its lower Bollinger Band (BB), it’s time to see if the market is ready to bottom on a short-term and intermediate basis.
Let`s analyze outlook from the perspective of breadth, momentum, and sentiment.
Breadth and momentum
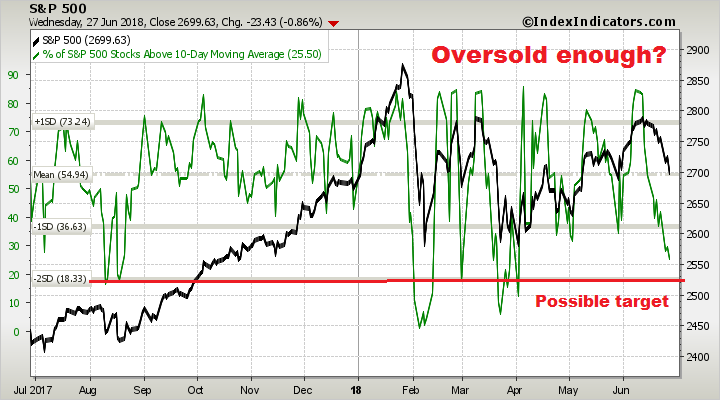
The readings from breadth and momentum indicators are mixed. The breadth reading from Index Indicators certainly indicates that the market is oversold, and it would be no surprise for stock prices to bottom and rally from these levels. But is it sufficiently oversold for a durable bottom?
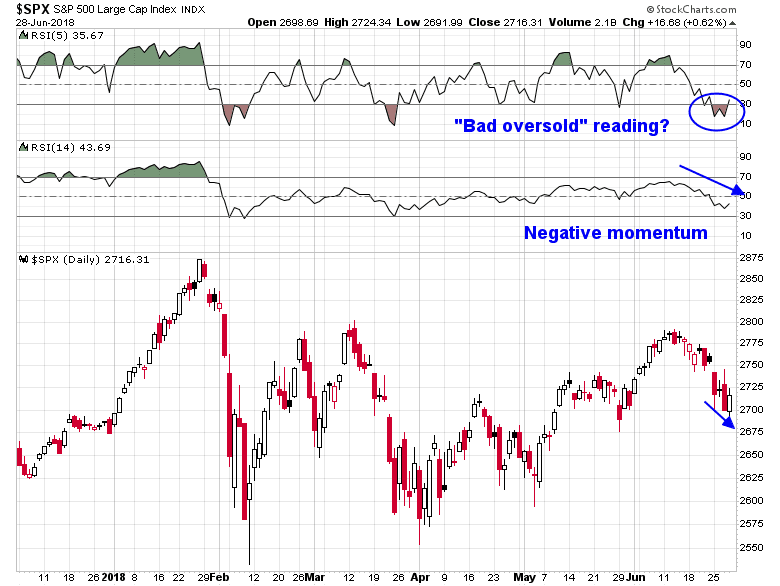
I wrote in my last post (see 4 reasons why the bull is still alive) that I was waiting for a re-test of the lows that was accompanied by a positive RSI divergence. We got the re-test yesterday (Wednesday) as the SPX undercut its previous low, but neither RSI-5 nor RSI-14 exhibited a positive divergence. Arguably, these readings could be interpreted as bearish because RSI-14 put in a lower low, indicating negative momentum, and RSI-5 remained oversold, indicating a “bad oversold” condition that implies further downside.
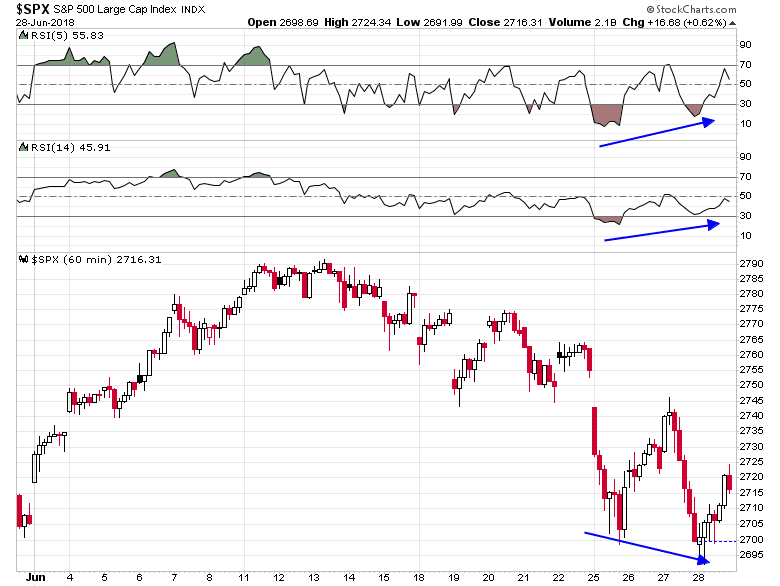
On the other hand, both RSI-5 and RSI-14 did show positive divergences on the hourly chart. That’s a thin thread for the bulls, but at best we can call it a wash.
Sentiment
There is both good news and bad news for the equity bulls on the sentiment front. Let’s start with the good news. AAII sentiment plunged this week when bullish sentiment pulled back and bearish sentiment spiked. While sentiment can get more bearish, the experience in the last 5 years has shown that downside risk is limited at these sentiment levels. I would note, however, that AAII sentiment is at best an intermediate term indicator and these charts are weekly charts. They tell us little about what might happen tomorrow or the day after.

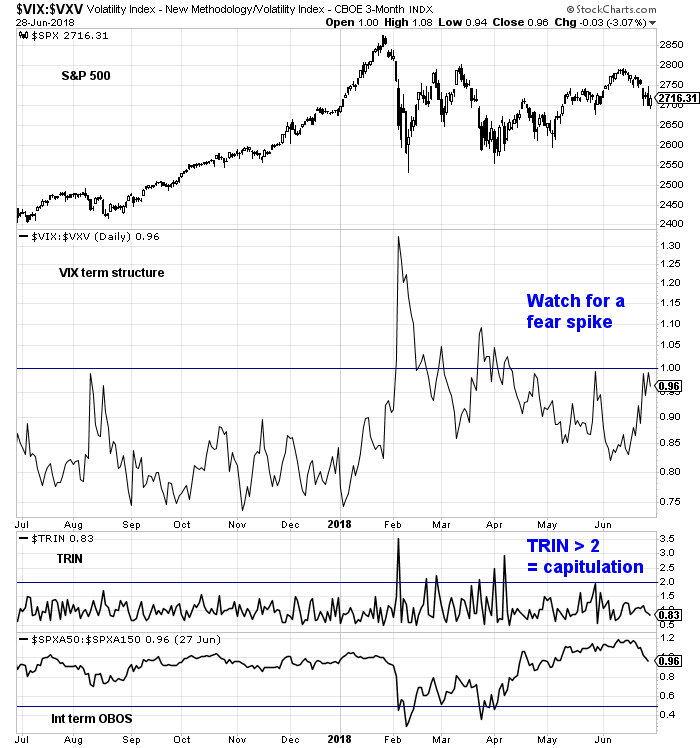
One worrisome feature of sentiment models is the market is not just showing enough panic for a durable bottom. None of the components in my Trifecta Bottom Spotting Model is flashing a buy signal. At a minimum, I would look for the VIX term structure to invert, indicating widespread fear, and TRIN to spike above 2, indicating a margin clerk/risk manager induced price insensitive capitulation. None of this has happened yet.
Putting it all together, I can conclude that the short-term bottom is near and downside risk is relatively limited, but the market is in need of a final flush before stocks can stage a sustainable rally. My inner trader covered his shorts earlier this week and dipped his toe in on the long side. He is waiting for signs of a capitulation low before fully committing himself as an unabashed bull.
Disclosure: Long SPXL
Today, the Sentiment Trader “Stem MR” model closed at .98 on a 0 to 1 scale for only the 4th time in 5 years. The other 3 times the S&P was lower 2 days later by an average of 0.8%.
Small sample, good potential for downside .