Preface: Explaining our market timing models
We maintain several market timing models, each with differing time horizons. The “Ultimate Market Timing Model” is a long-term market timing model based on the research outlined in our post, Building the ultimate market timing model. This model tends to generate only a handful of signals each decade.
The Trend Model is an asset allocation model which applies trend following principles based on the inputs of global stock and commodity price. This model has a shorter time horizon and tends to turn over about 4-6 times a year. In essence, it seeks to answer the question, “Is the trend in the global economy expansion (bullish) or contraction (bearish)?”
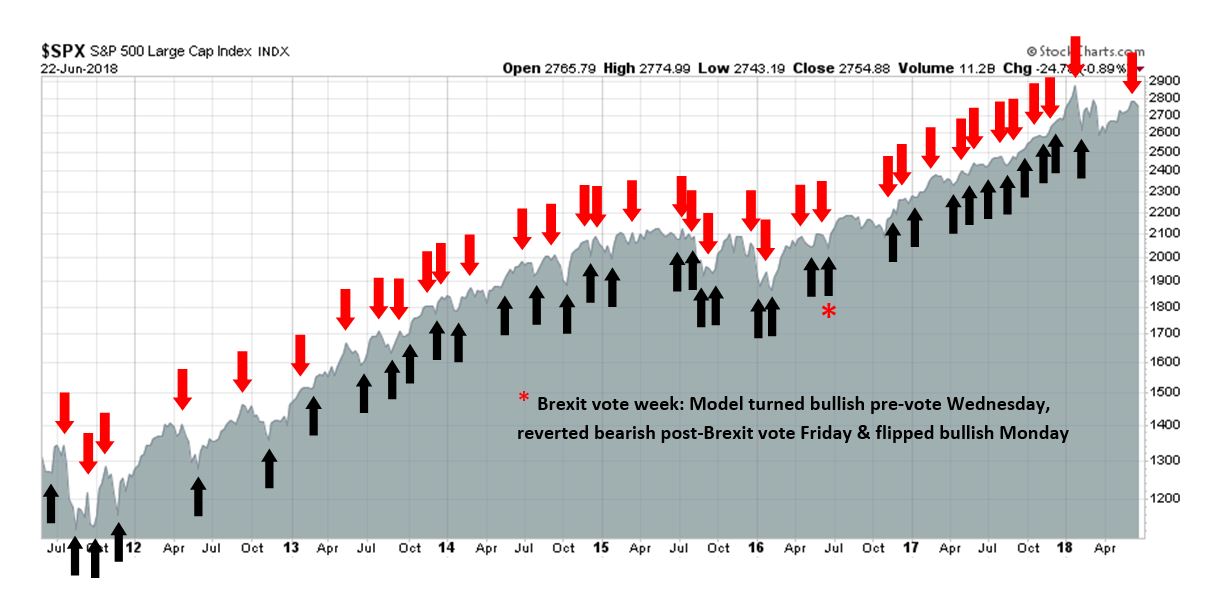
My inner trader uses the trading component of the Trend Model to look for changes in the direction of the main Trend Model signal. A bullish Trend Model signal that gets less bullish is a trading “sell” signal. Conversely, a bearish Trend Model signal that gets less bearish is a trading “buy” signal. The history of actual out-of-sample (not backtested) signals of the trading model are shown by the arrows in the chart below. The turnover rate of the trading model is high, and it has varied between 150% to 200% per month.
Subscribers receive real-time alerts of model changes, and a hypothetical trading record of the those email alerts are updated weekly here.
The latest signals of each model are as follows:
- Ultimate market timing model: Buy equities
- Trend Model signal: Neutral
- Trading model: Bearish
Update schedule: I generally update model readings on my site on weekends and tweet mid-week observations at @humblestudent. Subscribers receive real-time alerts of trading model changes, and a hypothetical trading record of the those email alerts is shown here.
Dueling recession forecasts
A minor scuffle erupted in the blogosphere last week. Fed watcher Tim Duy took issue with David Rosenberg’s recession call with an article entitled “No, A Recession Is Not Likely In The Next Twelve Months. Why Do You Ask?“. While Duy acknowledged that Fed policy is likely to be the trigger for the next recession, he disputed Rosenberg’s contention that a recession is about to begin.
I buy the story that the Fed is likely to have a large role in causing the next recession. Either via overtightening or failing to loosen quickly enough in response to a negative shock…
But the timeline here is wrong. And timing is everything when it comes to the recession call. Recessions don’t happen out of thin air. Data starts shifting ahead of a recession. Manufacturing activity sags. Housing starts tumble. Jobless claims start rising. You know the drill, and we are seeing any of it yet.
For a recession to start in the next twelve months, the data has to make a hard turn now. Maybe yesterday. And you would have to believe that turn would be happening in the midst of a substantial fiscal stimulus adding a tailwind to the economy through 2019. I just don’t see it happening.
Duy does not believe that Fed policy is tight enough to cause a recession in the near future:
As far as the Fed is concerned, I don’t think we are seeing evidence that policy is too tight. The flattening yield curve indicates policy is getting tighter, to be sure. But as far as recession calls are concerned, it’s inversion or nothing. And even inversion alone will not definitively do the trick. I think that if the Fed continues to hike rates or sends strong signals of future rate hikes after the yield curve inverts, then you go on recession watch.
With inflation still tame, however, the Fed may very well flatten the yield curve with two more hikes and then take a step back. To be sure, it will be hard to stand down or even reverse course on the yield curve alone. After all, the yield curve is a long leading indicator. It will be the outlying data. But there is a reasonable chance the Fed will not tempt fate in the absence of a very real inflationary threat.
Who is right? Tim Duy or David Rosenberg? In the past, every recession has been accompanied by a bear market.
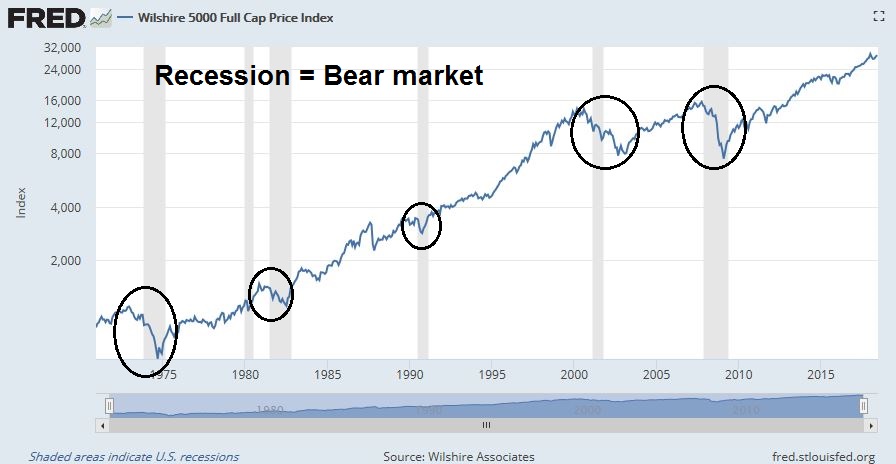
Is a recession just around the corner?
Reading the Fed tea leaves
If Fed policy is one of the main drivers of the next recession, then some key questions come to mind:
- How hawkish or dovish is Fed policy?
- How close is the economy to recession?
Fed chair Jerome Powell gave an important speech last week outlining his approach to monetary policy. Powell deviated from Fed orthodoxy by casting doubt on the effectiveness of the Phillips Curve in an environment of well-anchored inflationary expectations:
What would be the consequences for inflation if unemployment were to run well below the natural rate for an extended period? The flat Phillips curve suggests that the implications for inflation might not be large, although a very tight labor market could lead to larger, nonlinear effects. Research on this question is ambiguous, again reflecting the limited historical experience. We should also remember that where inflation expectations are well anchored, it is likely because central banks have kept inflation under control. If central banks were instead to try to exploit the nonresponsiveness of inflation to low unemployment and push resource utilization significantly and persistently past sustainable levels, the public might begin to question our commitment to low inflation, and expectations could come under upward pressure. So far, we see no signs of this. If anything, some measures of longer-term inflation expectations in the United States have edged lower in recent years.
If not inflation, then what should the Fed focus on? Powell went on and focused on financial imbalances as the cause of recessions [emphasis added]:
Can persistently strong economic conditions pose financial stability risks? Of course, strong economic conditions are a good thing! Such conditions can make the financial system better able to absorb shocks through strong balance sheets and investor confidence. But we have often seen confidence become overconfidence and lead to excessive borrowing and risk-taking, leaving the financial system more vulnerable. Indeed, the fact that the two most recent U.S. recessions stemmed principally from financial imbalances, not high inflation, highlights the importance of closely monitoring financial conditions. Today I see U.S. financial stability vulnerabilities as moderate and broadly in line with their long-run averages. While some asset prices are high by historical standards, I do not see broad signs of excessive borrowing or leverage. In addition, banks have far greater levels of capital and liquidity than before the crisis.
Powell speech can be seen from both dovish and hawkish viewpoints. The lack of inflationary pressures indicates that Powell is reluctant to be overly hawkish in raising rates. On the other hand, he is likely to keep on hiking and normalizing policy as long as financial stability risks are low.
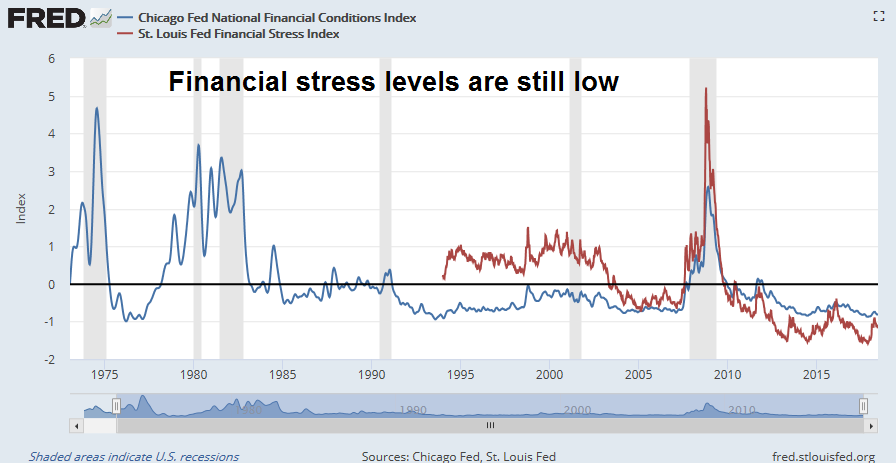
How low is financial stability risks, and what are long leading indicators telling us about the risks of a recession? Starting with the indicators from the Chicago and St. Louis Fed, current indicators of financial stress are tame, which are signals that credit conditions are still relatively easy.
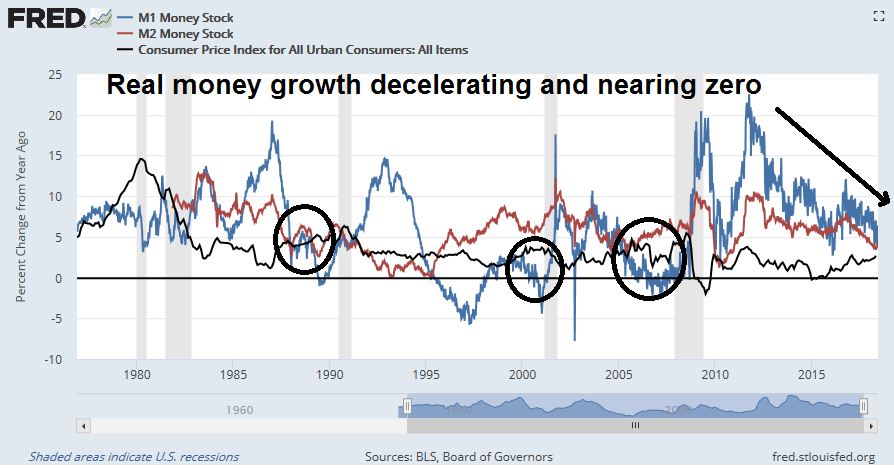
My other monetary condition recession indicators are all in neutral territory but deteriorating. In the past, either real M1 or M2 growth has turned negative ahead of recessions. Money supply growth is still positive, but decelerating. At the current rate of deceleration, real M2 growth will turn negative in Q3 or Q4.
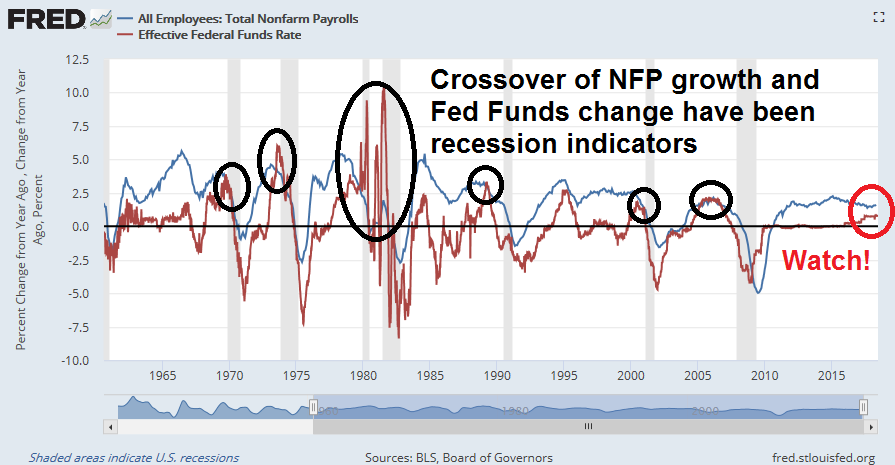
In the past, annual changes in employment and annual changes in the Fed Funds rate has converged ahead of recessions. At the current pace, the two lines are expected to cross late this year if the current pace of convergence continues.
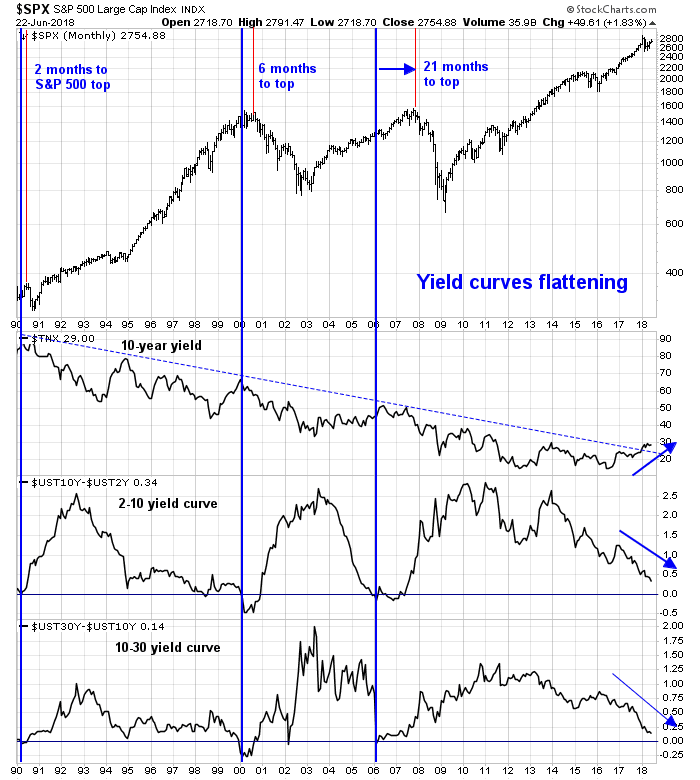
Yield curve inversions have also been an uncanny forecaster of past recessions. The yield curve is flattening, and should the Fed raise rates at the current pace, we should see an inverted yield curve either in late 2018 or early 2019.
While I do not believe in anticipating model readings, the current trajectory of these long leading indicators suggest that we will get a recession warning in late 2018, and a possibly recession in late 2019. Since the markets look ahead 6-12 months, that would put the window for a stock market top some time between this winter and next summer. I would caution that this is a highly speculative forecast, as we do not have the recession signal yet. In practice, I prefer to stay “data dependent” in determining my investment view.
Other recession wildcards
Assuming the speculative scenario that a recession were to begin in late 2019. That implies a probable market top about late this year. However, there are a couple of factors that could either spook the markets early or accelerate the recession schedule. The biggest threat is a trade war.
Much depends on how a trade war affects business confidence. Reuters reported that Jerome Powell expressed concern about rising business uncertainty because of trade policy.
“Concerns seem to be rising,” said Powell, speaking to a European Central Bank conference in Portugal. While Powell said he would not comment on specific proposals from the Trump administration, “for the first time we are hearing about decisions to postpone investment, postpone hiring, postpone making decisions. That is a new thing. If you ask is it in the forecast yet, is it in the outlook, the answer is no. And you don’t see it in the performance of the economy.”
Atlanta Fed President Raphael Bostic echoed the Fed Chair’s remarks in a recent speech:
I began the year with a decided upside tilt to my risk profile for growth, reflecting business optimism following the passage of tax reform. However, that optimism has almost completely faded among my contacts, replaced by concerns about trade policy and tariffs. Perceived uncertainty has risen markedly. Projects already under way are continuing, but I get the sense that the bar for new investment is currently quite high. “Risk off” behavior appears to be the dominant sentiment among my contacts. In response, I’ve shifted the risks to my growth outlook to balanced.
One important real-time indicator of trade jitters is soybeans, which is a target of China’s retaliatory tariffs. The bad news is prices have cratered. The good news is they are showing signs of stabilization, indicating that the initial round of panic may be playing out.

If Trump’s trade dispute with China extends into September, which is harvest season for soybeans, then a political dynamic begins to come into play. The negative effects of low agricultural product prices will begin to seriously affect the Republicans’ electoral prospects in the farm states, which formed the bulk of Trump’s support in 2016.
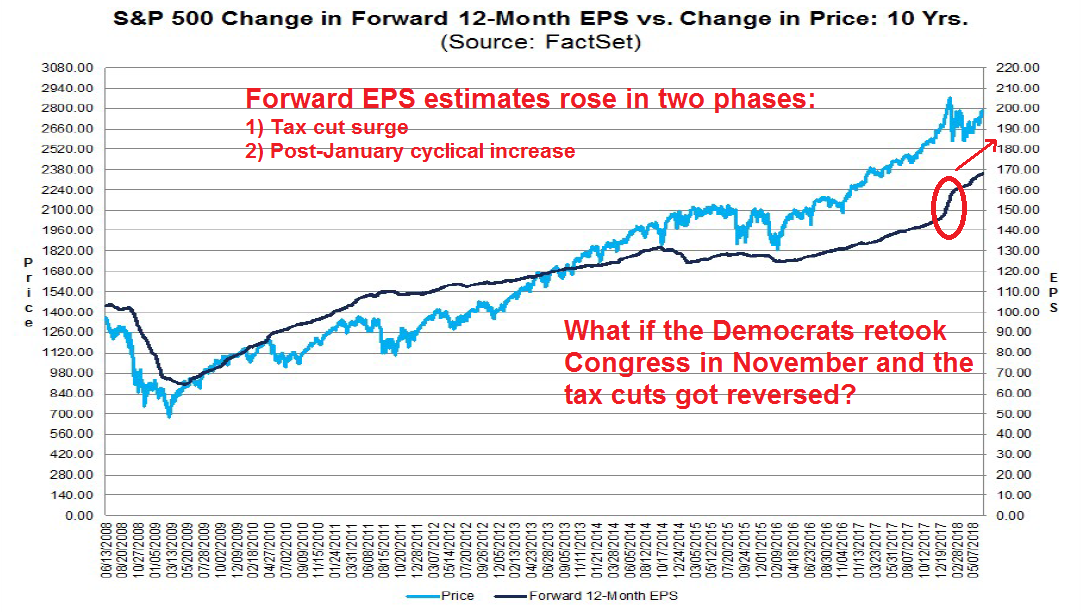
Should the Democrats make significant headway in the midterm elections and win back control of Congress, the market will begin to discount the reversal of the recently passed tax cuts. The boost to corporate earnings from fiscal policy in 2018 will turn into a headwind in 2019. The combination of contractionary fiscal policy and monetary policy could prove to be a potent combination that crashes economic growth. Watch the polls in the fall, as the markets will anticipate outcomes before the November elections.
The following chart from FactSet tells the story of how forward EPS, which are coincident with stock prices, have evolved this year. Earnings estimates rose in two phases, beginning with a tax cut surge, and then followed by a continuing cyclical rebound on business optimism. What if the Democrats retake Congress and the market begins to anticipate the reversal of the tax cuts?
The week ahead
While I remain intermediate term bullish on equities, I recently turned cautious (see Is the trade war correction over?). While the window for a correction that conform to the rally and pullback pattern that began in March is nearly closed, short-term readings suggest that a final flush may be in order before stock prices can stage a sustainable rally.
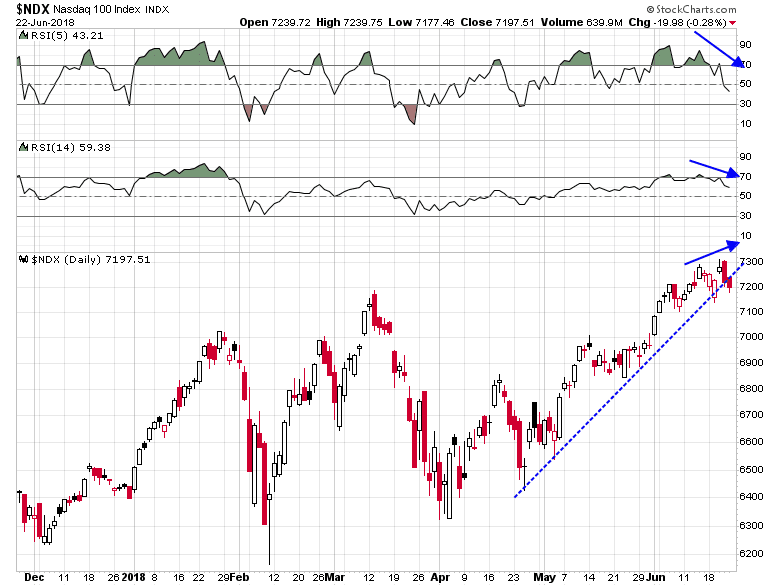
The most disturbing technical pattern is faltering leadership from the NASDAQ leadership. The NASDAQ 100 breached an uptrend line while exhibiting a series of negative RSI divergences.
Mid cap stocks also display a similar pattern of uptrend violation, and the weakness was confirmed by declining RSI momentum.

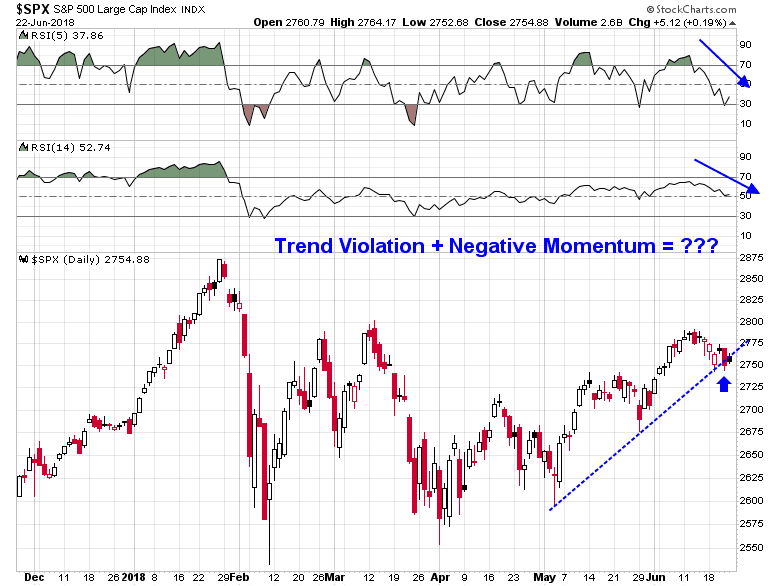
While small caps remain in an uptrend, I highlighted the vulnerability that these stocks face because of their high correlation with the USD Index (see What you may not know about small cap stocks). Equally disturbing is the uptrend violation shown by the SPX.
These technical conditions suggest that the market may either need to consolidate sideways, or it needs a final capitulative selloff to flush the weak hands out of their long positions.
I will be monitoring the performance of the price momentum factor, which remains in a relative uptrend. Watch for a test of the trend line should the market panic, and see if the uptrend stays intact.

My inner investor remains constructive on stocks. My inner trader is still tactically short, but his commitment is relatively light.
Disclosure: Long SPXU
I’ve been following David Rosenberg for over a decade since before the GFC. We chat and correspond often. He was voted best economist in the world at that time because he recognized the coming problems. Even the Fed governors said the subprime problem was a small thing. The economic community was caught flat footed. I call him a forensic economist. He follows sensitive current evolving data and dives deeper.
His current stance on earlier timing of a recession is because corporate indebtedness has doubled since the GFC and the quality of the credits has dropped. This makes the risk on corporate world equation more fragile. Also the demographics of consumer/savers is a new consumer spending risk. Generally the Fed has been overly gentle and willing to be behind the curve in their policy because they believed the economy in a post-GFC world was more fragile than before the crisis. Maybe they and Central Bankers around the world are right about this and the global and/or the American economy may turn down sooner than expected.
Tim Duy doesn’t have hundreds of PhD economists making projections like the Central Bankers have. Neither does Rosenberg but he has a track record of success going into the GFC fiasco.
Tim Duy is looking at standard old indicators for timing and I look around and see so many new factors that tell me to be cautious and trust those indicators less.
This doesn’t mean getting out of equities but rather to reduce exposure until some future bargain low accompanied by investor panic tells me to go back to a full exposure again. To me that bottom could come as early as October. That’s when the index puts I bought a week and a half ago expire.
Spelling error correction: Not “date dependent”, “data dependent”.
The Trump macro conditions are not favorable. Could this turn bullish after All the threats, rhetoric, retaliation?
That would be a minority view now. too many known unknows and a few unknown unknowns for comfort. Could the Fed delay the next increase to take some pressure off the markets.?
Remember Powell’s comments: “For the first time we are hearing about decisions to postpone investment, postpone hiring, postpone making decisions. That is a new thing. If you ask is it in the forecast yet, is it in the outlook, the answer is no. And you don’t see it in the performance of the economy.”
Translation: The Fed won’t act until it sees the effects on the performance of the economy. By then, it may be too late.
I can also see Powell’s point in waiting. How many of Trump’s tweets actually become policy?