This is one in an occasional series of articles highlighting hidden investing factors. For the previous article in the series, please see What you may not know about small cap stocks.
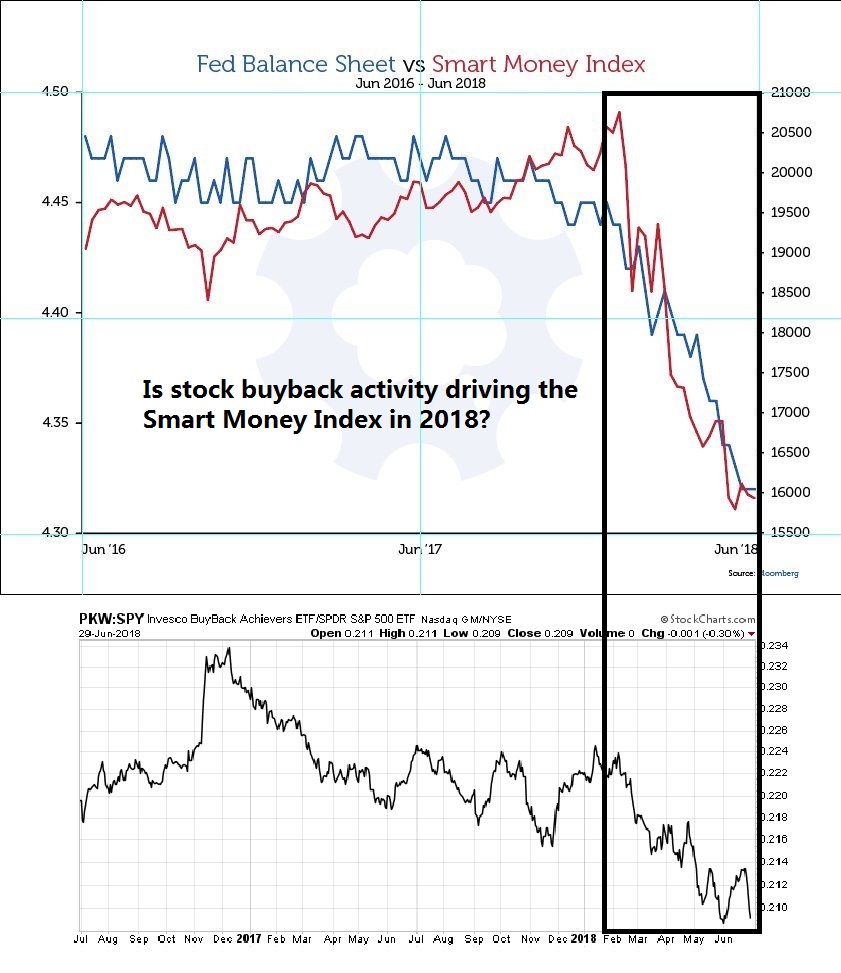
There has been some buzz in social media about the following chart that correlates the Fed’s balance sheet with the Smart Money Index (SMI). Readers can draw their own conclusions, but the initial take has bearish implications.
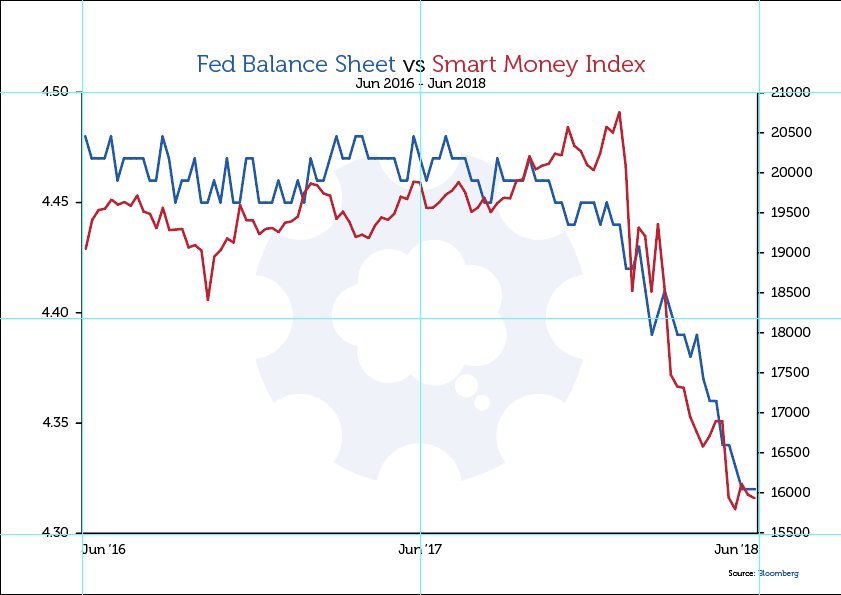
What’s behind the SMI, and is it bearish for stock prices?
Unpacking the Smart Money Index
I am indebted to Jesse Felder, who analyzed the SMI and explained how it is calculated:
Much has been made of the plunge in the Smart Money Index this year and for good reason. In the past, major downturns in the index like we are witnessing today have proved to be prelude to major downturns in stock prices. Many have wondered about the underlying dynamics for the decline in the index of late and I think it may be fairly easy to explain. The index simply represents the difference between the first 30 minutes of trading and the last hour. The idea here is that novice traders trade the open and more experienced traders trade the close. The difference reflects the net trading of these ‘smarter’ traders.
Felder went on to discuss two reasons why the SMI might not be capturing the same effect as it did a number of years ago. The first is the proliferation of ETFs and algo trading:
However, the truth is that with the dramatic rise in the popularity of ETFs the markets have changed a great deal in the past decade. The vast majority of trading volume is not performed by individual traders but by algorithms. In addition, the vast majority of trade volume also now occurs during the last half hour of trading as passive and other systematic vehicles perform their daily balancing acts needed to match their benchmarks.
I would agree with that assessment. When I managed institutional money, I understood that the time horizon of my models were sufficiently long that I had little or no edge in short-term price movements. My typical practice was to put my orders into an algo whose objective was to meet the volume weighted average price (VWAP) of the day, while limiting my order size to a maximum of 20-30% of average daily volume. We generally missed actual VWAP by a few basis points, because the algo was not perfect in predicting the volume during the day. Nevertheless, we recognized that the trading pattern tended have a “volume smile”, as depicted in this chart of SPY.
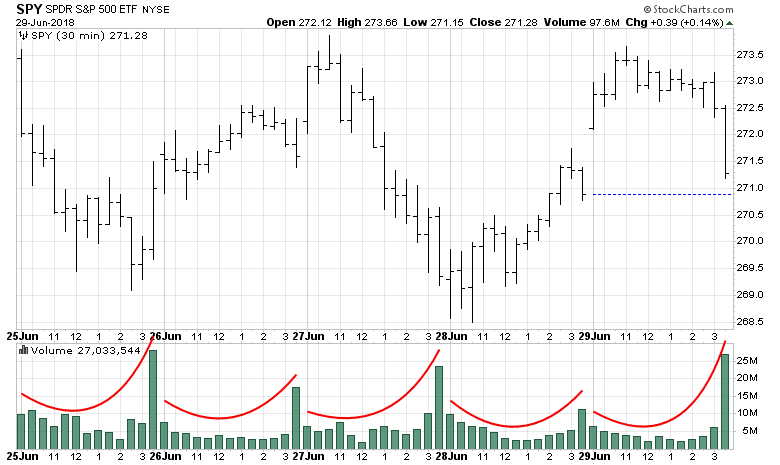
Final hour trading patterns can be chaotic, as market makers in different instruments scrambled to square their books by the end of the day. As Jesse Felder explained, these market participants cannot be characterized as “smart money”.
Buybacks driving SMI readings
Felder also cited another problem with SMI, namely stock buyback managers are precluded fro trading in the last half hour of the trading day:
Another major change in the markets in recent years is that, more than ever before stock buybacks dominate overall demand for equities. So far this year, they have surged to a record pace. Considering the fact that buybacks are prohibited during the final half hour of trading it could be that the smart money index simply reflects the difference between corporate demand for equities (early in the day) and the natural investor demand for equities (largely reflected at the close).
Ed Yardeni also highlighted stock buybacks as a source of equity demand:
Obviously, buyback activity was boosted by repatriated earnings following the passage of the Tax Cuts and Jobs Act at the end of last year. It lowered the corporate tax rate on such earnings from the 35.0% statutory rate to a one-time mandatory tax of 15.5% for liquid assets and 8.0% for illiquid assets payable over eight years. Odds are that corporations will continue to buy back their shares at a solid pace through the end of this year, though not at the record set during Q1.
Yardeni attributed rising buyback activity a favorable cost of capital comparison of equities to bonds:
[C]orporate finance managers have a big incentive to buy back their companies’ shares when the forward earnings of their corporations exceeds the after-tax cost of borrowing funds in the bond market. Using the pretax corporate bond yield composite overstates the after-tax cost of money borrowed in the bond market. The spread between the forward earnings yield and the pretax cost of funds did widen after 2004 and remained wide well into the next decade. Obviously, it did the same on an after-tax basis. … The bottom line is that as corporate managers have increased their buyback activities, their version of the Fed’s Model has probably had more weight in the valuation of stocks. In theory, this means that valuation should be determined by the corporate version of the model.
BAML projected buyback activity in their latest fund flows report, and it is expected to increase in the next quarter.

At this point, it is tempting to come to a bearish conclusion about how stock buybacks are the only activity holding up the market. However, I would point out that the stock buyback ETF (PKW) has underperformed the market in the last three years. Something else is buoying stock prices, and it’s just buybacks.
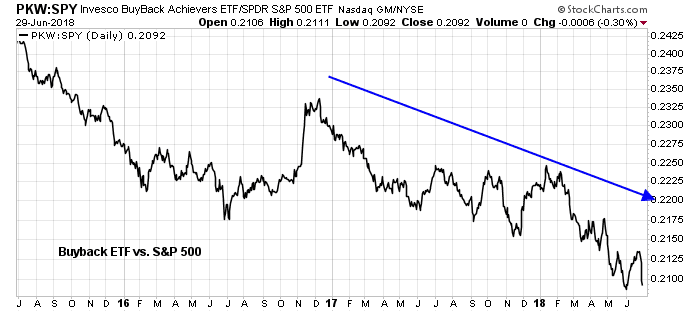
Now let’s overlay the original Fed balance sheet and SMI chart with the the PKW/SPY ratio. It’s not a perfect fit, but do you notice a pattern?
In conclusion, here is what we know about the Smart Money Index and stock buybacks:
- Buyback managers cannot trade in the last half hour of the day, which is a source of distortion of SMI readings.
- Buyback activity have been rising in 2018.
- Buyback stocks have underperformed the market, and therefore not the primary driver of market returns.
- SMI has fallen dramatically, and at the same time, buyback stocks (whose buyback levels are rising) have similarly lagged the market in the same time frame.
With the caveat that correlation isn’t causation, but what conclusion should we draw from this analysis?
Sorry but I’m confused. Would prefer to know what conclusion you draw from this analysis?
It appears that rising buybacks are the main driver of the recent plunge in the Smart Money Index.
I have also demonstrated that buyback stocks underperform the market, and therefore they cannot be the main reason for rising prices.
Conclusion: The recent fall in SMI is noise.
Got it. Thanks!