Mid-week market update: I would first like to convey to all of my American friends my best wishes for a Happy 4th of July. Enjoy you day off, as more fireworks may be on the way.
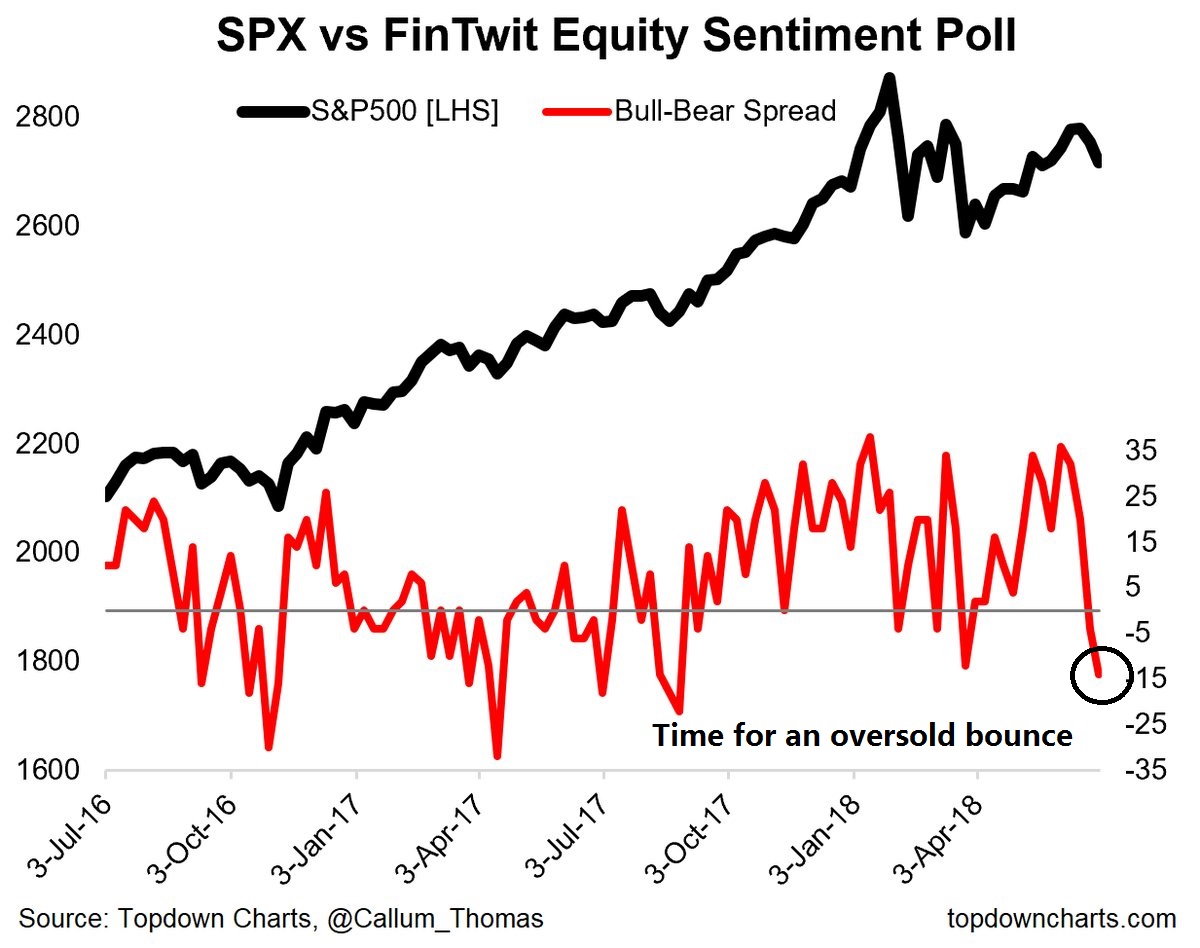
The stock market appears to be starting an oversold bounce. Callum Thomas has been conducting an weekly (unscientific) Twitter poll since July 2016. Sentiment seems to be sufficiently washed out for an oversold rally.
Similarly, breadth readings from Index Indicators also show that the market is ready for a bounce.

The big question is, “How far can stock prices rise?”
A bearish milestone?
The bulls face an intermediate term problem of weakening momentum. Marketwatch highlighted the fact that both the DJIA and SPX are approaching a bearish milestone. As of last Friday, these two stock indices had been in correction territory for 99 days, which is the longest stretch since the GFC.

Ed Clissold of Ned Davis Research also expressed concern about the lack of a breadth thrust:
It’s been 140 days since the $SPX Feb. 8 low, and no breadth thrust. In 10% corrections within bull markets, longest between market low and breadth thrust was 126 days. Means market lows are NOT in place or rally w/no breadth thrust market has made new highs w/o breadth thrusts 50% of the time. BUT, those rallies have been shorter (median 6 mths) and shallower (21%) than w/breadth thrust (22 mths and 56%).
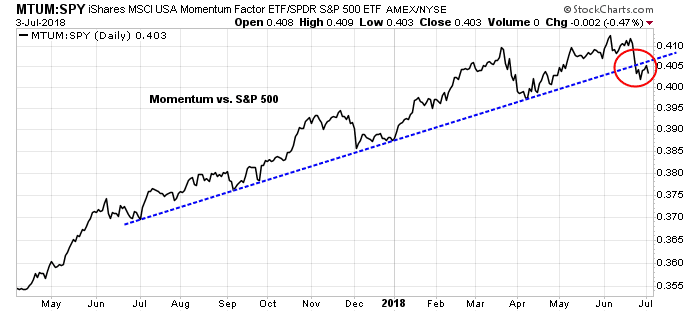
My own observation of price momentum stocks’ inability to hold their relative uptrend is also worrisome.
Is the correction over?
There are two problematical outcomes that Ed Clissold identified. First, the correction may not be over. Even if it were, any recovery is likely to be weak.
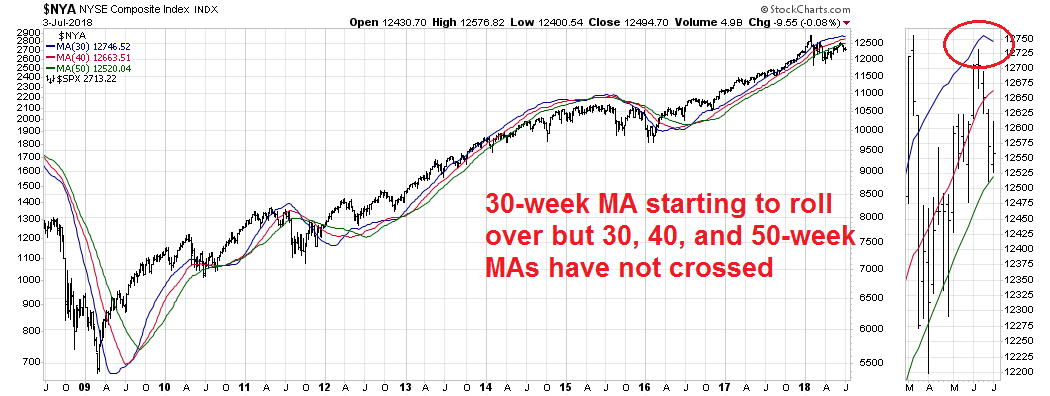
Let’s first address Clissold’s thesis that this correction may not be over. If the market is truly in a corrective phase, then we should see signs of price momentum failure (check), and breaches of uptrends. For the latter, I rely on Chris Ciovacco’s trend following model, where he calculates a 30, 40, and 50 week moving average of the NYSE Composite to determine if the intermediate term trend is flagging. As the chart below shows, there are no indicates of moving average crossovers (yet). Under these conditions, I am inclined to give the bull case the benefit of the doubt. (Note that the SPX is superimposed on the three MAs below and shown for illustrative purposes only).
A weak rebound and sell signal setup?
Ed Clissold also made the point that corrective markets without breadth thrusts have exhibited weak rebounds. This sets up a scenario where the market rallies but either get rejected at resistance, or just make a marginal new high before failing. Should the latter occur, we would see a negative RSI divergence on the monthly chart, which could be a warning of a major market top.

On the other hand, Michael Batnick at The Irrelevant Investor believes that investors shouldn’t be overly worried about the market’s failure to make new highs [emphasis added]:
But in the five plus years since March 2013 the index (TR) has compounded at 13.2% per year. Remember, this is after gaining 26% per year over the previous four years (148% total). So it’s really okay if we go another 100 or 200 or even 300 days without a new high.
Stocks fall into the what have you done for me lately category, but if you define lately as in last few years instead of last few weeks or months, they’ve done plenty.
Bullish and bearish tripwires
My own interpretation is somewhere in between the bulls and bears. On one hand, evidence of flagging momentum and the lack of breadth thrusts is problematical for the bulls. On the other hand, the Ciovacco trend model indicates that the bears have not gained the upper hand on an intermediate term time basis.
Here are my bullish and bearish tripwires. The bears have to either force a prolonged consolidation, followed by price weakness so that trend models roll over.
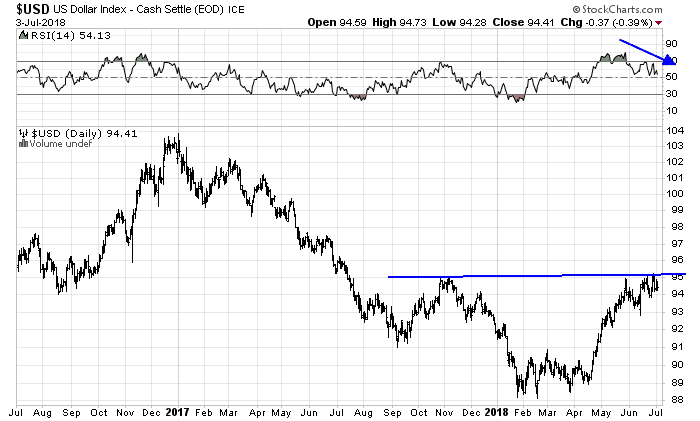
The bulls need to stage a strong upside breakout, preferably aided by evidence of broad global breadth. I demonstrated in a recent post (see A looming global recession, or buying opportunity?) that non-US equity market strength depends on the USD weakness. So far, the market action has been constructive. The USD Index has been rejected at resistance while exhibiting a negative RSI divergence.
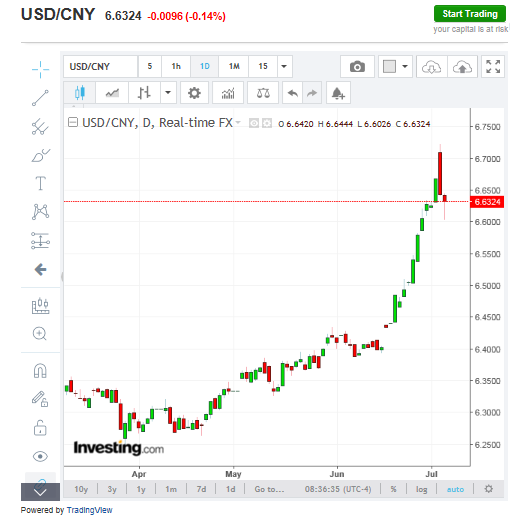
The recovery in the Chinese yuan is equally bullish. The CNYUSD stabilized and rallied this week when the PBOC jawboned the exchange rate upward. As there were market fears that China may weaken its currency and start a currency war in response to Trump’s trade war, the combination of CNY strength and broad USD weakness is a welcome development which will not raise trade tensions. (Note that the chart below shows USDCNY, and a rising rate indicates CNY weakness, not strength).
For now, the SPX is cycling upward on a stochastic buy signal in the context of an uptrend. Initial resistance can be found at about 2740, with secondary resistance at 2800.

My inner investor is giving the bull case the benefit of the doubt. My inner trader is long the market, and he hopes to enjoy the ride.
Disclosure: Long SPXL
Your SPXL is still a small starter position yes?
I added to my positions on Monday when the market weakened.
Can we have a U.S. bull market with the rest of the world wrestling a bear?
The tax cuts are a one time boost in earnings growth. Is that just camouflaging an underlying a serious deterioration of global business conditions?
When I compare the perfect global and U.S. market and economic outlook at the start of the year to the tortured current uncertain ones, I’m amazed the indexes are so near their highs.
When the U.S. is talking seriously about undermining the WTO we’ve reached a new level of uncertainty about globalization.
The recent WTO reports kind of distract from the serious talks that are being held between the EU and the US. A new agreement between those trading partners with less tariffs still seems like the most likely outcome. There is uncertainty right now about which companies might get caught in the crossfires, but there is still a good probability that corporations will be able to adapt to the environment.
What we are seeing is actually long-time coming. It is no more than a breaking down of absolute globalist elite power structure of the last 50 years. The Donald is just a trigger. Adjustment process is always chaotic and it takes time, but the future is probably better than today.
If you think that Trump is an antidote to the “globalists”, think about:
1) How his kids and the Trump Organization does deals all over the world, even today
2) Ivanaka, who just received trademark protection in China, for various lines of goods
3) Jared, the orthodox Jew and real estate developer, trying to re-finance his property with lenders all over the world
4) His cabinet who either came from Wall Street or benefited from Wall Street dealmaking: Mnuchin, Ross, etc.
5) Elain Chao, wife of the senate Majority Leader, and daughter of a Taiwanese shipping magnate
I could go on, but you get the idea. Watch what they do, not just what they say.
IHS Markit says retail sales in Germany are booming and the Eurozone Composite PMI numbers are turning up again. At the same time US manufacturers are seeing a slowdown in export orders. In addition you have an increasing number of reports about US companies being hit by newly introduced tariffs.
Curious why you’ve avoided TNA, as small caps have outperformed the 500 and have a stronger uptrend in place?