Preface: Explaining our market timing models
We maintain several market timing models, each with differing time horizons. The “Ultimate Market Timing Model” is a long-term market timing model based on the research outlined in our post, Building the ultimate market timing model. This model tends to generate only a handful of signals each decade.
The Trend Model is an asset allocation model which applies trend following principles based on the inputs of global stock and commodity price. This model has a shorter time horizon and tends to turn over about 4-6 times a year. In essence, it seeks to answer the question, “Is the trend in the global economy expansion (bullish) or contraction (bearish)?”
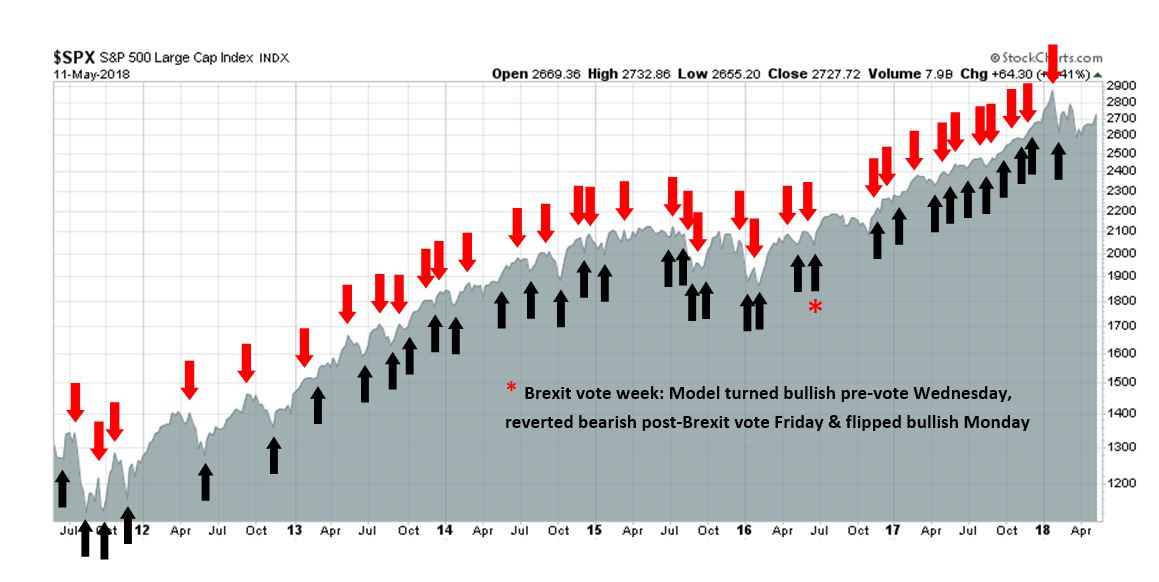
My inner trader uses the trading component of the Trend Model to look for changes in the direction of the main Trend Model signal. A bullish Trend Model signal that gets less bullish is a trading “sell” signal. Conversely, a bearish Trend Model signal that gets less bearish is a trading “buy” signal. The history of actual out-of-sample (not backtested) signals of the trading model are shown by the arrows in the chart below. The turnover rate of the trading model is high, and it has varied between 150% to 200% per month.
Subscribers receive real-time alerts of model changes, and a hypothetical trading record of the those email alerts are updated weekly here.
The latest signals of each model are as follows:
- Ultimate market timing model: Buy equities
- Trend Model signal: Bullish
- Trading model: Bullish
Update schedule: I generally update model readings on my site on weekends and tweet mid-week observations at @humblestudent. Subscribers receive real-time alerts of trading model changes, and a hypothetical trading record of the those email alerts is shown here.
Yellow flags galore, but no red flags
In the wake of last week’s publication (see Why I am not ready to call a market top), I had a number of discussions with investors that amounted to, “What about _________ (insert the worry of the day)”.
The main themes discussed, in no particular order, were:
- Rising rates and the flattening yield curve;
- Trade war;
- Oil price spike; and
- Fed policy error as they tighten into a decelerating economy.
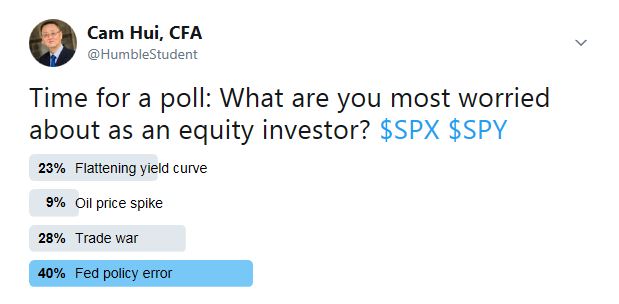
I conducted an (unscientific) Twitter poll, and respondents were mostly concerned about a Fed policy error, while the oil price spike was the least of their worries.
While I believe that all of these risks are legitimate, they can be characterized as yellow flags, but there are no red flags that signal an imminent recession or equity bear market.
Fed policy error risk
Let’s consider each of these risks, one at a time. The greatest fear cited by investors is a Fed policy error, where the Fed tightens monetary policy into a weakening economy and pushes it into a bull market killing recession. I have expressed concerns in the past about such a scenario, and there are signs that monetary policy is starting to bite.
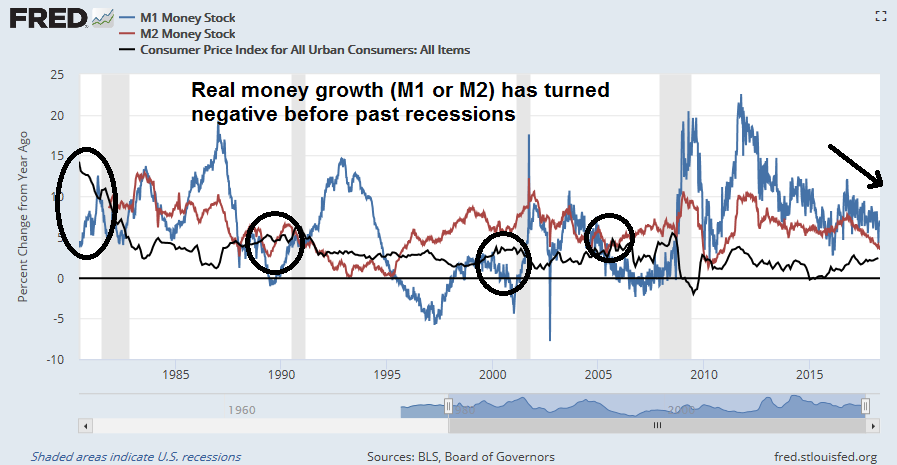
The effects of monetary policy normalization can be seen in money supply aggregates. In the past, either negative real M1 or M2 growth has been recession warnings. The latest readings show that real M2 growth is steadily decelerating and below 1%, and it is on pace to turn negative later this year. Call it another yellow flag, but no recessionary red flag warning.
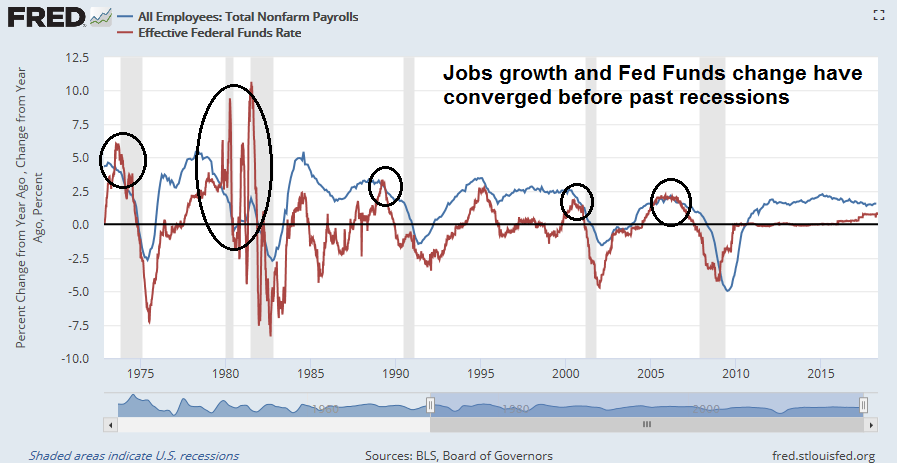
In addition, New Deal democrat constructed a simple recession forecasting model based on Non-Farm Payroll and the Fed Funds rate:
1. a YoY increase in the Fed funds rate equal to the YoY% change in job growth has in the past almost infallibly been correlated with a recession within roughly 12 months.
2. the YoY change in the Fed funds rate also does a very good job forecasting the *rate* of YoY change in payrolls 12 to 24 months out.
As the chart below shows, YoY jobs growth (blue line) is converging with YoY Fed Funds rate changes (red line). While the two lines are close, they have not crossed yet.
New Deal democrat went on to interpret the data in a cautionary, but benign fashion:
Because the Fed funds rate has been hiked by 0.75% in the last year, that suggests that a further YoY% decline in payrolls growth is already “baked in the cake” over the next 12-24 months, to a level of roughly +0.8% YoY.
That suggests that if the Fed makes 3 more 0.25% interest rate hikes in the next year, the “red flag” will be triggered at some point in that 12-24 month window.
In other words, the risk of a Fed policy error is a yellow flag, not a red flag.
Rising rate risk
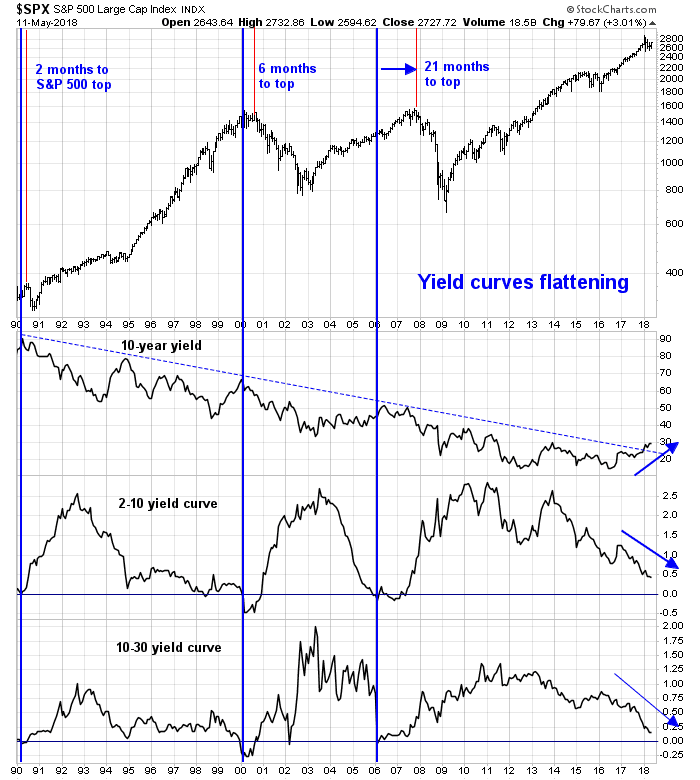
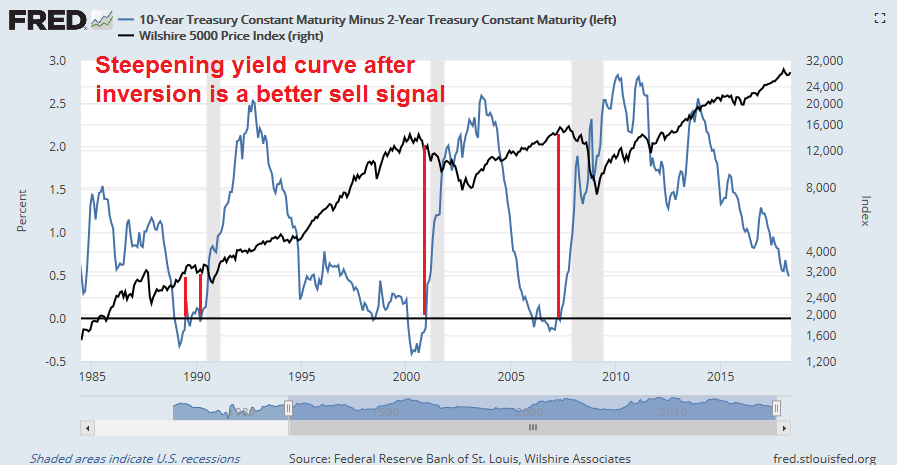
One of the most often cited worry is the combination of rising rates and a flattening yield curve. Indeed, 10-year Treasury yields have been rising, and they have breached a multi-decade downtrend. Moreover, both the 2-10 and the 10-30 yield curves are flattening to 43bp and 13bp respectively. Past instances of yield curve inversions have been sure fire recession signal.
There are two issues here. Let us first consider the problem of rising yields, which I addressed in a past post (see How much does 3% matter to stocks?). I had pointed out that the historical data from JPM Asset Management showed that rising yields have not been a problem for equity prices until yields reached 5%.
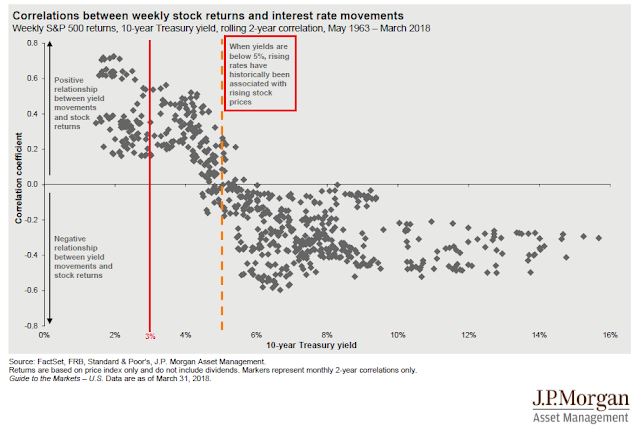
The key to the relationship between yield and stock prices is a tradeoff between rising growth expectations, which is bullish, and rising rates, which is bearish. Early in the Fed’s tightening cycle, the market tends to focus more on growth expectations. At some point, psychology switches to the bearish effects of rising rates. The simple question is, “Is good (economic) news good (equity) news, or bad news?”
So far, good news is still good news. Call rising rates a yellow flag, but the red flag of “good news is bad news” has not appeared yet.
Too early to worry about a flattening yield curve
Once investors recognize the evolution of market psychology of the Fed’s tightening cycle, it should naturally follow that they should not worry about a flattening yield curve. True the yield curve tends to flatten as the Fed’s begins its tightening cycle. But flattening yield curves are not danger signals for equity prices – yet.
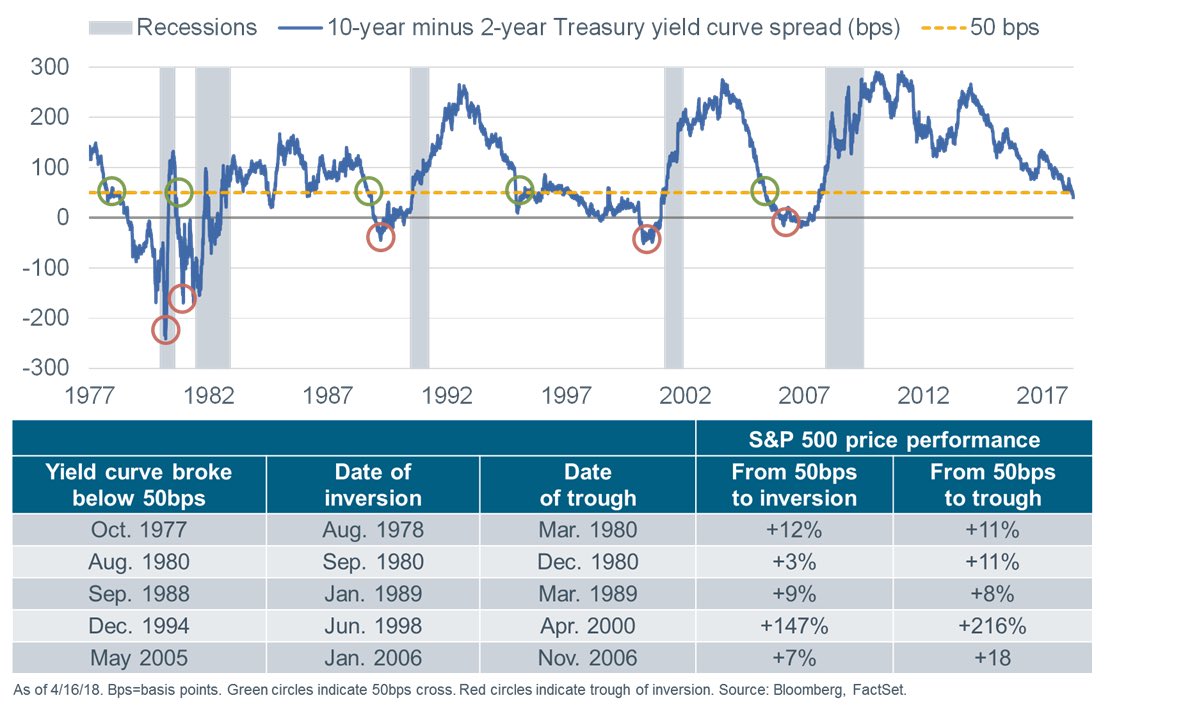
Liz Ann Sonders at Charles Schwab found that stock prices tended to risen as the 2-10 yield curve flattened below 50bp. The 2-10 curve currently stands at 43bp, and if history is any guide, there is still upside in stock prices.
Kent Petersen at Insights From A Quant also studied the past history of yield curve inversions, as measured by the spread between the 2-year and 3-month Treasury Bill for the period starting from 1960. He found that US stock prices were flat to up 3-4 months after an inversion before falling. The current spread is a positive 63bp, which is a far way from an inverted condition.
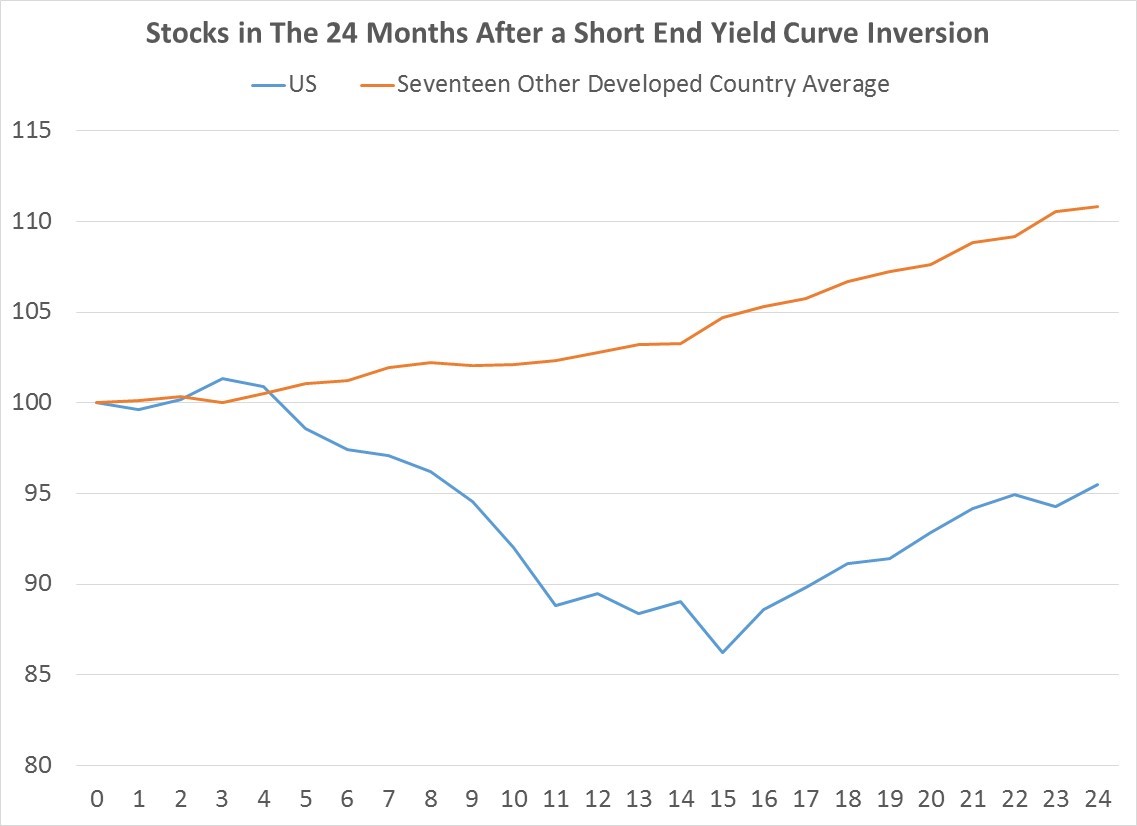
Even an inverted yield curve may not be a bear market signal. Even though the sample size is small (N=3), the historical evidence suggests that investors may be better served by holding stocks until after the 2-10 yield curve inverts, and then selling when it steepens back above positive.
In effect, a flattening yield curve can only be characterized as a yellow flag, not a red flag for equity prices.
Can a trade war sink the economy?
Before the election of 2016, when the prevailing consensus called for a Clinton presidential, my scenario for the next bear market was based on a Fed induced recession. The emergence of Trump’s America First policy raises the risk of a trade war that tilts the global economy into a synchronized slowdown.
A recent CNBC report highlighted the risks of how a trade war could tip China into a hard landing.
- Nearly 20 percent of China’s exports go to the U.S.
- If a trade war ensues with the U.S., China’s GDP growth would drop 0.5 percent and could continue to fall as things heat up, the IMF warns.
- China’s debt-to-GDP has ballooned to more than 300 percent from 160 percent a decade ago.
- Chinese officials now warn of a financial-sector debt bubble that’s waiting to burst.
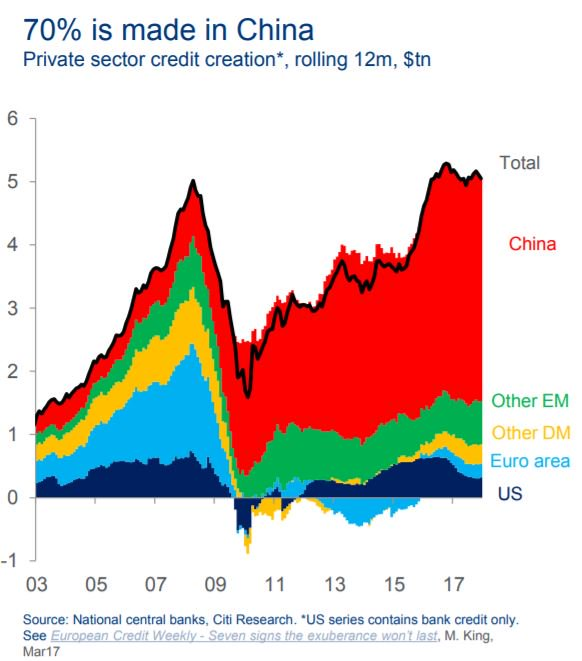
The risks are high. China has accounted for most of the global credit growth since the Great Financial Crisis. A trade induced slowdown has the potential to tip the Chinese economy into a hard landing, and drag down the economies of its trading partners.
The American economy is not immune to a slowdown in China. As an example, Ford’s recent temporary decision to suspend production of their most top producing F-150 light truck because of a fire at a supplier plant in Michigan is an eerie reminder of the catastrophic consequences of even small disruptions in the supply chain. Multiply those results by a hundred or thousand-fold in the event of a full trade war, and we can see the resulting production havoc from the current era of global supply chains. If Trump wants the trade deficit to fall, he can achieve those results with a trade war induced recession.
Geoffrey Gertz at Brookings characterized Trump’s adventures into the arena of trade and foreign policy as more bark than bite:
There is one fundamental rule for making sense of trade policy over Trump’s first 16 months in office: Do not overreact to new announcements. Indeed, with the benefit of hindsight, we can observe a growing list of at-the-time seemingly newsworthy policy announcements that ultimately went nowhere. For instance, back in January 2017, Trump suggested that he would pay for a border wall by imposing tariffs on Mexico. That never happened. In an April 2017 interview, Trump suggested he was interested in a “reciprocal tax” on imports, meaning the U.S. should tax imports from other countries at the same rates as those applied to American exports. In February of this year, he resurrected the same idea, declaring that the United States would “soon” announce a reciprocal tax, with more information forthcoming “as soon as this week.” Meanwhile, we’re still waiting. In late January, U.S. Trade Representative Robert Lighthizer suggested that “before very long” the administration would select an African country to begin new free trade agreement talks. The pro-trade U.S. Chamber of Commerce enthusiastically nodded its head. So far nothing seems to have happened.
Former Korea CIA analyst Sue Mi Terry characterized Trump’s negotiating style as transparent. While her remarks were in the context of American negotiations with North Korea, her comments are applicable to trade policy as well. She characterized Trump as someone who is looking for the affirmation of “a win”, regardless of whether the deal is substantive. Foreign leaders have figured out to flatter and praise him, while offering only token concessions but give the impression of “a win” (use this link if video is not visible).
We saw this pattern in the KORUS negotiation. The revised agreement was hailed as a great victory by the Trump administration, but the tweaks were only cosmetic in nature. The South Koreans agreed to two concessions. In return for an indefinite exemption from the steel and aluminum tariffs, Seoul agreed to a steel export quota to the US, but the quotas are toothless because they are contrary to WTO rules and could be challenged at anytime. In addition, South Korea doubled the ceiling on American cars which could imported into that country. The ceiling increase was meaningless because American automakers were not selling enough cars under the old ceiling. In other words, the KORUS free trade deal was a smoke and mirrors exercise and a face saving out of a potential trade war.
The trade negotiations with China appear to conform to a similar template, according to this CNBC report:
- Commerce Secretary Wilbur Ross said China appears open to some of the White House’s requests.
- “I think they agreed to the concept of a trade deficit reduction,” Ross said.
- The U.S. requested the majority of China’s deficit reduction come from purchases of U.S. goods — an idea Ross reiterated Thursday.
In short, the risk of a trade war induced recession is a yellow flag. Until a trade war actually erupts, it cannot be regarded as a red flag for the stock market.
Oil spike risk
Now that oil prices have spiked, concerns are appearing that rising oil prices could derail the economy. James Hamilton has been a pioneer in researching the link between oil shocks and recessions, and he found that 10 out of the 11 last US recessions were associated with oil price spikes. For more details, see his testimony before the Joint Economic Committee of Congress on May 20, 2009, and his study of historical oil shocks.
A 2014 Federal Reserve study agrees with Hamilton`s conclusion:
Although oil price shocks have long been viewed as one of the leading candidates for explaining U.S. recessions, surprisingly little is known about the extent to which oil price shocks explain recessions. We provide a formal analysis of this question with special attention to the possible role of net oil price increases in amplifying the transmission of oil price shocks. We quantify the conditional recessionary effect of oil price shocks in the net oil price increase model for all episodes of net oil price increases since the mid-1970s. Compared to the linear model, the cumulative effect of oil price shocks over the course of the next two years is much larger in the net oil price increase model. For example, oil price shocks explain a 3 percent cumulative reduction in U.S. real GDP in the late 1970s and early 1980s and a 5 percent cumulative reduction during the financial crisis. An obvious concern is that some of these estimates are an artifact of net oil price increases being correlated with other variables that explain recessions. We show that the explanatory power of oil price shocks largely persists even after augmenting the nonlinear model with a measure of credit supply conditions, of the monetary policy stance and of consumer confidence. There is evidence, however, that the conditional fit of the net oil price increase model is worse on average than the fit of the corresponding linear model, suggesting much smaller cumulative effects of oil price shocks for these episodes of at most 1 percent.
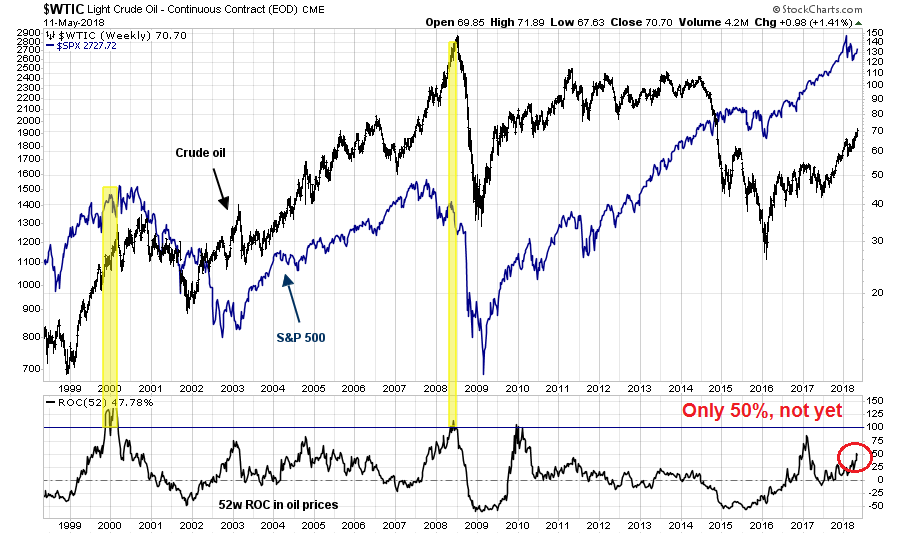
Should investors be concerned about rising oil prices tanking the economy and the stock market? Not yet. As the chart below shows, the historical evidence suggests that stock prices do not top out until the 12-month rate of change in oil prices reach 100%. They are only at about 50% right now.
This does not mean, however, that the market is out of the woods. WTI oil bottomed out last June in the low 40s. The combination of base effects, tight supply from collapsing Venezuelan production, and a looming Iranian oil embargo could produce an oil price spike. If prices rise to the $85-90 level this summer, then the 100% rate of change rule will be triggered. Such a level for oil prices is well within the realm of possibility. Bloomberg reported that BAML is forecasting that oil could hit as much as $100 next year.
For now, rising oil prices represent a yellow flag that needs to be monitored, and it is not a red flag sell signal.
Risks are rising, but too early to get overly bearish
In conclusions, warning signs are appearing for the stock market but there are no sell signals. The equity bull that began in 2009 is mature, but it is still alive and snorting.
Accounts with long term horizons could respond to these conditions with a neutral stance by re-balancing their portfolios back to their target asset mix. Investors with greater tactical orientation should remain bullish, as the final price top is likely still ahead.
The stock market will get bumpy, but the outlook is still bullish.
The weeks ahead
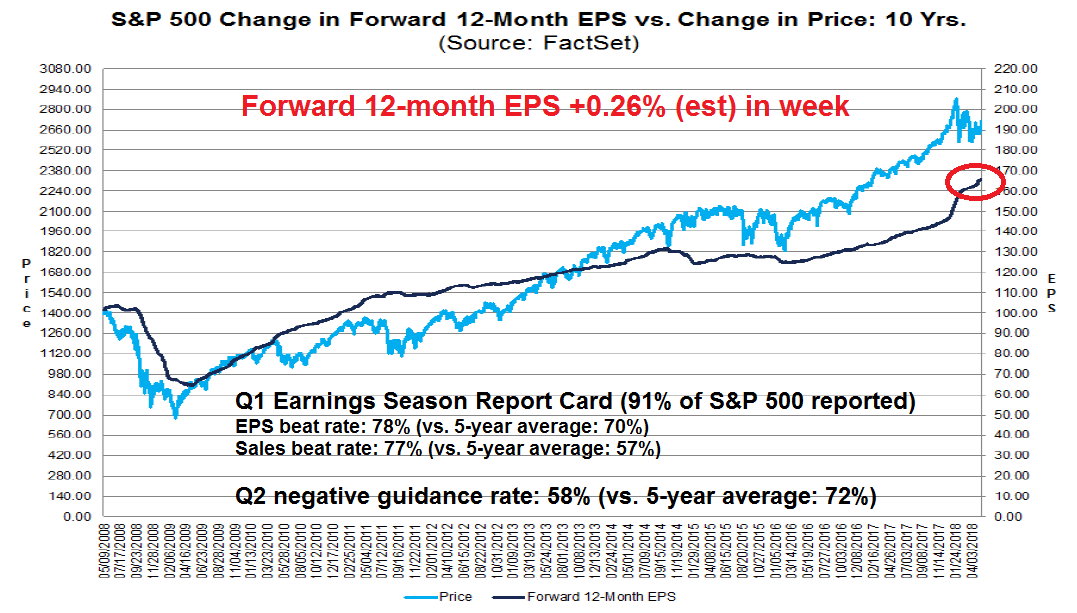
Looking to the weeks ahead, the intermediate term equity outlook looks encouraging. The latest update from FactSet shows that Q1 earnings season is mostly over and results have been solid. Both the sales and EPS beat rates are well above historical averages, and Street estimates continue to rise. Moreover, the negative guidance rate for Q2 is better than average, indicating further near-term fundamental upside.
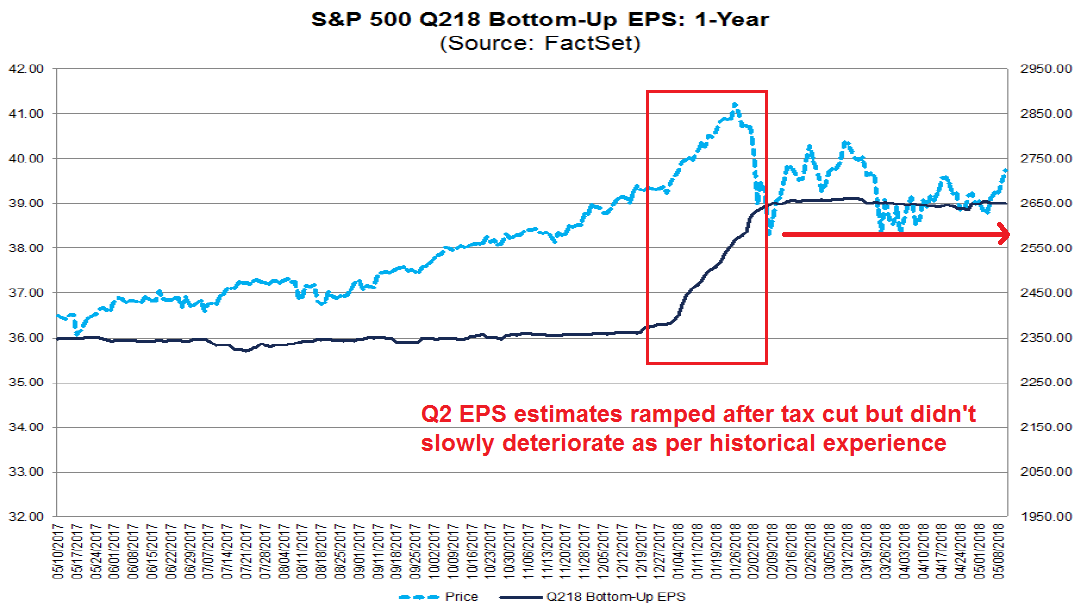
Another way of thinking about the earnings outlook is to monitor the evolution of quarterly earnings estimates. Historically, Street analysts have tended to be overly optimistic in their EPS estimates, and estimates tend to degrade slowly over time. In this instance, Q2 estimate rose sharply due to the effects of the corporate tax cuts, and they stayed flat instead of falling slowly. I interpret this lack of EPS deterioration as equity bullish.
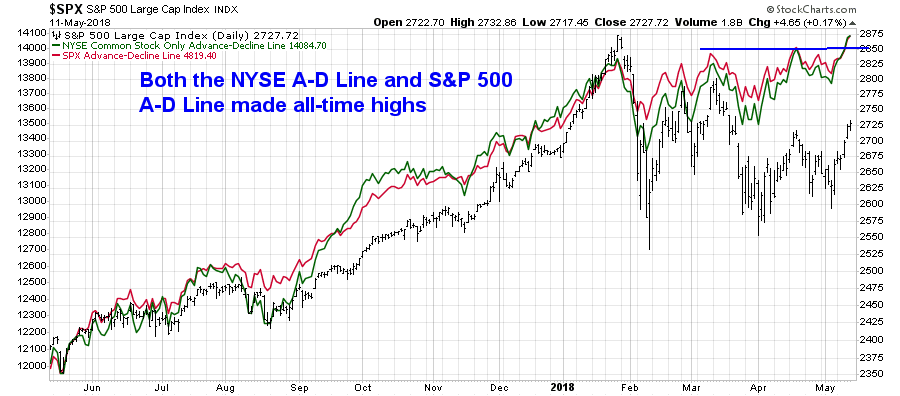
From a technical perspective, breadth indicators are flashing bullish signals. Even though the S&P 500 is below its highs, both the NYSE Advance-Decline Line and S&P 500 Advance-Decline Line, which is an apples-to-apples breadth indicator, have achieved all-time highs.
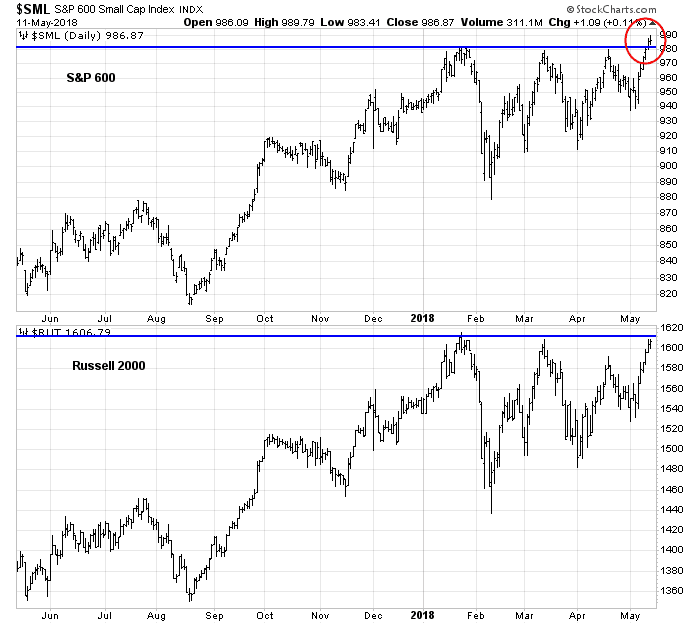
The S&P 600 Small Cap Index also reached an all-time high last week, though the Russell 2000 is just a hair below fresh highs. The troops are leading the charge, the generals (major large cap indices) are likely to follow soon.
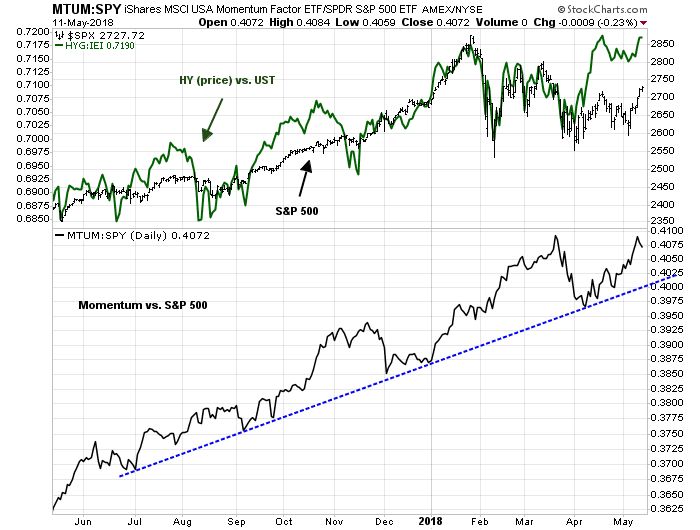
Risk appetite indicators from both the credit and equity markets appear to be healthy, which is bullish.
To be sure, short-term breadth (1-2 day) indicators from Index Indicators shows that the market is overbought, and some minor pullback or consolidation is to be expected.

The market has broken a downtrend that began from the January highs, though it remains range-bound between 2560 and 2800. RSI(5) is overbought, and initial support on a pullback can be found at trend line and gap at about 2700. If stock prices were to begin grinding up from these levels, the challenge for the bulls will be to sustain a series of “good”overbought readings as prices rise. I had also previously highlighted a condition where the VIX falling below its lower Bollinger Band (BB) indicating a short-term overbought reading for the market (see The bulls are back in town).
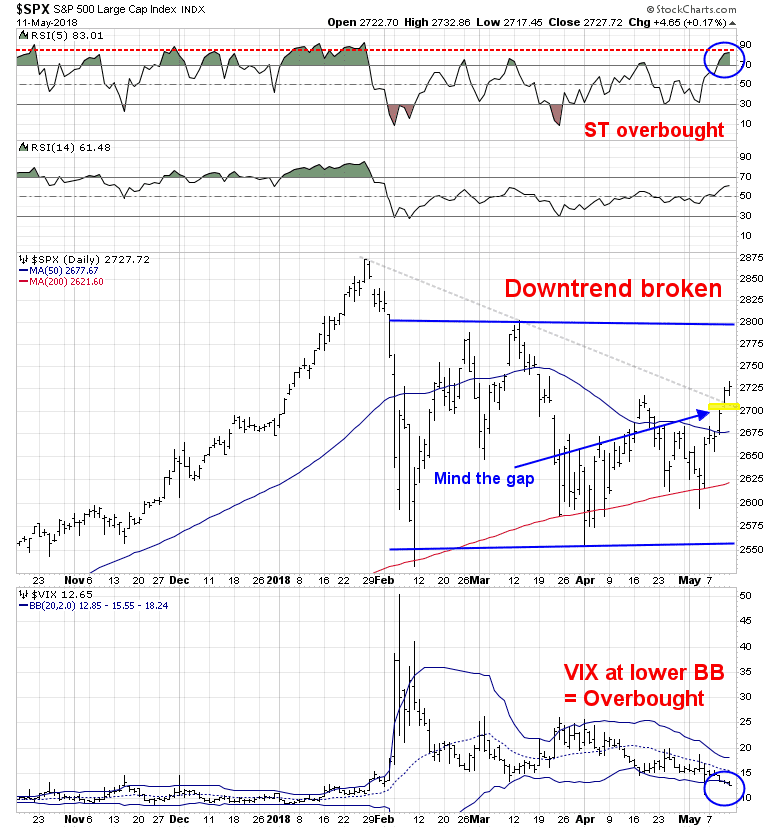
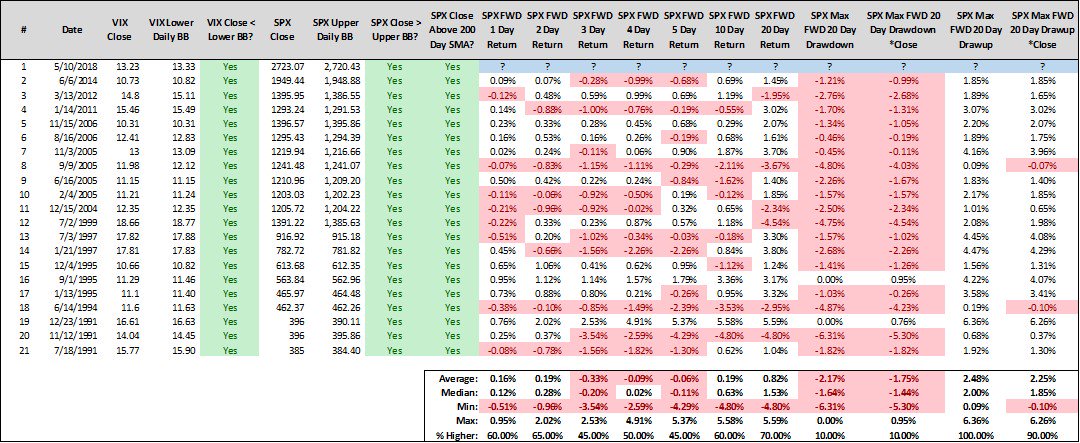
Steve Deppe conducted a study where the S&P 500 closes above its daily BB, and above its 200 dma, combined with the VIX below its BB. Returns are flat to slightly negative near term, but going out 10-20 days.
My base case scenario calls for some minor weakness or consolidation into mid-week, with a likely pullback to the 2700 area, followed by further strength for the remainder of May. My inner investor remains constructive on stocks. My inner trader lightened up his long positions late last week, and he is waiting for either the pullback or a breakout to buy more.
Disclosure: Long SPXL
THAT was a CIA analyst ?
Now, that explains a lot . . .
The CIA has two directorates. One is analysis and the other is operations. The analysis directorate publishes open source assessments like the CIA annual handbook with a brief outline of each country around the world: https://www.cia.gov/library/publications/the-world-factbook/
This woman was obviously in the analysis group. People in that group tend to be political science types.