Preface: Explaining our market timing models
We maintain several market timing models, each with differing time horizons. The “Ultimate Market Timing Model” is a long-term market timing model based on the research outlined in our post, Building the ultimate market timing model. This model tends to generate only a handful of signals each decade.
The Trend Model is an asset allocation model which applies trend following principles based on the inputs of global stock and commodity price. This model has a shorter time horizon and tends to turn over about 4-6 times a year. In essence, it seeks to answer the question, “Is the trend in the global economy expansion (bullish) or contraction (bearish)?”
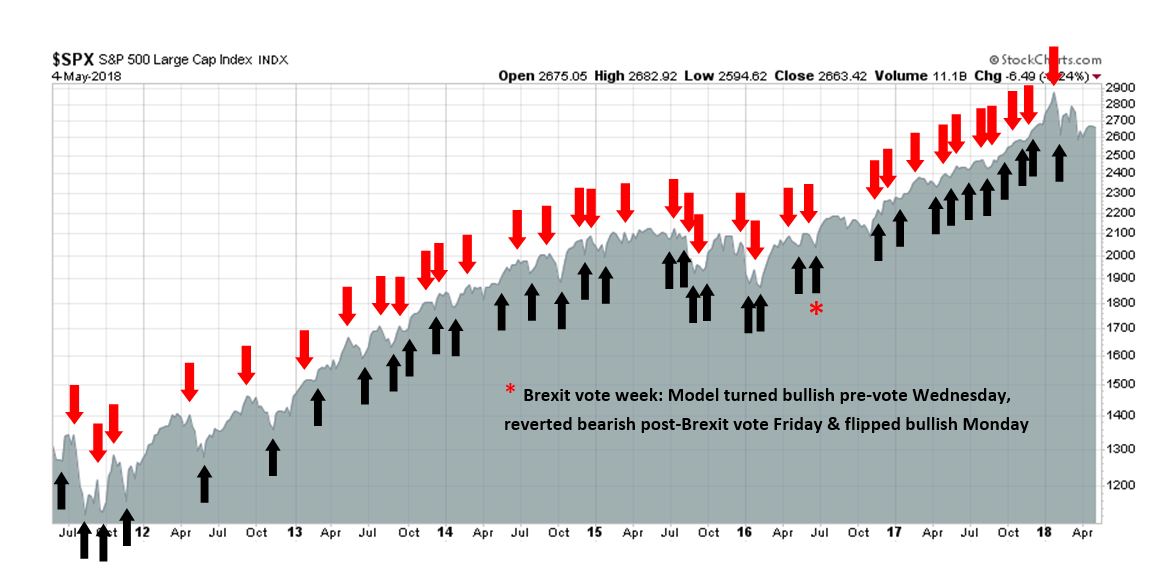
My inner trader uses the trading component of the Trend Model to look for changes in the direction of the main Trend Model signal. A bullish Trend Model signal that gets less bullish is a trading “sell” signal. Conversely, a bearish Trend Model signal that gets less bearish is a trading “buy” signal. The history of actual out-of-sample (not backtested) signals of the trading model are shown by the arrows in the chart below. The turnover rate of the trading model is high, and it has varied between 150% to 200% per month.
Subscribers receive real-time alerts of model changes, and a hypothetical trading record of the those email alerts are updated weekly here.
The latest signals of each model are as follows:
- Ultimate market timing model: Buy equities
- Trend Model signal: Bullish
- Trading model: Bullish
Update schedule: I generally update model readings on my site on weekends and tweet mid-week observations at @humblestudent. Subscribers receive real-time alerts of trading model changes, and a hypothetical trading record of the those email alerts is shown here.
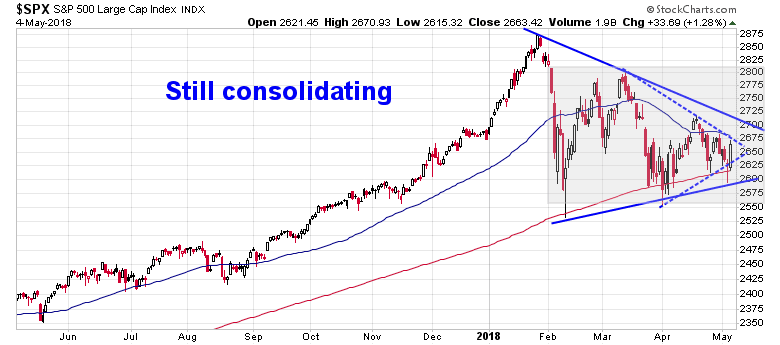
Market top is still ahead
As stock prices chopped around in an indecisive fashion in past few weeks, the traders in my social media feed have become increasingly nervous and bearish. The bull can point to the SPX repeatedly testing its 200 day moving average (dma), which has held as technical support. However, the market’s inability to rally despite what has been good earnings news during a Q1 earnings season with solid results is worrisome.
My review of intermediate and long-term technical market conditions, as well as the macro backdrop reveals that no pre-conditions of a bear market are in sight. While there are concerns that the American economy is undergoing the late cycle phase of an expansion, which is typically followed by a bear phase. I am not ready to make the investment call that stock prices have topped out just yet.
Consider, as an example, the Relative Rotation Graph (RRG) as a way of analyzing changes in sector leadership. RRG charts are a way of depicting the changes in leadership in different groups, such as sectors, countries and regions, and market factors. The charts are organized into four quadrants. An idealized group rotation pattern occurs in a clockwise fashion. Leading groups (top right) deteriorate to weakening groups (bottom right), which then rotates to lagging groups (bottom left), which changes to improving groups (top left), and finally completes the cycle by improving to leading groups (top right) again.
The latest RRG chart depicts a stock market with the emerging leadership of late cycle inflation sectors (gold and oil), which is the result of late cycle inflationary pressures, along with interest sensitive sectors (REITs and utilities) as the result of a dovish Fed.

This combination suggests that the market is setting up for one last inflationary blow-off before the Fed steps on the monetary breaks to cool the economy into a bull market killing recession.
Listen to the market
When I listen to the message from market leadership, inflation hedge sectors appear poised to assume the mantle of new market leadership, which is an indication that the economy is in the late cycle phase of an expansion.
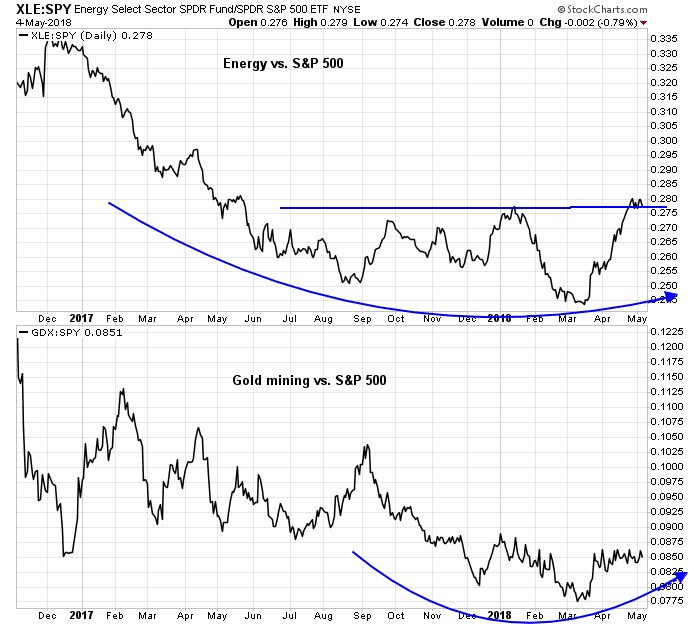
Three weeks ago, I rhetorically asked if it was time to buy gold for the late cycle inflation surge. Even as I acknowledged that the bull case for gold was easy to make, a rising US Dollar or tight Fed policy could derail any surge in gold prices.
From a technical perspective, the gold was making a multi-year rounded saucer bottom. The silver/gold ratio, which is a measure of precious metal risk appetite, was at historically washed out levels. However, the USD Index, which is inversely correlated to gold, was rallying and creating a headwind for gold prices.

Here is a shorter term version of the chart. Gold has been range bound and technical support is holding. The silver/gold ratio is bottoming, indicating rising risk appetite, but the USD broke out of a short-term range. The combination of emerging equity group leadership, rising risk appetite, and ability to hold support in the face of a rising USD is constructive for gold prices going forward.

In conjunction with nascent leadership from gold, crude oil, which is another inflation hedge, may be poised to rise in the near future. The chart below depicts the price of oil (top panel), and the difference between the December 2018 futures price and the June 2018 futures prices. Under “normal” conditions, the long-dated contract (December) trades at a higher price than the short-dated contract (June) and the difference reflects the cost of storage and carrying costs. When the short-dated contract trades above the long-dated contract, the commodity is said to be in “backwardation” and such conditions usually reflect tight supply conditions. Current conditions show that oil prices have staged an upside breakout to new highs, and the futures contract is in backwardation, indicating a supply shortage.

The supply shortage can be attributable to two factors. First, American fracker production is discouraging conventional oil producers from investing in new production. But the frackers are already producing at their production limits, and the combination of better global growth and restricted conventional production are bullish tailwinds for oil prices. As the chart below shows, the price spread between Midland (Permian) oil and Brent is now plunging because pipeline capacity is full and there is an abundance of Permian oil with nowhere to go.

As well, Reuters reported that Trump has all but decided to repudiate the nuclear agreement with Iran, and the Guardian reported that the Trump WH may have hired Israeli private investigators to dig up dirt on the former Obama Administration officials who negotiated the deal. The Trump White House is scheduled to announce its Iranian decision on May 12. The re-imposition of sanctions on Iran has the potential to spike oil prices, either ahead of the announcement, or on the announcement date.
In addition, a slightly more dovish Fed is providing a tailwind for inflation hedge vehicles. Last week’s FOMC announcement of a symmetric inflation target was a signal of a slight dovish tilt to monetary policy. The Powell Fed is ready for the economy to run a little “hot” and tolerate a little more inflation before reacting with an aggressive rate hike policy.
Bond yields retreated in response to the dovish message, but interest sensitive sectors such as REITs and utilities had already reacted in anticipation. The accompanying chart shows the relative market returns of REITs overlaid on top of 7-10 year Treasury returns. While the two had tracked each other closely, the divergence in the last couple of weeks may be attributable to a market reaction to excess supply from Treasury auctions.
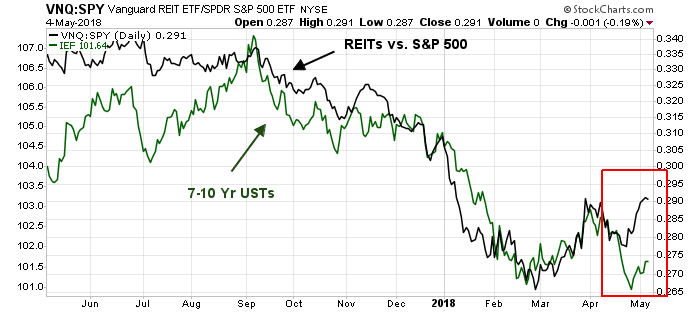
The relative returns of utilities are also showing a similar pattern of a relative bottom, and close correlation with Treasury prices.

In short, the combination of rising inflation and a slightly more dovish Fed are recipes for a last hurrah melt-up in asset prices. Gavyn Davies‘ assessment of the interaction between rising oil prices and bond yields is probably the correct one:
It may be driven mainly by the perception of a demand shock in the US economy, stemming from the fiscal easing and confirmed by robust activity data in latest nowcasts for the economy. This is leading to an acceleration in expected Fed tightening, but not to any change in long-run inflation expectations or in terminal interest rates at the end of the cycle.
Although this shift in expected monetary tightening is not exactly good for risk assets, it might not be fatal either.
Fundamental conditions are still strong
From a macro and fundamental perspective, conditions are strong. The latest April Jobs Report showed that both the headline and U6 unemployment rates below the lows set in the last expansion. There are no signs of economic weakness here.

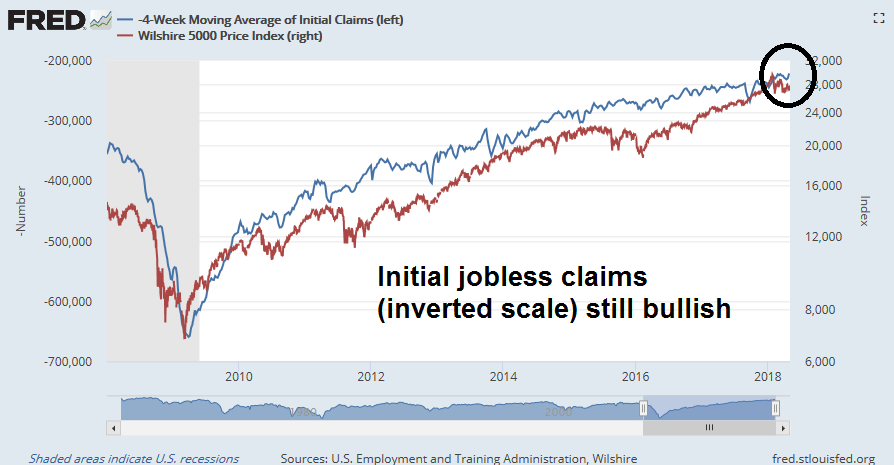
As well, initial jobless claims have been shown a close inverse correlation to stock prices. Initial claims are making 40+ year lows. These lows are setting up a bullish divergence with stock prices.
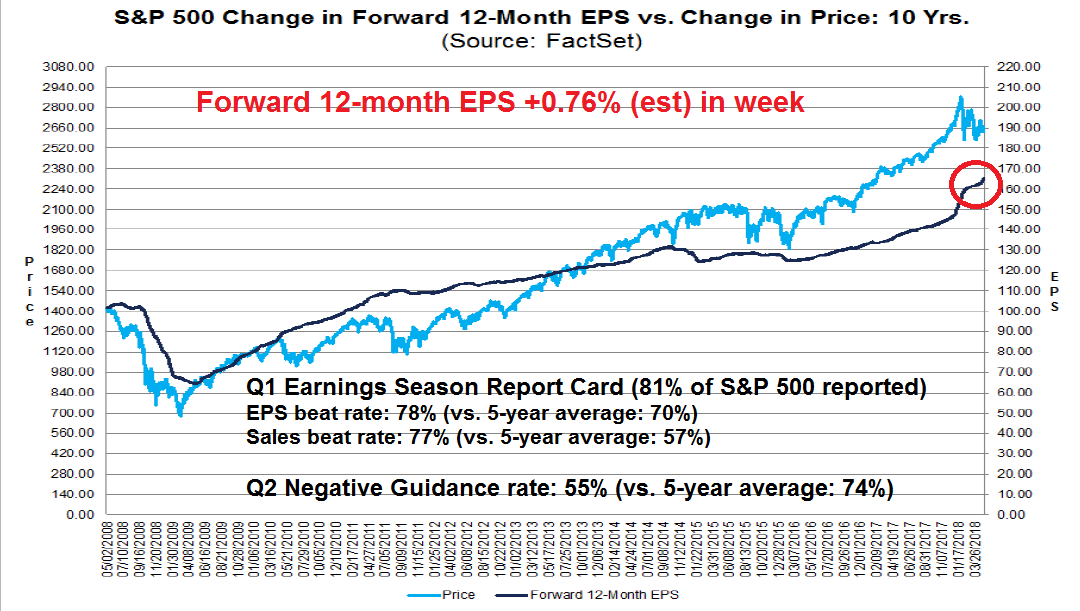
Q1 earnings season is mostly complete. Both the sales and EPS beat rates have been solid, and forward guidance is better than average. The Street has responded with upward estimate revisions, indicating positive fundamental momentum.
Long-term technical trends are bullish
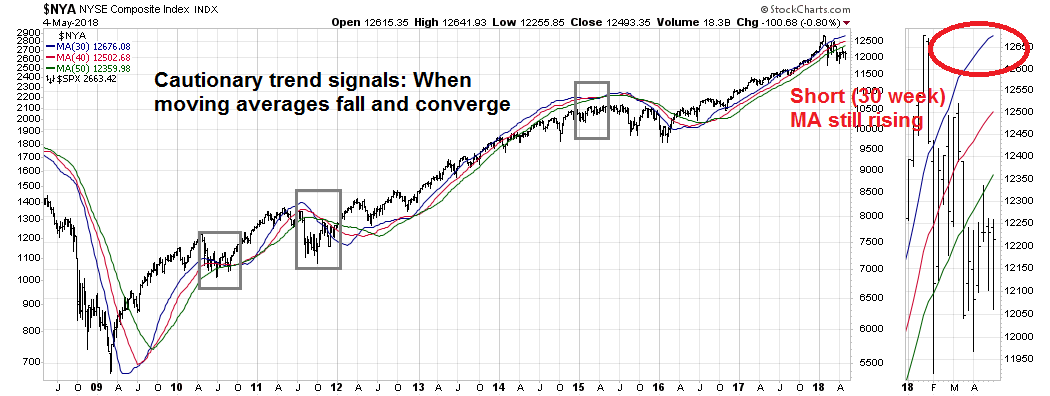
For a longer term technical perspective, I present a number of 20 year charts from around the world. Starting in the US, Chris Ciovacco uses a series of moving averages to spot changes in price trends. The trend following system flashes warnings (shown in boxes) when the moving averages turn down and converge. The latest readings indicate that the shortest moving average is still rising and hasn’t even begun to decline. Does this look like a bear coming out of hibernation?
Across the Atlantic, the STOXX 600 remains in a solid uptrend. While the index may pause as it tests overhead resistance, this pattern does not appear bearish.

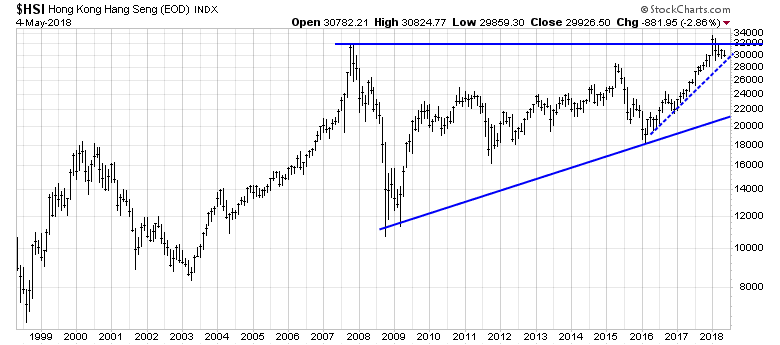
Regular readers know that my analytical framework calls for dividing the world into three trade blocs composed of North America, Europe, and China/Asia. The Chinese stock market remains a casino and its price signals are not always reflective free market forces. However, we can get some clues from the stock indices of China’s Asian trading partners. Here is the Hong Kong market, which recently staged an upside breakout to new highs and pulled back. The index remains in minor (dotted line) and major (solid line) uptrends. Does this look bearish to you?
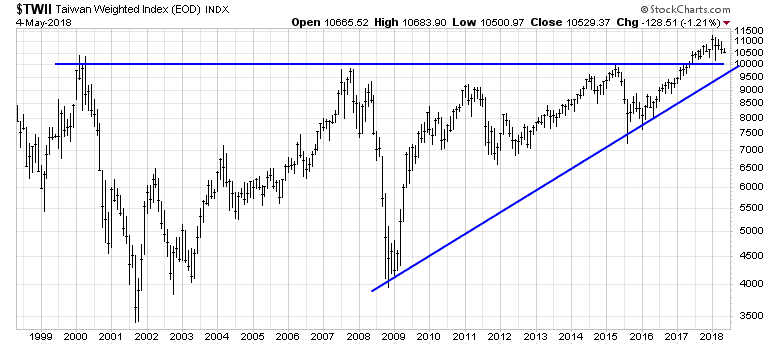
Here is the Taiwan market, which broke out to new highs.
The South Korean market, which is regarded by many investors as a global cyclical barometer, also staged an upside breakout and held its highs.

Do the technical patterns in any of these global market indices look bearish to you? I didn’t think so. So why get so worried?
In short, there are no signs that a bear market has begun in any major equity markets around the world. Moreover, an analysis of sector leadership points to a classic late cycle inflationary blow-off. Fundamentals are also positive and supportive of stock prices.
Unless we see signs of fundamental weakness or long-term technical deterioration, I can only conclude that equity markets are undergoing a short-term correction. Weakness should therefore be viewed as a buying opportunity.
The week ahead
Looking to the week ahead, the stock market remains in a choppy consolidation phase. The ability of the market to hold at its 200 dma is constructive, but my inner trader is not ready to get all-in bullish just yet.
Short-term (1-2 day) breadth indicators have moved from a mildly oversold to a mildly overbought condition. The bulls need to follow through in the days ahead with further strength before this consolidation period can be declared over.
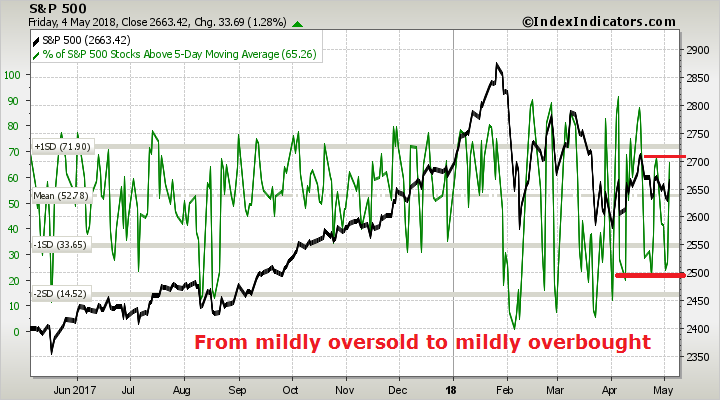
Medium term (3-7 day) breadth indicators are in neutral. If the bulls are truly in control of the tape, then the market needs to move this indicator into the target overbought zone.

Until we see either some sustained upside momentum or a downside support break, my inner trader’s base case scenario is a continuation of the choppy consolidation where he buys the dips, and sells the rips. My inner investor remains bullish on equities.
Disclosure: Long SPXL
There is something wrong with the Ciovacco chart. See box at 2015: moving averages cannot be above a long- rising signal. In fact, the 50 dma is falling – see $SPX chart further down.
Ciovacco proposed using MAs of the NYSE Composite for his signals, which is what I did. I further superimposed the S&P 500 on top of the MAs for information purposes. That’s why that chart may look confusing. Sorry I didn’t make that clear.
I think that Trump will not exit the Iran deal & everyone is piled into a long oil trade…thus I would short oil here.
I hate to be negative person here but Cam is one of those uniquely true academics that likes to hear opposing viewpoints. Hopefully others on the blog do also.
When I look at the Rotation Graph I see something very different. I see utilities, REITs, Healthcare and Gold surging up which is a bear market confirmation. Energy is the outlier and its strength could be due to the Iran treaty being revoked causing mayhem in the Middle East. If energy was not surging, one would look at the Rotation Graph and conclude it is a perfect bear market scenario with Financials, tech, industrials, consumer etc weakening.
Therefore to me the Rotation Graph confirms a bull market peak on January 26 when investor sentiment hit a bubble peak.
When I look at the charts comparing Utilities and REITs to bonds, I see institutional investors shifting portfolios to defensive sectors. My guess is they are also reducing their equity exposure by selling into this final surge of retail investor demand.
Note recently there has been a sudden shift to emerging markets underperforming. This has preceded bear markets in the past. This could be due to the coming Trade War. This week the Trump team is in China and their list of firm demands is so impossible long and revolutionary that we can assume the Chinese will agree to little or none of it. A business-damaging Trade War is about to start.
On the political front, Trump is shifting his focus to international from the stormy domestic area (pun intended). That is success with North Korea and now confronting Iran and battling for trade concessions in NAFTA and China. He wants to be America’s Champion in the world arena going into the mid-terms. That is dangerous for the business world. Think disruptions of supply lines and massive inflation from tariffs and higher oil prices followed by the Fed raising interest rates. A proper shit show.
Cam–I share Ken’s concerns about the Trump wars and their likely consequences. He will use Trade “imbalances” and the deal with Iran partly to detract from his moral and legal problems. No one can safely predict the likely outcomes over the next few months. Perhaps the trade problems lead to some improvement. If not it will be an ugly mess for a while. Too many “known unknowns” . They are not yet in the market in my opinion. Iran may be the most serious problem where there is least room fro market pleasing compromise. Bob Millman