Preface: Explaining our market timing models
We maintain several market timing models, each with differing time horizons. The “Ultimate Market Timing Model” is a long-term market timing model based on the research outlined in our post, Building the ultimate market timing model. This model tends to generate only a handful of signals each decade.
The Trend Model is an asset allocation model which applies trend following principles based on the inputs of global stock and commodity price. This model has a shorter time horizon and tends to turn over about 4-6 times a year. In essence, it seeks to answer the question, “Is the trend in the global economy expansion (bullish) or contraction (bearish)?”

My inner trader uses the trading component of the Trend Model to look for changes in the direction of the main Trend Model signal. A bullish Trend Model signal that gets less bullish is a trading “sell” signal. Conversely, a bearish Trend Model signal that gets less bearish is a trading “buy” signal. The history of actual out-of-sample (not backtested) signals of the trading model are shown by the arrows in the chart below. The turnover rate of the trading model is high, and it has varied between 150% to 200% per month.
Subscribers receive real-time alerts of model changes, and a hypothetical trading record of the those email alerts are updated weekly here.
The latest signals of each model are as follows:
- Ultimate market timing model: Buy equities
- Trend Model signal: Bullish
- Trading model: Bullish
Update schedule: I generally update model readings on my site on weekends and tweet mid-week observations at @humblestudent. Subscribers receive real-time alerts of trading model changes, and a hypothetical trading record of the those email alerts is shown here.
Late cycle expansion = Inflationary revival
The missiles have flown, and the bombs dropped. Inflationary pressures are rising. Is this the time for gold to shine?
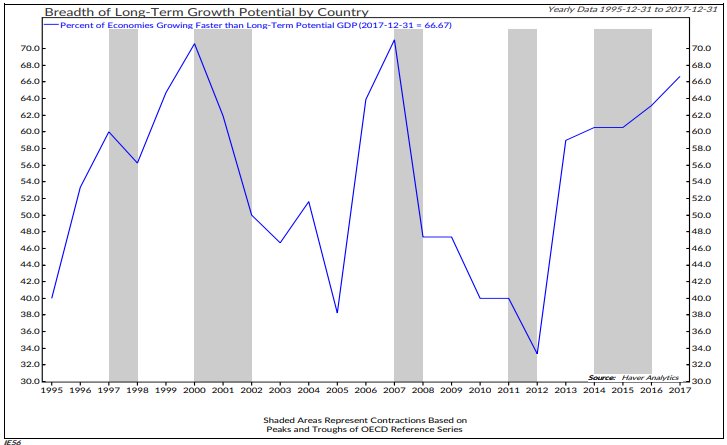
Notwithstanding the short-term effects of geopolitical tension, consider the longer term inflationary pressures, which are building not just in the US but globally. Ned Davis Research recently pointed out that roughly two-thirds of countries are growing above their long-term potential. Unless these countries can increase their potential through faster labor force or productivity growth, inflationary pressures begin to build, followed by central bank tightening. We could reach recessionary conditions in the next year or so.
This suggests that the economy is undergoing a late cycle expansion characterized by capacity constraints, which would lead to an inflationary revival. Gold prices are currently testing a key resistance level. Should it stage an upside breakout, who know how far they could go.

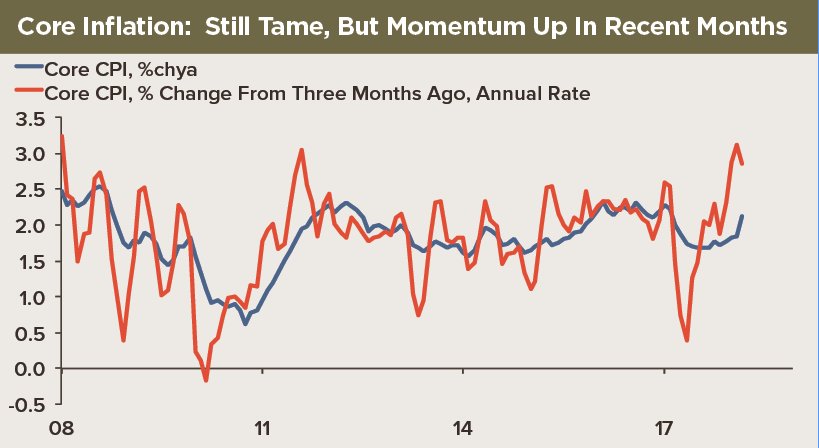
The macro bull case for gold is easy to make. Gold is an inflation hedge, and inflation momentum is rising.
J C Parets of All Star Charts highlighted a washout in the silver/gold ratio as an indicator of precious metal risk appetite. A rising silver/gold ratio would indicate that animal spirits have taken over the precious metal complex, which would be highly bullish.
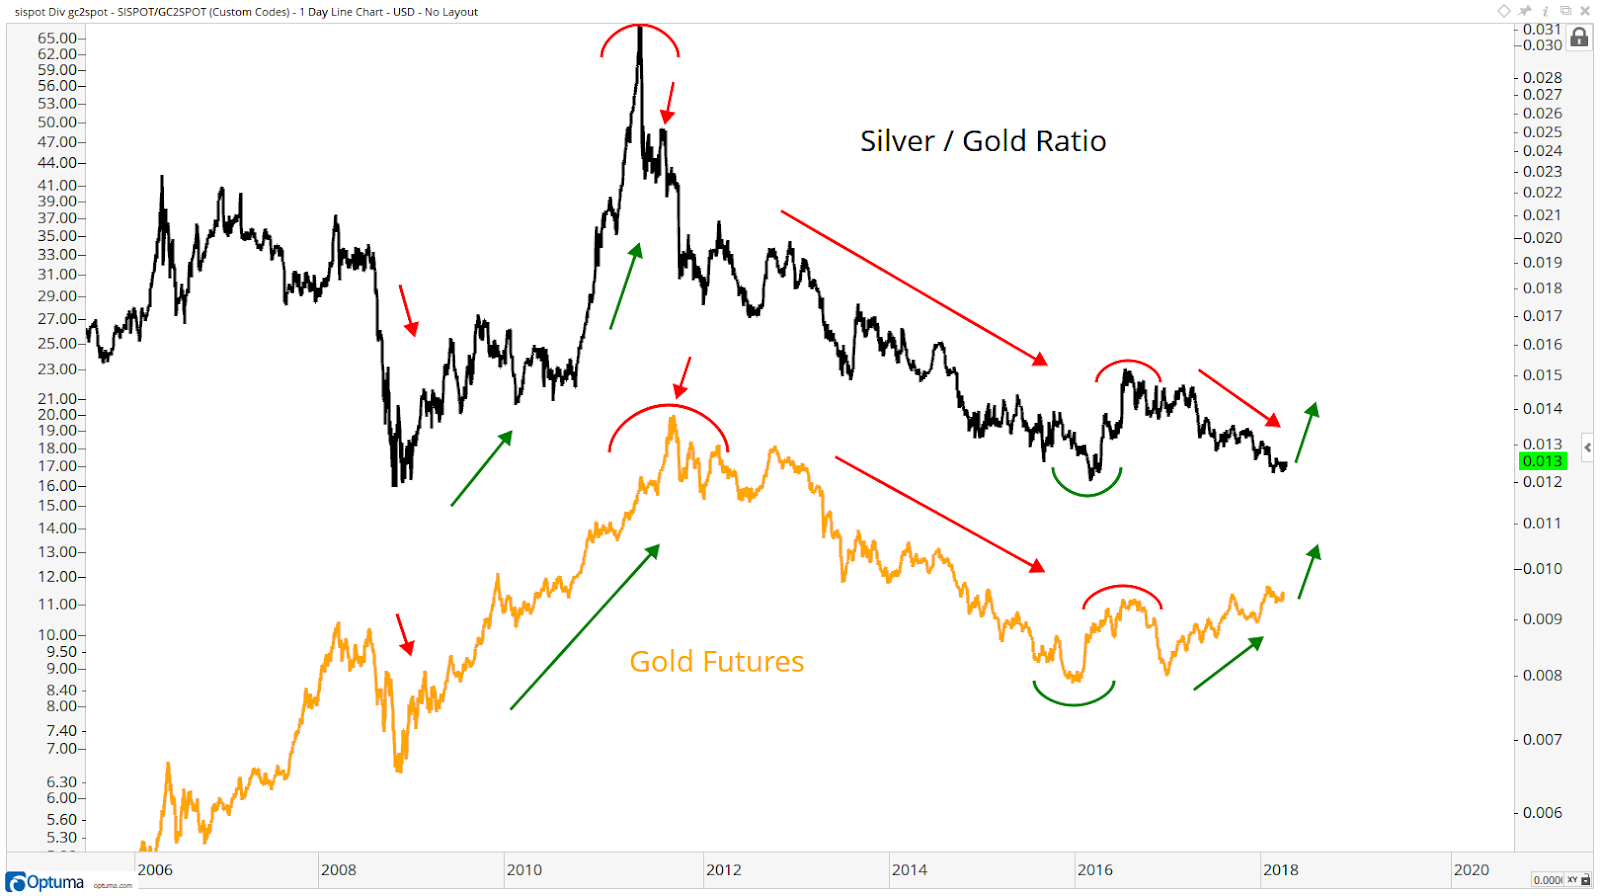
Tiho Brkan pointed out that hedge funds are in a crowded short in silver futures, which is bullish for silver, and for gold by implication.

In short, sentiment models indicate that silver prices are poised for a powerful rally. The combination of rising geopolitical tensions, and possible strength in silver prices would be highly bullish for gold and other inflation hedges.
Does that mean that investors and traders should pile into precious metals in anticipation of a late cycle inflation surge? Not so fast! There are two sides to every story, and the bull case for gold may be too facile to be true.
The bull case for gold
The underlying fundamental case for gold rests on rising inflation. The New York Fed`s Underlying Inflation Gauge (UIG) shows a distinct upward acceleration with the March reading at 3.1%, which is well above the Fed`s 2% inflation target.
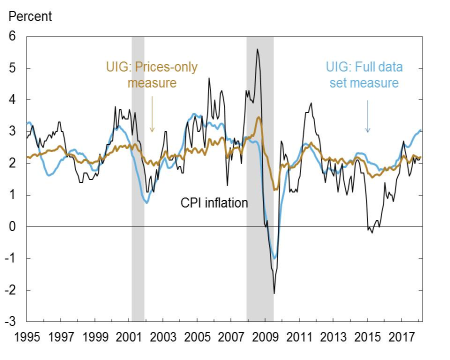
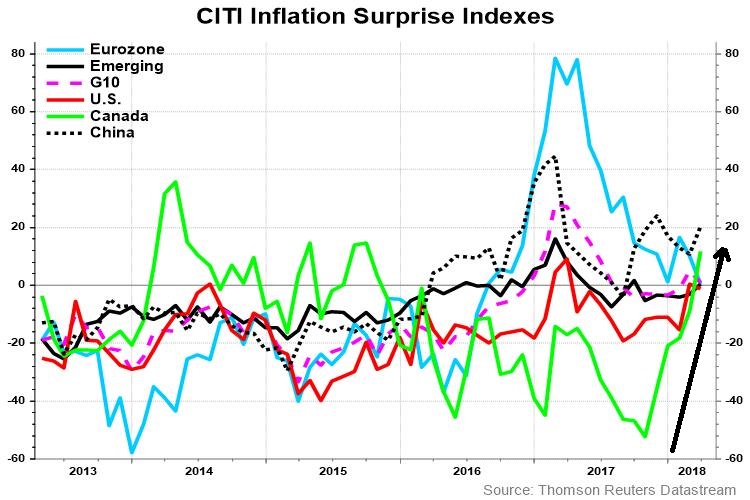
Not only is inflation rising in the US, the Citigroup Inflation Surprise Index indicates that positive inflation surprises are global in scope.
The junior/senior gold stock ratio (GDXJ/GDX) is equally encouraging for the bulls. As the following chart shows, the GDXJ/GDX ratio has tracked the silver/gold ratio very closely. Both are measures of precious metal risk appetite. Even as the silver/gold ratio languish at multi-decade support levels, the GDXJ/GDX is exhibiting a positive divergence, which could foreshadow strength in gold prices.
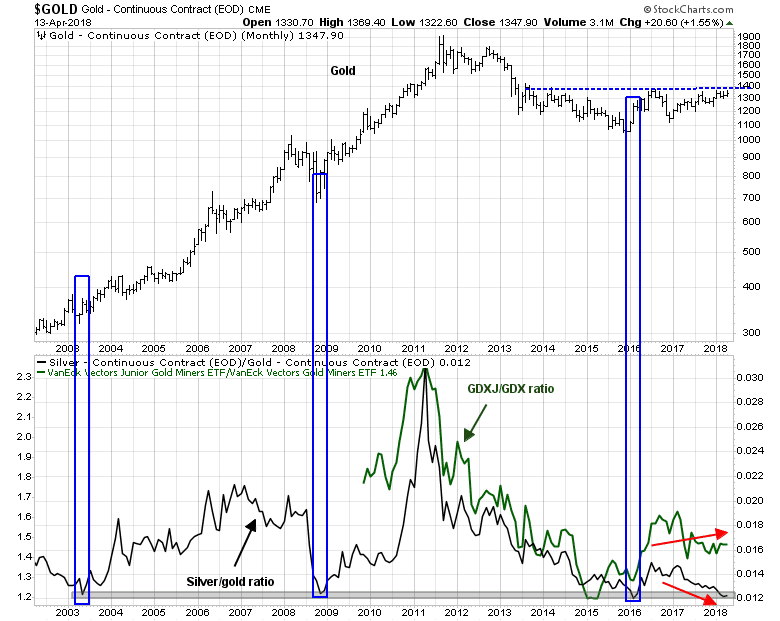
Should gold prices stage an upside breakout through resistance, point and figure charting calls for upside targets in the 1609 to 1678 range, depending on charting differences based on daily, weekly, and monthly prices, as well as box size and reversal parameters.

Stock market implications
What about the stock market? During the typical late cycle expansion phase, inflation hedge sectors become the market leaders, and stock market momentum starts to fade, but prices continue grind upwards.
As we head into Q1 earnings season, the quarter-end update from JPM Asset Management shows that the market is trading at a forward P/E of 16.4, which is decidedly average and not demanding by historical standards.
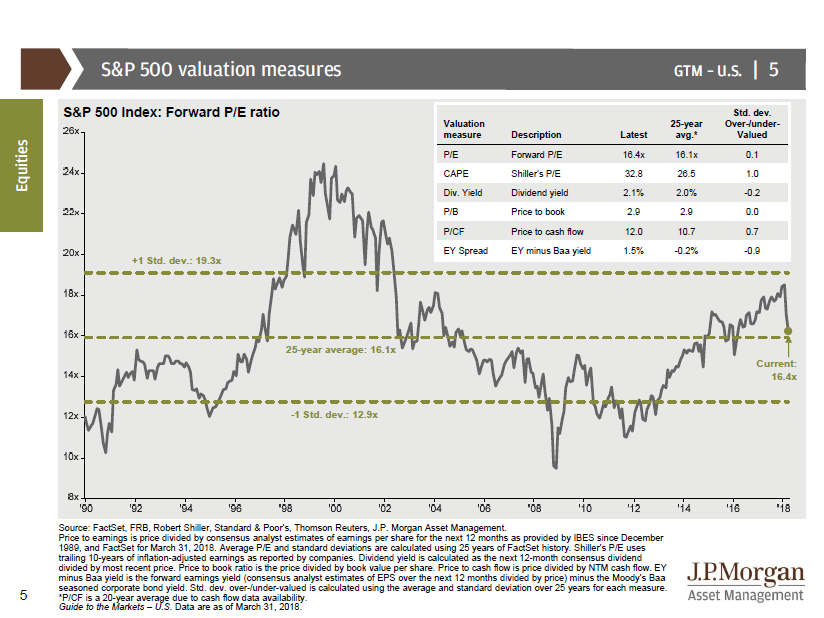
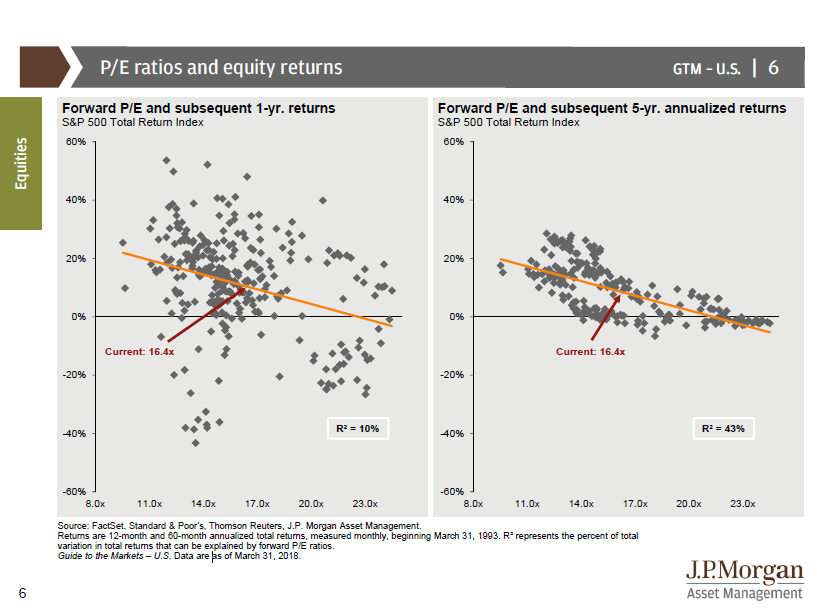
As the forward P/E ratio is average, so are expected returns.
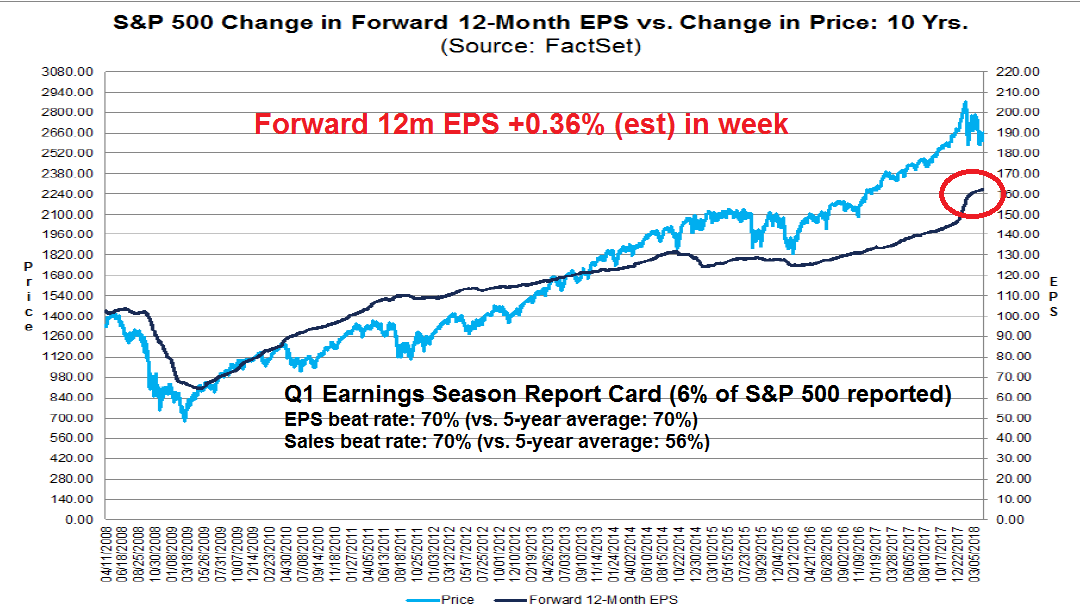
In addition, forward 12-month EPS continues to be revised upwards, which is an indication of fundamental momentum. FactSet reported that Q1 earnings guidance is the most bullish on record since they started tracking this metric in Q2 2006.
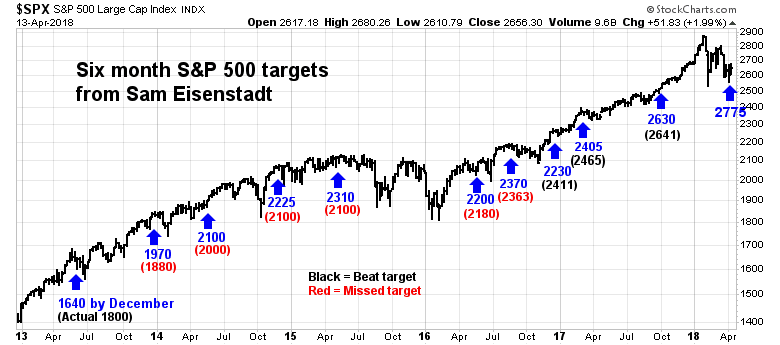
A scenario of a slow upward price grind is consistent with former Value Line research director Sam Eisenstadt’s latest forecast. I had most recently written about Eisenstadt’s track record (see Is this what a regime change looks like?) and pointed out that the r-squared on his six-month forecasts is 0.26, which is a remarkable statistic. The chart below shows the track record of his forecasts, as documented by Mark Hulbert. Hulbert reported that Eisenstadt’s latest SPX target for September 30 is 2775, which represents a price gain of 4.5% from current levels.
So up, up and away, for gold prices and, in the absence of trade tensions, stock prices?
The bear case
If life could be that simple!
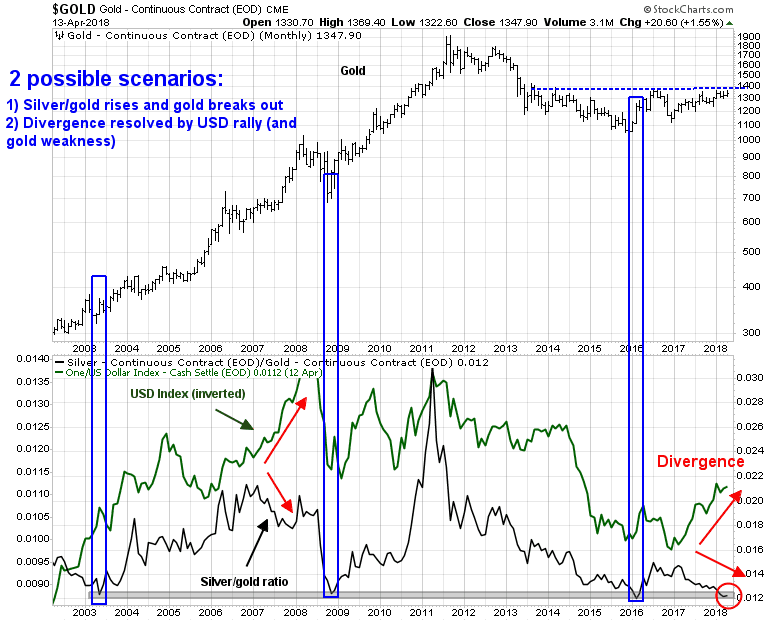
There is a glaring anomaly in the bull case. The chart below of the silver/gold ratio shows an unusual divergence with the US Dollar Index. Gold prices, as well as the silver/gold ratio, had shown difficulty making headway in spite of the weakness in the USD, which is inversely correlated to gold (note that the USD Index is inverted on the chart). The last time this happened was in the 2007-08 period, which resolved itself with a rally in the USD (and weakness in gold prices). The bull market scenario based on a bottom in the silver/gold ratio is not that simple. Either the silver/gold ratio takes off, and which is gold bullish, or the USD rallies, which is gold bearish.
Put it another way, the price of gold is reflective of inflation expectations. But gold also depends on the degree of monetary policy accommodation. Is the Fed ahead or behind the inflation fighting curve?
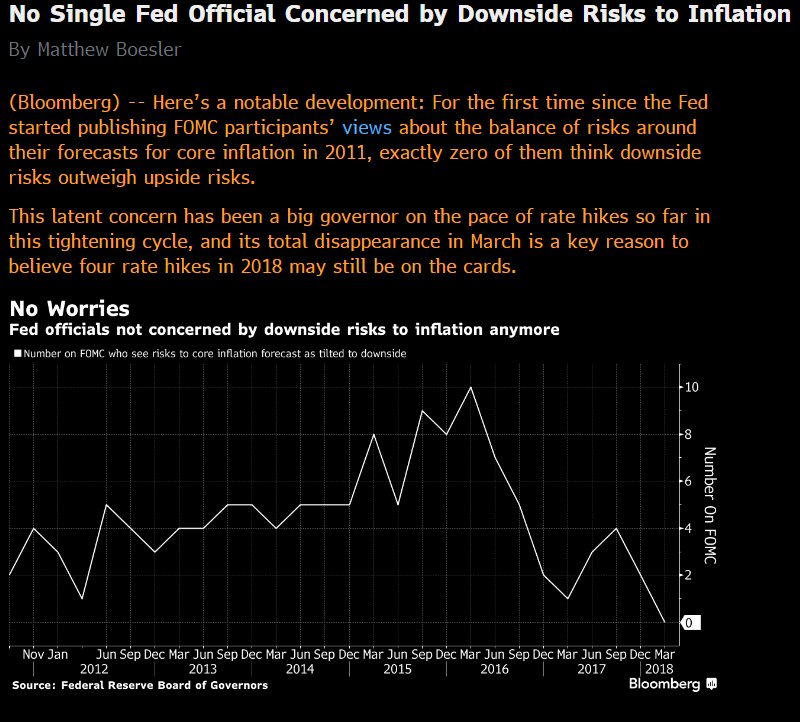
The latest FOMC minutes showed that the Fed is taking a more hawkish tilt in monetary policy, which is gold bearish. A Bloomberg story made the point that there are no doves left at the Fed. The consensus has shifted from a balanced and symmetric risk assessment to a debate over the degree of upside risks to growth and inflation.
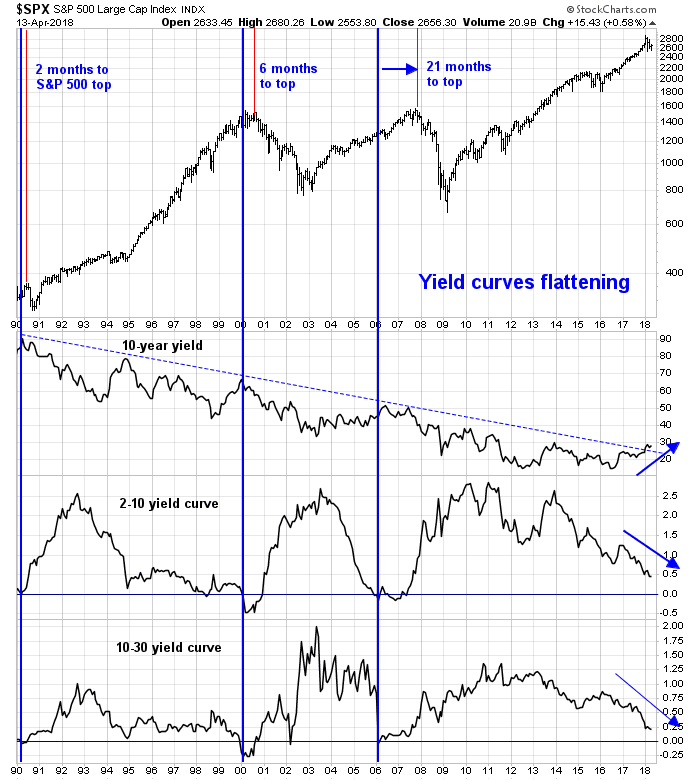
After the release of the FOMC minutes, the yield curves flattened, which is the bond market’s signal that it expects slower growth because of Fed policy. Both the 2-10 yield curve, which is now under 50bp, and the 10-30 yield curve, at 20bp, at sitting at new cycle lows.
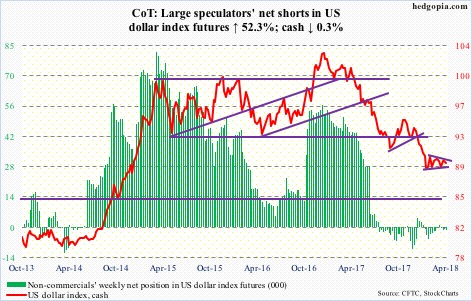
There are a number of other factors supportive of a USD rally. The Commitment of Traders chart from Hedgopia shows that large speculators are in a crowded short in the USD Index.
The euro is the biggest weight in the USD Index, and large speculators are in a crowded long in EUR futures.

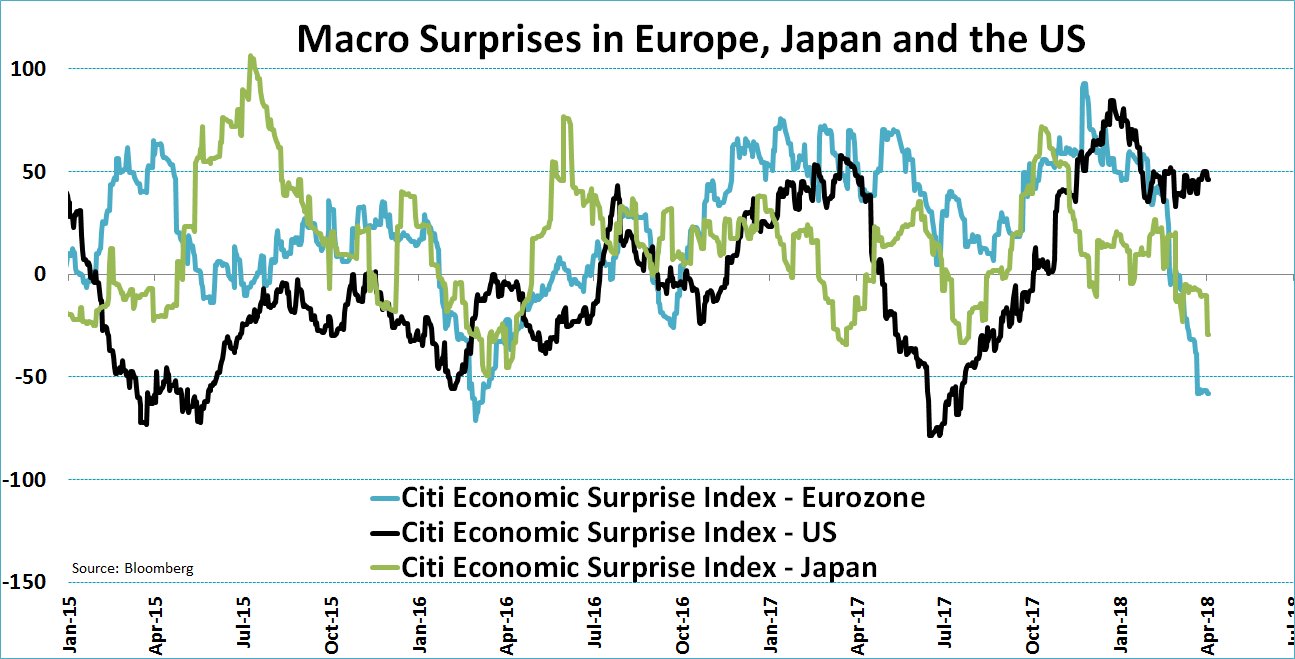
In addition, the Citigroup Europe Economic Surprise Index (ESI) indicates that European and Japanese macro data have disappointed badly, indicating a loss of growth momentum. By contrast, US ESI is positive, elevated, and stable.
Notwithstanding the possibility of a more hawkish Fed, which is USD bullish, the widening spread between American and European growth expectations also puts upward pressure on the USDEUR exchange rate. USD strength is likely to be bearish for gold prices.
Trade the breakout
Having outlined both the bull and bear cases for gold, who is right, the bulls or the bears?
I have no idea. What I do know is the bull case is not as easy as it sounds. Much depends on the direction of Fed policy, and the perception of Fed policy. I would therefore keep an open mind, and allow the market to give us clues by watching for the following signs:
- Upside breakout in gold prices;
- Recovery in the silver/gold ratio, which is confirmed by the GDXJ/GDX ratio; or
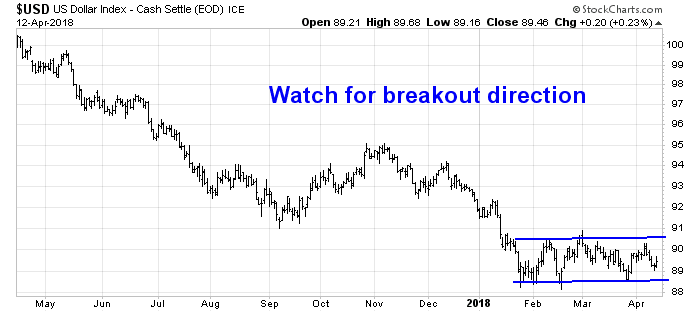
- The USD Index breaks out of its recent trading range, either on the upside or downside.
Until then, I remain “data dependent”.
The week ahead
Look to the week ahead, the SPX failed to stage an upside breakout last week from its inverse head and shoulders setup, but conditions are still supportive of the bull case. The small cap Russell 2000 did break out, and it pulled back to test the breakout turned support level.

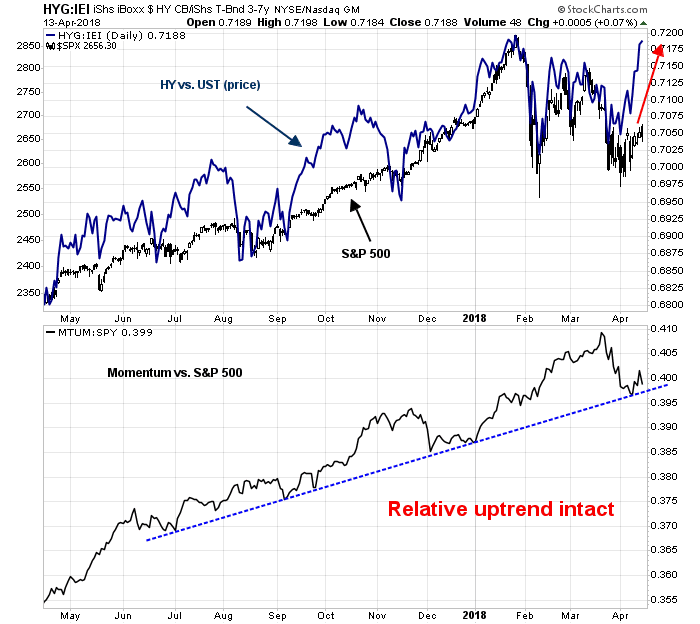
The relative performance of high yield, or junk bonds, to duration equivalent Treasuries, and the relative performance of the price momentum factor both indicate healthy risk appetite.
The latest AAII sentiment survey has declined to a minor bearish extreme. While sentiment indicators are highly inexact for market timing, these readings point to limited downside near-term potential for stock prices.
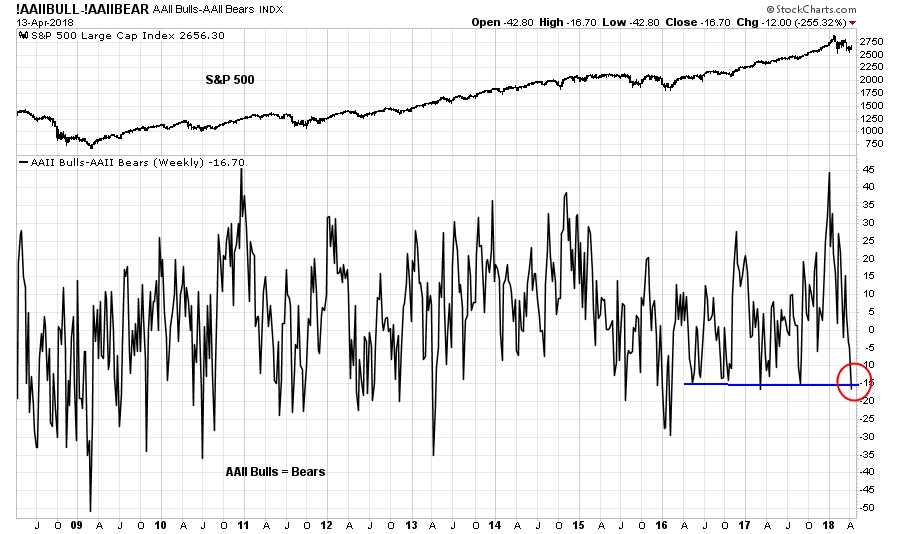
Tom Lee observed that bearish AAII sentiment at the start of Earnings Season tends to lead to higher stock prices a month later, though the data is noisy.

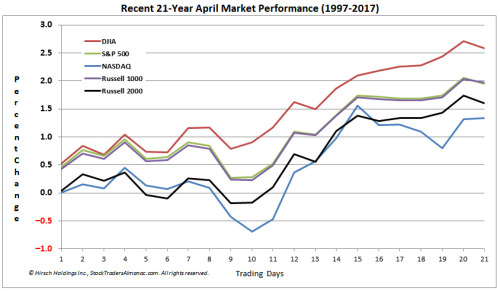
Seasonality is also on the side of the equity bulls. Jeff Hirsch of Almanac Trader found that the bulk of April’s stock gains tend to occur at the second half of the month. The chart below shows the seasonal stock market pattern in April. Friday was day 10, which represents the typical bottom for the month.
Next week is also option expiry week. Rob Hanna of Quantifiable Edges observed that April OpEx is one of the most positive OpEx weeks of the year.

The market was spared the usual geopolitical related volatility from the attack on Syria because it occurred on Friday after the market closed. Subsequent events suggest that that the Russian response will be limited, if any, and the bombing will have little effect on global tensions. I expect that the markets will therefore respond with either be a relief rally, or ignore the event and allow the fundamental and technical conditions to assert themselves.
Both my inner investor and inner trader remain bullishly positioned.
Disclosure: Long SPXL
Certain buy-and-hold portfolio managers suggest a constant holding of 10% in gold. I don’t agree with any buy-and-hold philosophy. I believe an investor should own various sectors when the outlook favors them. With gold, I believe bullion now should be included in the non-equity portion of one’s longer term portfolio. There’s enough evidence that it may be a useful hedge over the next period.
As far as short term trading, The gold miners either senior (GDX) or junior (GDXJ) are the vehicles of choice given ones leaning from Cam’s analysis.
Can someone please explain the terminology Crowded Shorts and Crowded Longs. I some kind of memory tricks/words to think about when I see those words – “”Oh, Crowded Shorts, that means they are …. “”
Cam – It would be nice over the long term if you could please create terminology glossaries – maybe one for words and one for phases – this would enhance the fishing tackle box 🙂
Crowded long = Too many people going long (contrarian bearish)
Crowded short = Too many people going short (contrarian bullish)