Preface: Explaining our market timing models
We maintain several market timing models, each with differing time horizons. The “Ultimate Market Timing Model” is a long-term market timing model based on the research outlined in our post, Building the ultimate market timing model. This model tends to generate only a handful of signals each decade.
The Trend Model is an asset allocation model which applies trend following principles based on the inputs of global stock and commodity price. This model has a shorter time horizon and tends to turn over about 4-6 times a year. In essence, it seeks to answer the question, “Is the trend in the global economy expansion (bullish) or contraction (bearish)?”
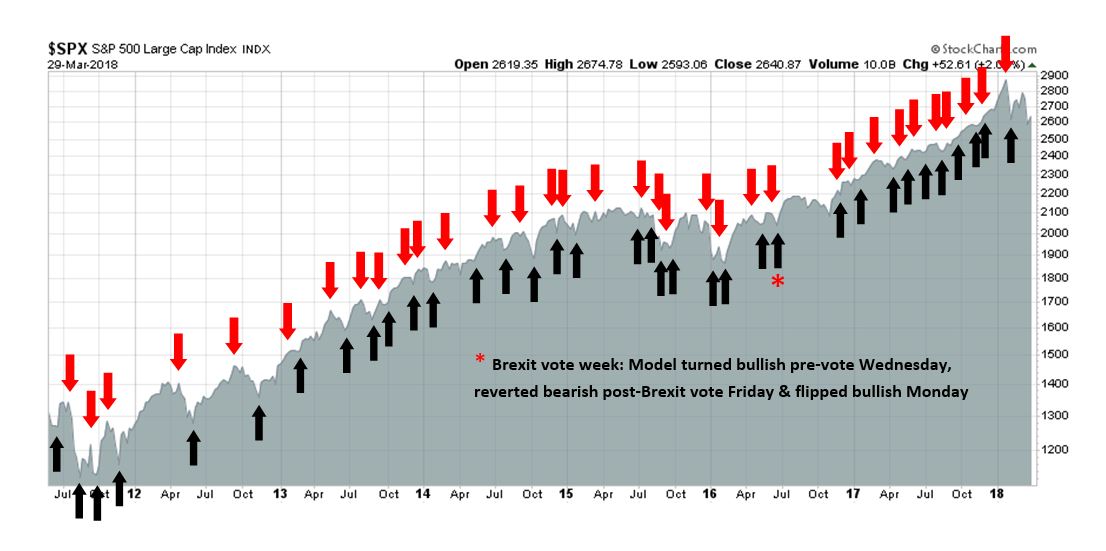
My inner trader uses the trading component of the Trend Model to look for changes in the direction of the main Trend Model signal. A bullish Trend Model signal that gets less bullish is a trading “sell” signal. Conversely, a bearish Trend Model signal that gets less bearish is a trading “buy” signal. The history of actual out-of-sample (not backtested) signals of the trading model are shown by the arrows in the chart below. The turnover rate of the trading model is high, and it has varied between 150% to 200% per month.
Subscribers receive real-time alerts of model changes, and a hypothetical trading record of the those email alerts are updated weekly here.
The latest signals of each model are as follows:
- Ultimate market timing model: Buy equities
- Trend Model signal: Bullish
- Trading model: Bullish
Update schedule: I generally update model readings on my site on weekends and tweet mid-week observations at @humblestudent. Subscribers receive real-time alerts of trading model changes, and a hypothetical trading record of the those email alerts is shown here.
Tech rollover = Regime change?
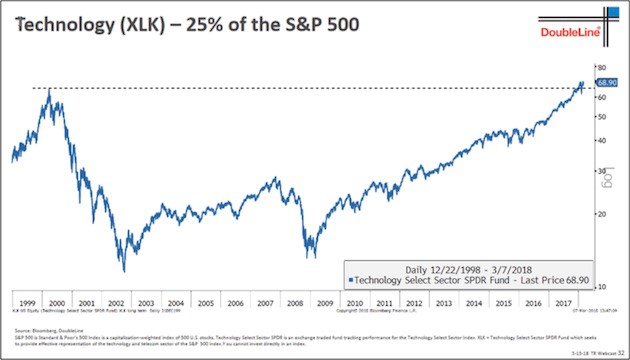
Is the stock market undergoing a regime change? The Average Direction Index (ADX) is a trend indicator developed by J. Wells Wilder to measure the strength of a price trend. The higher the ADX level, the strong the trend. The chart below shows the relative performance of technology stocks compared to the market. Even though this sector remains in a relative uptrend, the ADX of the relative performance ratio began to roll over in late 2017. The weakness in trend culminated in the recent carnage of FANG and semiconductor stocks.

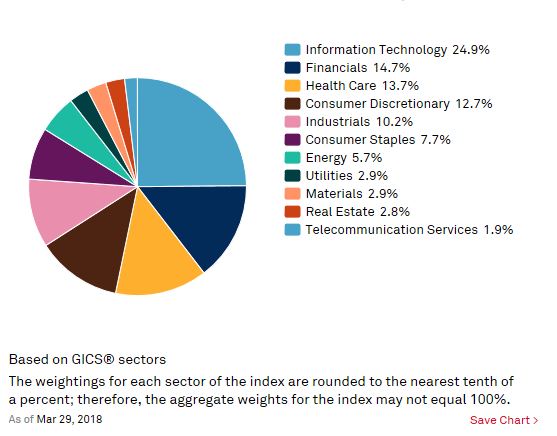
The enthusiasm for technology stocks may be overdone, as the sector has exceeded its weight in the SPX index, which last peaked during the NASDAQ Bubble.
There is a fundamental reason for the weakness in this sector. I had written about this possibility last October (see Peak FANG), where I suggested that the regulators would come for the Big Data companies in the next recession. Facebook and Google were the prime targets because they were in the surveillance business, largely because of the creepiness effect of their practices. Of the other FANG names, Amazon is also vulnerable because of their strategy to entice users into their walled garden by learning everything about them in order to sell them goods and services. The latest Facebook episode mane mean that the competitive moats of these companies may be already breached. A prolonged period of market performance may be in store, much in the manner of Microsoft after its anti-trust battle with the Justice Department.
In connection with the failure of FANG and technology leaders, the stock market is also showing signs of weakening. The SPX recently breached an uptrend line, and its ADX has also rolled over.
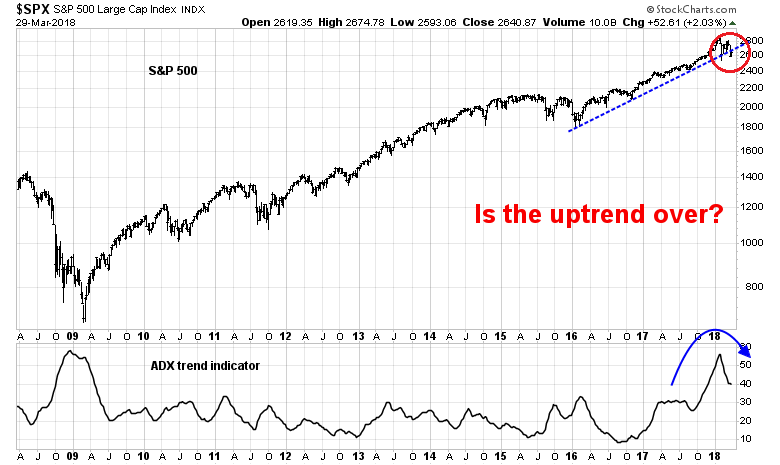
These developments raise two key questions for investors. If technology leadership is indeed failing, can any other sectors step up to take its place? As well, does the weakness in these high octane and high beta groups the sign of a top for the overall stock market?
The bull case
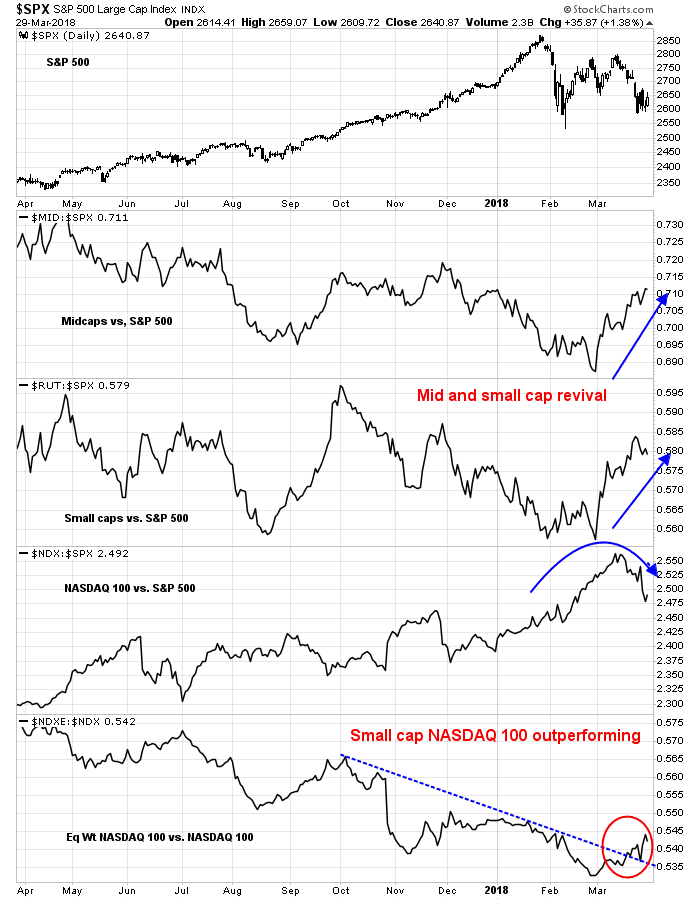
Let’s the bull and bear cases, starting with the bull case. A review of leadership by market cap shows that even though NASDAQ leadership wanes, mid and small cap stocks are poised to take over the leadership mantle. The smaller size effect is evident even within the NASDAQ 100 index, as the equal weighted NASDAQ 100, which gives bigger weights to the smaller cap stocks within the index, is outperforming its cap weighted counterpart (bottom panel).
Looking ahead to Q1 earnings season, the short-term outlook appears to be bullish. FactSet reports that forward 12-month EPS estimates are rising, which is indicative of positive fundamental momentum. Moreover, Q1 corporate guidance is on pace to be the best on record since quarter on record since FactSet started keeping records in 2006.

The positive momentum is not just confined to earnings, which is arguably affect by the newly passed tax cuts. Ed Yardeni found that are also being revised upwards as well, which is indicative of fundamental momentum at the operating level.
At a sector level, I have a couple of candidates that could become the new market leaders. Morgan Stanley recently reported that their capex tracker is surging. Rising capital expenditures would be supportive of earnings gains in the capital goods Industrial sector.
I analyzed the relative market performance of equal weighted industrial stocks, as heavyweight GE, which has been a significant laggard, is dragging down the cap weighted sector (bottom panel). The equal weighted relative performance of the industrial and capital goods sector (top panel) shows that the sector has been trading in relative range in 2018. Further positive earnings surprise could see this sector stage a relative upside breakout in the near future.

The other candidate for market leadership are financial stocks. Both the equal and cap weighted sector are in relative uptrends, though the equal weighted stocks are slightly better behaved (top panel) when compared to the cap weighted sector (bottom panel).
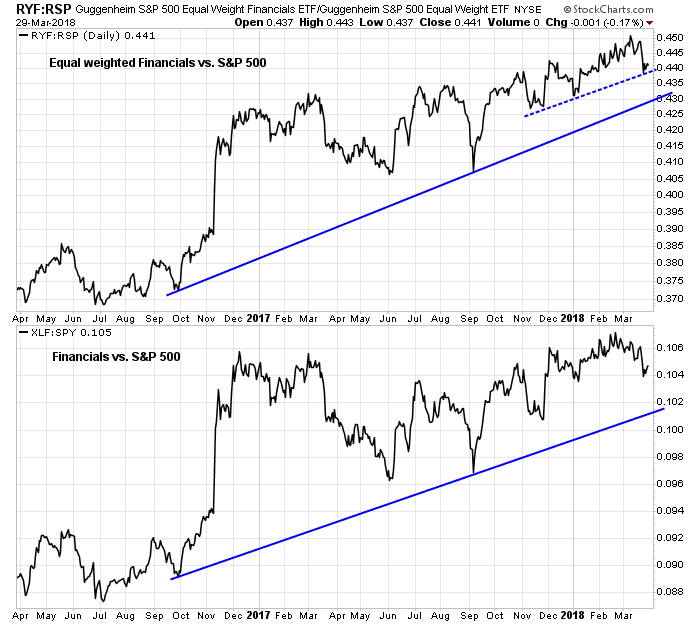
In short, the stock market bull remains intact. Earnings growth expectations are supportive of higher prices, with an anticipated shift in leadership from technology (25% weight) to industrial (10% weight) and financial stocks (15% weight).
The bear case
One of the key legs of the bear case rests on the amazing work of former Value Line research director Sam Eisenstadt. Six months ago, Mark Hulbert wrote that Eisenstadt had forecasted an SPX target of between 2620 and 2640 at the end of March. The index closed at 2641. Hulbert had been highlighting Eisenstadt’s forecasting track record for years, and stated that the r-squared of Eisenstadt’s six month forecast is 0.31, which is statistically significant at the 95% confidence level. The chart below shows Eisenstadt’s out of sample six month SPX forecasts since 2013, as documented by Hulbert.
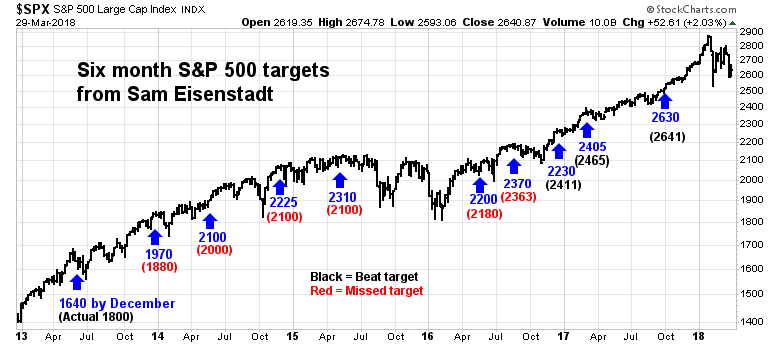
Here is what concerns me. In the last forecast as of September 2017, Hulbert wrote that “two of the more important inputs are low interest-rates and market momentum…[which] are mildly positive right now”. Both interest rates and momentum have deteriorated since then.
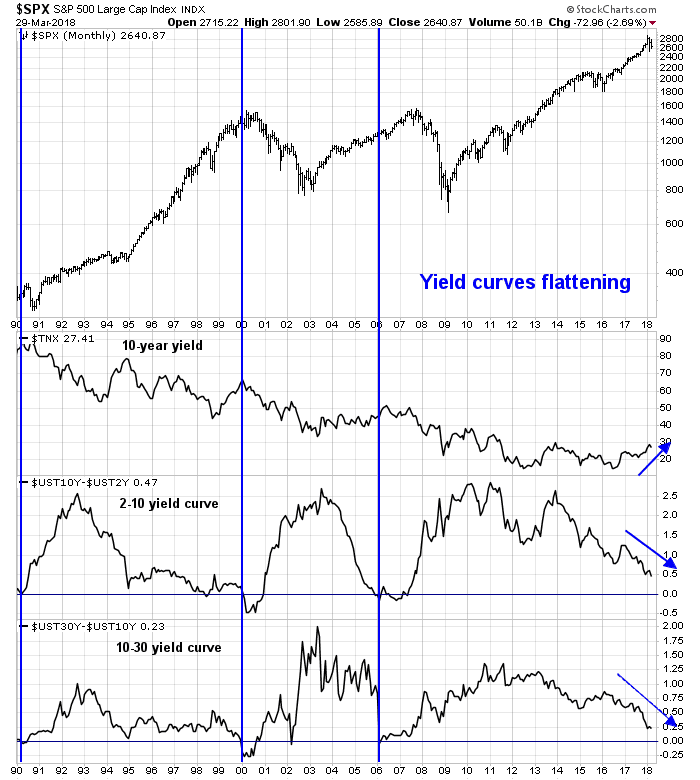
I have already pointed out how the ADX indicator is signaling a trend change and a possible loss of price momentum. Monetary conditions are also tightening and interest rates are rising. Both the 2-10 and 10-30 yield curves are flattening to a cycle low. Even though neither yield curve is inverted, two more quarter point rate hikes would do it. This would create the pre-conditions for a recession in late 2018, and an equity bear market to begin soon afterwards.
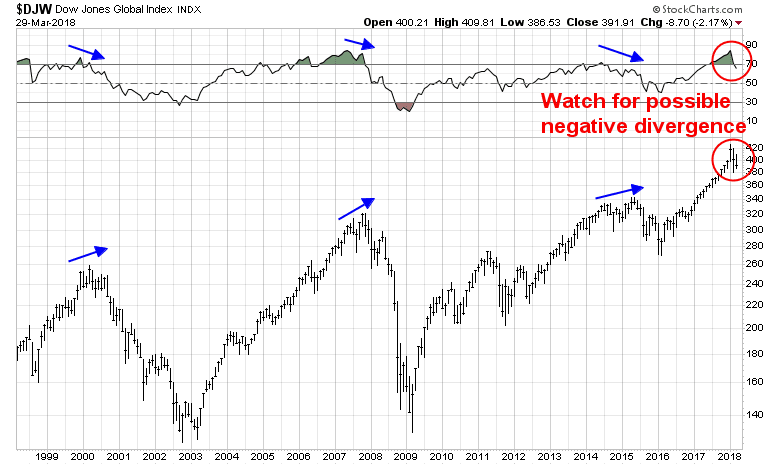
The loss of momentum is setting up for an RSI negative divergence sell signal. If history is any guide, the past three bear markets have been preceded by negative divergences in the 14-month RSI. While I am not in the habit of jumping the gun on model signals, should the latest correction end at these levels and rally to either test or make marginal new highs in the next couple of months, a negative RSI divergence is likely to appear at that point.
A different kind of regime change
Speaking of regime changes, another regime change risk is rapidly rising because of Donald Trump’s appointment of John Bolton as National Security Adviser. In a recent op-ed, conservative commentator George Will described Bolton as the “second most dangerous American”:
Because John Bolton is five things President Trump is not — intelligent, educated, principled, articulate and experienced — and because of Bolton’s West Wing proximity to a president responsive to the most recent thought he has heard emanating from cable television or an employee, Bolton will soon be the second-most dangerous American. On April 9, he will be the first national security adviser who, upon taking up residence down the hall from the Oval Office, will be suggesting that the United States should seriously consider embarking on war crimes.
As a reminder, Bolton was a strong advocate of the war on Iraq. He is also a strong advocate of attacking Iran and North Korea.
For the first time since the Second World War, when the mobilization of U.S. industrial might propelled this nation to the top rank among world powers, the American president is no longer the world’s most powerful person. The president of China is, partly because of the U.S. president’s abandonment of the Trans-Pacific Partnership without an alternative trade policy. Power is the ability to achieve intended effects. Randomly smashing crockery does not count. The current president resembles Winston Churchill’s description of Secretary of State John Foster Dulles — “the only bull I know who carries his china closet with him.”
Like the Obama administration, whose Iran policy he robustly ridicules, Bolton seems to believe that America has the power to determine who can and cannot acquire nuclear weapons. Pakistan, which had a per capita income of $470 when it acquired nuclear weapons 20 years ago (China’s per capita income was $85.50 when it acquired them in 1964), demonstrated that almost any nation determined to become a nuclear power can do so.
Bolton’s belief in the U.S. power to make the world behave and eat its broccoli reflects what has been called “narcissistic policy disorder” — the belief that whatever happens in the world happens because of something the United States did or did not do. This is a recipe for diplomatic delusions and military overreaching.
As recently as February 2018, Bolton penned a WSJ editorial entitled “The legal case for striking North Korea first”. Moreover, he has shown a history of strong arming the intelligence community to his views. In one case, when the intelligence officer refused to change his assessment, Bolton tried to get him fired (via Lobe Log).
The most egregious recent instances of arm twisting arose in George W. Bush’s administration but did not involve Iraq. The twister was Undersecretary of State for Arms Control and International Security John Bolton, who pressured intelligence officers to endorse his views of other rogue states, especially Syria and Cuba. Bolton wrote his own public statements on the issues and then tried to get intelligence officers to endorse them. According to what later came to light when Bolton was nominated to become ambassador to the United Nations, the biggest altercation involved Bolton’s statements about Cuba’s allegedly pursuing a biological weapons program. When the relevant analyst in the State Department’s Bureau of Intelligence and Research (INR) refused to agree with Bolton’s language, the undersecretary summoned the analyst and scolded him in a red-faced, finger-waving rage. The director of INR at the time, Carl Ford, told the congressional committee considering Bolton’s nomination that he had never before seen such abuse of a subordinate—and this comment came from someone who described himself as a conservative Republican who supported the Bush administration’s policies—an orientation I can verify, having testified alongside him in later appearances on Capitol Hill.
When Bolton’s angry tirade failed to get the INR analyst to cave, the undersecretary demanded that the analyst be removed. Ford refused. Bolton attempted similar pressure on the national intelligence officer for Latin America, who also inconveniently did not endorse Bolton’s views on Cuba. Bolton came across the river one day to our National Intelligence Council offices and demanded to the council’s acting chairman that my Latin America colleague be removed. Again, the demand was refused—a further example of how such ham-fisted attempts at pressure seldom succeed. There was even more to the intimidation than has yet been made public, but I leave it to those directly targeted to tell the fuller story when they are free to do so.
The NY Times reported that Secretary of Defense Mattis has told colleagues he is unsure if he can work with John Bolton.
I had suggested in early January that 2018 would be the year of “full Trump”, after he had achieved the primary objective of the tax cuts (see Could a Trump trade war spark a bear market?). The Bolton appointment is just part of an emerging pattern of the “full Trump”, where he has acted on his instincts.
Bolton will undoubtedly steer foreign policy toward tearing up the deal with Iran, which is likely to destabilize the region. Bloomberg reported that Energy Secretary Rick Perry is discussing the sale of nuclear power stations to Saudi Arabia in support of American supplier Westinghouse, which is in Chapter 11 reorganization. The sale would give the rights to the Saudis to enrich uranium, which is the first step to the acquisition of nuclear weapons.
The geopolitical threat is not restricted to just North Korea and Iran. The more dangerous red line is China, where Trump is playing the Taiwan card. A recent editorial in the state controlled China Daily warned against the passage of the Taiwan Travel Act, which permits high level discussions between Washington and Taipei officials:
Unlike trade, though, Taiwan is a matter of sovereignty. For Beijing, it is a clearly defined core interest that is not negotiable.
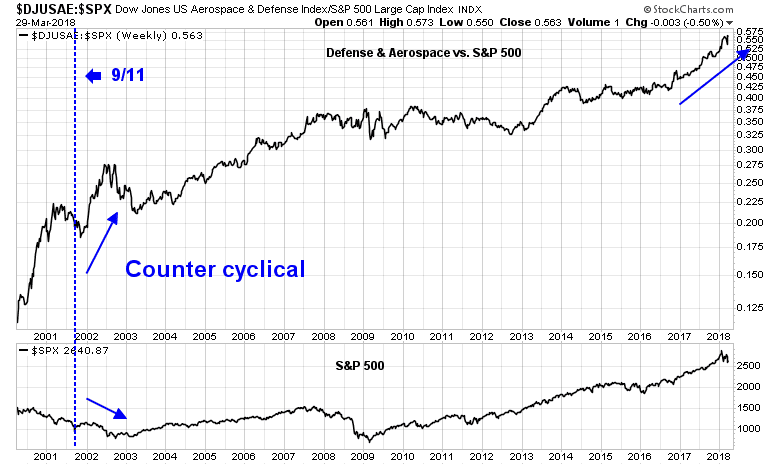
This latest move is reflective of what George Will characterized as using “U.S. power to make the world behave and eat its broccoli” that is risky and could lead to war, whether with North Korea, Iran, or China. As Bolton settles into his position, geopolitical risks is likely to rise, starting in 2H 2018. A rising geopolitical risk premium will unsettle global markets. In that case, the defense and aerospace sector is likely to outperform, and could become a safe harbor for equity investors should investors get rattled. The industry group is already in a relative market uptrend. The history of the group shows that it performed well and acted as a counter cyclical manner during the post 9/11 bear market.
Resolving the bull and bear cases
In summary, the bull case for equities is based on continued underlying fundamental and economic momentum. The near-term earnings outlook appears bright, and even if technology leadership were to falter, industrial and financial stocks are poised to take up the baton.
The bear case consists of rising monetary and price momentum headwinds. Price momentum is weakening, bond yields are rising, and the yield curve is flattening, which is a sign that the bond market is discounting slowing economic growth. In addition, the Trump’s appointment of John Bolton as National Security Adviser is likely to raise the geopolitical risk premium later this year.
Who is right? How about both? The near-term direction for equities is bullish, and stock prices are likely to test the old highs or make further marginal highs. However, this is part of a topping pattern where stock prices make a cyclical high this summer, and bearish factors begin to dominate later in the year.
The week ahead
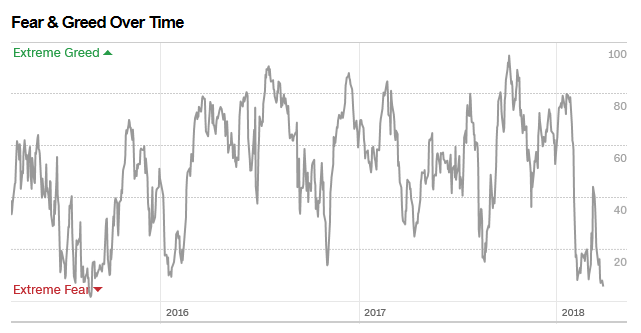
The week ahead may see further market volatility as last week. I believe that intermediate term downside risk is limited. The Fear and Greed Index is in single digits and oversold. Major bear legs simply do not start with readings this low.
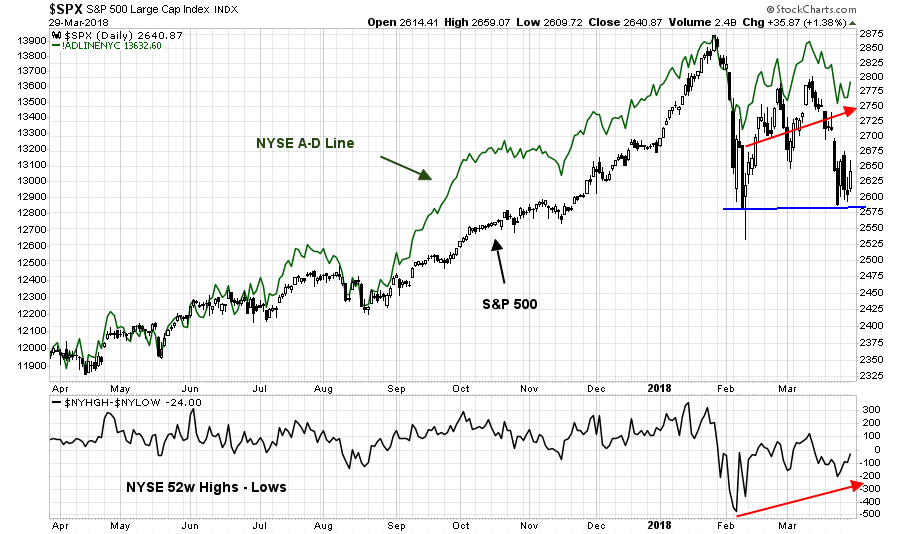
Market breadth indicators are supportive of a market bottom. Both the NYSE A-D Line and the NYSE Net highs-lows have exhibited positive divergences.
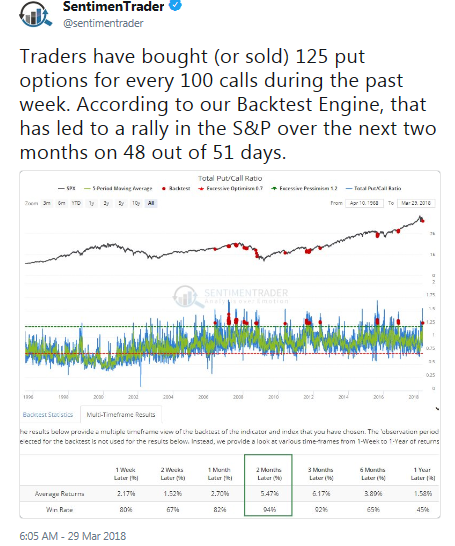
SentimenTrader also pointed out that the put/call ratio is favors market gains over the next two months.
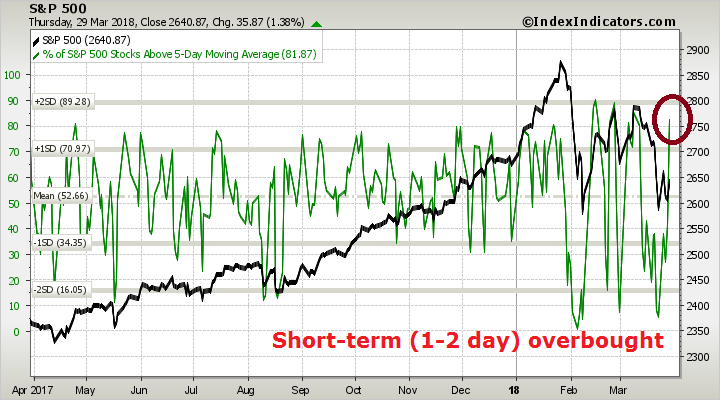
That said, the rally Friday left the market overbought on a short-term (1-2 day time horizon) basis. Expect some pullback or consolidation early next week.
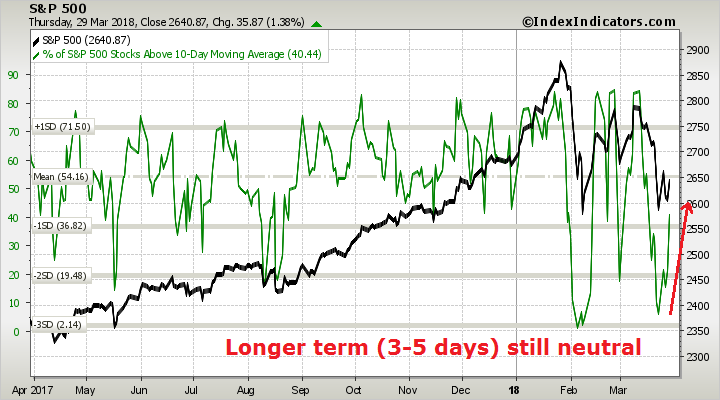
On a longer term (3-5 day) time horizon, readings are only neutral, and exhibit positive momentum. Expect further gains later in the week.
The big event next week will be Friday’s Jobs Report, followed by a speech by Fed chair Jay Powell on the economic outlook later in the day.
My inner investor remains constructive on equities. My inner trader is long the market. He believes that the risk/reward ratio favors the bulls over the bears.
Disclosure: Long SPXL
Cam, others
Could Tech stocks begin to differentiate? MSFT and NVDA are not really in the same business as FB, GOOGL and AMZN? If defense does well they will use tech in their missiles and planes, no?
hi Cam,
I noticed in this correction, your trading calls have been largely a single long call and lacking the nimble turn by turn calls from past corrections. Is this a change in trading style/strategy? Someone hold the long call from a few weeks ago would have missed some potentially profitable swing (albeit dangerous) trading opportunities.
The theme during the strong rise from December through to January was clear and simple.; “The tax cut would boost corporate earnings and personal spending.”. That positive message after a year of consistent gains, we must conclude is more than enough to send sentiment to a mult-year high.
It’s difficult to imagine how we can get enthusiasm back up to those highs. Tech is in a growing funk.
As we read Cam’s message (or any strategist), they have a rather a dry, technical message;. Earnings up and economy fine. This does not get speculators’ juices boiling.
The Wall Street Strategists’ target prices for all of 2018 we’re hit in late January.
All this to say, it looks like the January high is a bubbly sentiment peak that will be tough to better..
Parabolic upswings don’t normally correct sideways.
Cam’s missives of market tops being a process are well taken. Here is another brick in the wall to the top:
https://www.wsj.com/articles/the-danger-lurking-in-a-safe-corner-of-the-bond-market-1522584001?mod=cx_immersive&cx_navSource=cx_immersive&cx_tag=collabctx&cx_artPos=7#cxrecs_s
Another insightful analysis Cam; you clearly have superb skills in technical analysis. But then again begins the speculation in geopolitical events. Why not include all the other types of potential factors such as social (the data privacy mania), or creative (supplanting the FANGs), etc. Stick to your knitting.
For simplicity, just watch junk bond prices as a leading indicator. If the prices do not go back up above 200ma soon, some guys will take preemptive action and sell. In turn that will trigger some dummy risk-parity algos into rapid-fire selling. Then we go again. Even the econ backdrop is healthy, it won’t matter. Most of algos are based on AI. And just like AI cannot recognize the context, these algos act like they are alone in the aggregate econ continuum.
The action on the high yield spread widening are very different after the February correction. We had the normal big widening during the stock market decline but after the spread narrowed when markets had a recovery now we are seeing a sequence of higher high and higher lows. This is a negative pattern. Soon we could see the spread get wider than the maximum it reached in February. That, to me, would be a confirmation that we are shifting away from a bull market regime.
HY is not behaving badly when adjusted for interest rate moves. See this chart of the price of HYG when compared to duration-equivalent USTs.
http://schrts.co/Lquky3
No major positive or negative divergences to speak of. Arguably, there is a minor positive divergence.
When Sam Eisenstadt made his forecast, tax reform was far from certain. Forward P/E is about 16.5 instead of 17.9 in October 2017, projected earnings, I believe, have increased a little more than 10% – I am curious too see if and how that matters to Eisenstadt’s model.
Two points:
1) Top-down estimates of tax cut EPS effects are at 6-9% range. So far, the bottom-up 2018 EPS estimate is up 7% since the passage of the tax bill. Assuming no multiple expansion, pencil in 7-8% one-time tax bill effect on stock prices.
2) When Eisenstadt made his forecast, he did not also factor in the risk of a global trade war, which would depress earnings and the growth outlook either.
How those two factors play out, I don’t know, but it will be fascinating to find out.