Mid-week market update: Both my social media feed and the my questions this week have a jittery tone. Will the 200 day moving average (dma) hold as the SPX tests this important support level? What sectors or groups could step up to become the next market leaders if technology stocks falter?
Callum Thomas of Topdown Charts highlighted an important bifurcation in sentiment between the technicians and the fundamental analysts. He has been conducting an (unscientific) Twitter poll on a weekly basis since July 2016, and the latest results show a record level of bearishness among technicians, while fundamental analysts have largely shrugged off the recent round of market weakness.
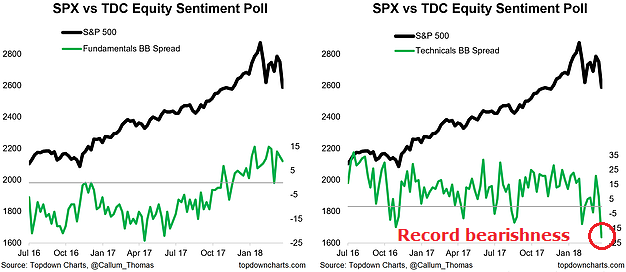
Who is right?
Fundamentally bullish
Let’s start with the fundamental outlook. As we approach quarter end, all eyes start to turn towards Q1 earnings season for some signs on stock market direction. One of the early clues to earnings season is corporate guidance. John Butters of FactSet reported last weekend that guidance is at an off the charts bullish reading:
At this point in time, 104 companies in the index have issued EPS guidance for Q1 2018. Of these 104 companies, 52 have issued negative EPS guidance and 52 have issued positive EPS guidance. The percentage of companies issuing negative EPS guidance is 50% (52 out of 104), which is well below the 5-year average of 74%.
If 52 is the final number of companies issuing positive EPS guidance for the first quarter, it will mark the highest number of S&P 500 companies issuing positive EPS guidance for a quarter since FactSet began tracking EPS guidance in Q2 2006.
I have documented in the past that bottom-up EPS estimates surged because of the tax cut effect. As the chart below shows, the rise in estimates from lower tax rates have petered out, and we are now seeing the organic growth element of EPS growth in Q1 estimates.
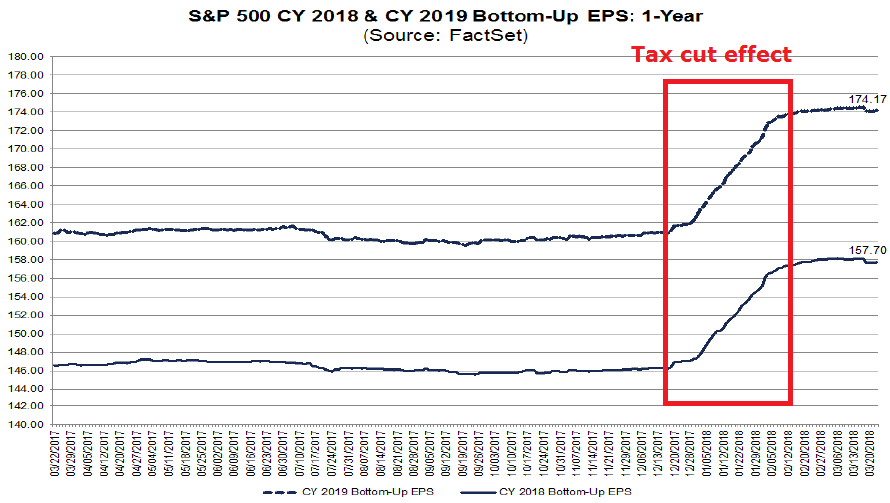
Looking ahead into April, the earnings outlook is positive. Trade war fears are fading. What do you have to worry about?
A crowded short
There is also evidence of capitulation. Inverse ETF volume is spiking indicating a crowded short. The last time this happened, the market was unwinding its crowded short volatility trade.

Notwithstanding the longer term problems that confront Facebook, the latest magazine covers could be interpreted as a contrarian buy indicator for the stock.

Technical buy signals everywhere, but…
From a short-term technical and sentiment perspective, I am seeing buy signals everywhere, though the market does not be responding as expected to these models, which is causing some concern.
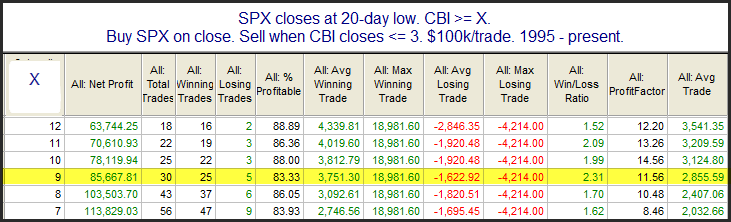
Rob Hanna of Quantifiable Edges maintains a Capitulative Breadth Indicator (CBI). While his normal buy signal occurs when CBI reaches 10, a study of its reading of 9 still shows a bullish edge.
Recession Alert’s Selling Pressure indicator shows that current conditions as extremely stretched on the downside, though a buy signal has not been generated yet until mean reversion occurs.

Similarly, I had highlighted a VIX buy signal when it rose above its upper Bollinger Band and mean reverted, though the market hasn’t responded as expected with a rally.

A past historical study has also shown a bullish edge.

Why the choppiness?
More volatility ahead?
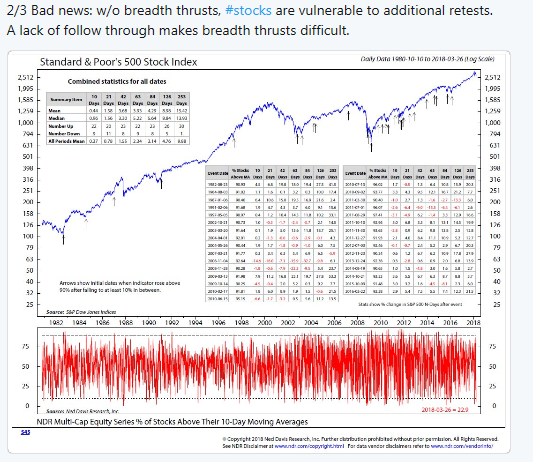
Ed Clissold of Ned Davis Research resolved the edginess felt by many technicians this way with some good news and bad news. The good news is selling pressure is abating, implying that any 200 dma test will not be resolved in a bearish fashion.

The bad news is that the bearish breadth thrusts that the market has experienced tend to be followed by further choppiness.
The best analogy of current market conditions may be the summer of 2011, when the market chopped around for about two months in a range for about two months before rallying. That period was marked by several false starts, as marked by exacta and trifecta buy signals from my Trifecta Bottom Spotting Model, and oversold readings from the Zweig Breadth Thrust indicator. If 2011 is the template, then expect the near-term SPX range to swing between 2600-2800, with an initial upside target of filling the gap at around 2700.

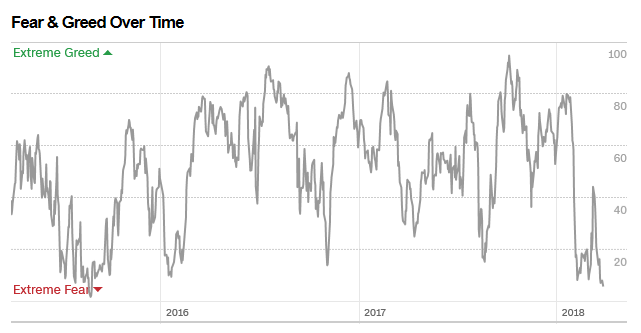
My inner trader remains bullishly positioned, as he believes that downside risk is limited at current levels. The Fear and Greed Index stands at 6. While I cannot predict what the market might do in the short-term, major bear legs simply do not start with readings at such low levels.
Disclosure: Long SPXL
It’s important to add that economists are getting negative too. Robert Shiller and David Rosenberg have turned very bearish.
Hi Cam, Everything you say is correct from a hold-long perspective.. However, the daily trend of both the $NDX & $SPX remains down.. If you are a trend trader, you are either out of this market or short.. If remaining long with a large drawdown, then emotions need to be dealt with.. What to do if you can’t sleep? A trader asked, “…I can’t sleep thinking about it. It is wearing me out. What can I do?”..His friend advised, “Sell down to the sleeping point”.. Also, one must always remember the observation of John Maynard Keynes, “Markets can remain irrational a lot longer than you and I can remain solvent.” Good luck to everyone..
This market seems to be bouncing off the 200 DMA. For now, VIX index in the low 20s is not smelling ‘too much pain’. However, headline numbers seem to be bottoming off. Other technicals than Cam has summarized seem to be contrarian buys. LIBOR seems to be a problem(https://www.wsj.com/articles/libors-rise-accelerates-squeezing-short-term-borrowers-1522152000), but we shall see, whether it keeps rising into early April. For traders, tight stops may be the way to go. The closer we get to earnings season, one hopes to see some traction on long side (Alcoa kicks off Q1 earnings on 4-18; Intel follows next week).
That said, politics seems to be becoming a factor bearing down on the markets also.
Look at XLK vs SPY, technology has risen in price too fast vs other sectors so that portfolio allocations became distorted. This is similar to what happened at end of January when stocks rose too fast in value vs bonds. XLK vs SPY reached an extreme during the March 19th week, managers had to adjust their sector allocations. As technology is the largest sector, this has created great selling pressure on the market over the last 2 weeks. In addition, managers where underweight bonds und overweight stocks too much, driven by the rapid changes in price. The overweight allocation of European vs US stocks has also lead to the relative outperformance of the latter. See also Urban Carmels analysis: http://fat-pitch.blogspot.de/2018/03/fund-managers-current-asset-allocation.html