As the SPX sold off today and tested the 200 day moving average (dma) while exhibiting positive RSI divergences, a Zen-like thought occurred to me. Is the market testing the 200 dma, or is it testing you?

Oversold, but…
The stock market is obviously very oversold. My Trifecta Bottom Spotting Model flashed another exacta buy signal today. While this model has not worked well in the recent past, the appearance of either an exacta or trifecta signal is an indication of an oversold market, with the caveat that oversold markets can get more oversold.

The TRIN indicator, which can indicate panic selling when it rises above 2, is more revealing on the 30-minute chart. During “normal” periods of panic liquidation, TRIN spikes at the end of the day in conjunction with price declines because of margin clerk and risk manager induced selling. Today, we saw TRIN hold up and rise, even as the market staged a minor late day rebound.

Now that’s real panic selling!
Unbridled panic
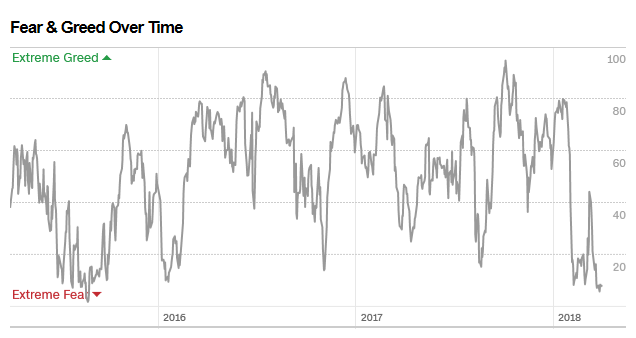
I recently pointed out that the Fear and Greed Index is now in single digits. Even if you are bearish, be warned that major market down legs don’t begin with sentiment at these levels.
As for the test of the 200 dma, I refer readers to Helene Meisler’s recent Real Money column, where she stated that the time to worry about a breach of this key support level is when the 200 dma begins to fall:
The general rule is the longer the S&P (or any index or stock) spends in a trading range and then breaks down from there, the more negative it is because that has given the long-term moving average line a chance to roll over — and rolling-over moving average lines are resistance on any rally.
The 2011 template
I suggested last week (see Technicians nervous, fundamentalists shrug) that a template for today’s market might be 2011, when the market chopped around for about two months before resolving itself in a bullish fashion. During this period, which is marked by the shaded area, the market generated a series of exacta and trifecta buy signals, as well as Zweig Breadth Thrust oversold readings.

Even if you are bearish, wait for the rally (and there will be one) to see if the market makes a lower high before going short.
Disclosure: Long SPXL
I agree…we will go higher.
Fortunately as a portfolio manager, I don’t need to or try to trade on a short term basis. Cam’s analysis helps me time intermediate term buys and sells.
When you see those articles about how, if you miss the 10 (or 20 or 50) biggest up days in history, you will have done poorly. Well, in doing the research, others have debunked that by finding that the big up days are during bear market when the down days alternate with the up. They’ve found missing both the ups and the down, one does much better. In other words, missing the downs is more important.
All this to say that we are in a bear market type of volatile period that can be fruitful if a trader is accurate. But it is a treacherous minefield. Good luck to all that brave this environment.
For my clients, from December on, I’ve reduced risk exposure many times to where they are now at their lowest equity exposure I can imagine.
My overall negative mood is very likely caused by my research indicating the Canadian TSX index has recently started a bear market. Canada is the ‘canary in the coal mine’ leading indicator of what happens to a highly indebted society when interest rates go up. In my opinion, the bird dropped dead. Others may follow.
The other thing that could be happening with my bleak mood is simply behavioral economics. When the sentiment gauges like the Fear and Greed Index are at a low like now, I being a human, will also be fearful. True. But that’s why I have learned to do things ahead of time rather than when the panic is happening. And I WILL fight these behavioral fears at some future more permanent low and buy when investors are truly giving up on the stock market.
Cam
The 2011 graph shows the S&P well below the 200 DMA. Yes, your point about Exacta and Trifecta signals is well taken during the 2011 time frame. That said, the market based around August-September, setting a range. It took till January 2012 for it to rally above 200DMA.
At the current time, we are just bouncing off the 200 DMA. Spot VIX is in the low 20s (I do not like the VIX:VXV graphs). I like spot/cash VIX, as sheer indication of fear. We may get a rally here, just based on market being oversold, but only time will tell if the rally has any conviction behind it or not. For now, the market is experiencing death by thousand cuts. As we approach the earnings season, it may gain some traction, but that is a few weeks away.
2 quotes from successful Veteran Trader Peter Brandt’s Twitter feed: (1) “There are two types of drawdowns in market speculation — capital drawdown and emotional drawdown. Traders need to protect viciously against both. In some respects an emotional drawdown is the worst of the two.” and (2)” I place much greater priority on protecting capital than on my opinion of a chart.”..
That said, tonight stock index futures are up which may lead to an up-day tomorrow..
Thanks for the comment; agree 100% with the sentiment — I have experienced both kinds of “drawdowns”, and generally find that once I resume trading, I can again do well — often battling far enough through the ’emotional drawdown’ to get started again is the problem. Not to mention rigorously using stops etc to limit ‘capital drawdowns’ in the future.
The technical situation looks dire — but Cris Ciovacco doesn’t seem to think the weight of the evidence is bearish yet. 200dma still sloping upwards.
And fundamentally, I see little chance of a recession. Fred Piard’s MTS10 scale of recessionary risk is at its lowest.
The market reacted manically to Trumps tax-relief silliness, and now it is reacting depressively to Trumps trade-war stupidity. The bear will come, but I think he needs more time.
“(and there will be one)”
This market also reminds of the weeks after the Aug, 2015 meltdown — VIX remained elevated for a good while after that, although back then it also appeared the general market would rise — this current market has the same feel.
Cam’s analysis of “full Trump” appears prescient. We are in the early days of a new political regime that is now taking on the existing world order. I suppose, only time will tell if there are any positives for the US or not.
The second presidential year generally is quite volatile (-10 to 20%), but the third year (pre-election year) usually is positive. We have ways to get to fall 2018, when candidates become serious about pre election year (2019). Today’s futures are down significantly, and the markets seem to want to retest the February lows. So far, panic seems not to have set in yet. No disorderly sell offs, no spikes seen in spot VIX, nor obscure corners of the markets (Libor, Ted spreads and God only knows what else).