Mid-week market update: As the market bounces around in reaction to the headline of the day, it is important to maintain some perspective and see the underlying trend. Numerous sentiment and technical indicators are pointing towards a bottoming process and a bullish intermediate term outlook. Day-to-day price movements, on the other hand, are hard to predict.
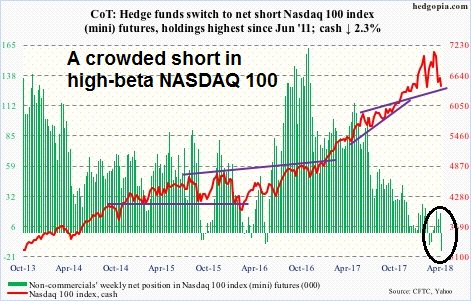
Consider, for example, the positioning of large speculators (read: hedge funds) in the high beta NASDAQ 100 futures and options. Hedgopia reported that large speculators are in a crowded short in NDX.
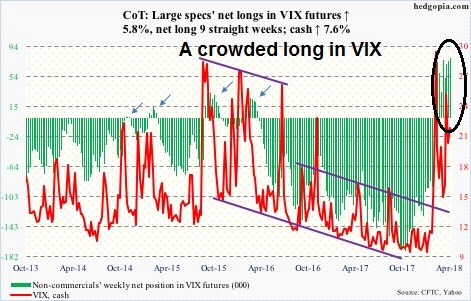
By contrast, large speculators are in a crowded long in the VIX Index, which tends to move inversely with the stock market.
While Commitment of Traders data analysis tend to work well as a contrarian indicator on an intermediate term time frame, sentiment models can be inexact market timing indicators.
Bullish technical confirmation
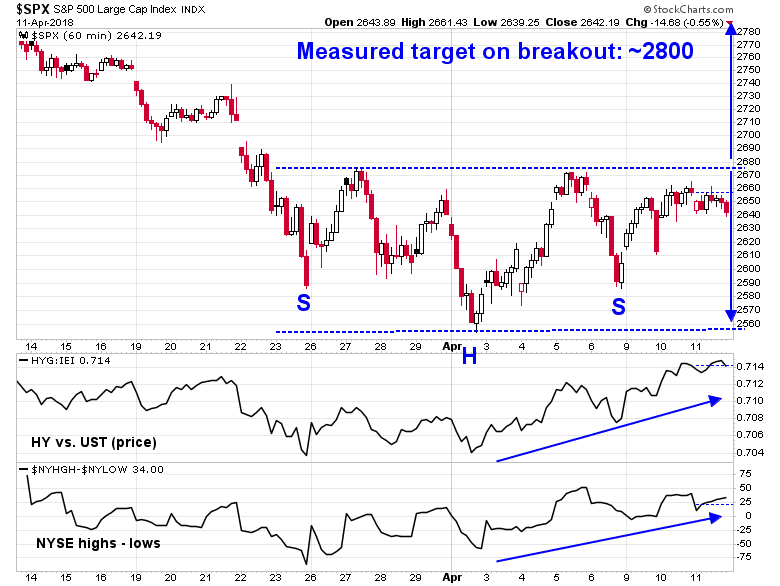
In the short-term, risk appetite and breadth indicators are also supportive of higher prices. This hourly chart of the SPX suggests that the index is in the process of forming an inverse head and shoulders formation. Before jumping the gun and getting all excited, good technicians know that head and shoulders formations are not complete until the neckline is broken. Nevertheless, both the NYSE new highs-lows breadth indicator and the relative performance of high yield bonds against duration-equivalent USTs indicate positive divergences. Should the market stage an upside breakout at the 2675 neckline, the measured target would be about 2800, with initial resistance at about the 2700-2710 level.
The small cap Russell 2000 is already showing signs of an upside breakout from its inverse head and shoulders pattern. The index pulled back but remains above the breakout resistance turned support level.

Equally encouraging is the behavior of Schaeffer`s open interest put/call ratio on SPY, QQQ, and IWM, which surged to levels last seen in 2011.

If history is any guide, such readings have been bullish on an intermediate term basis. Shorter term, however, results are mixed and uncertain because of the low sample size (N=8). Even though one-week average and median returns are promising, the one-week % positive statistic of 63% is virtually indistinguishable from the benchmark anytime statistic of 59%.

Greater clarity from Earnings Season
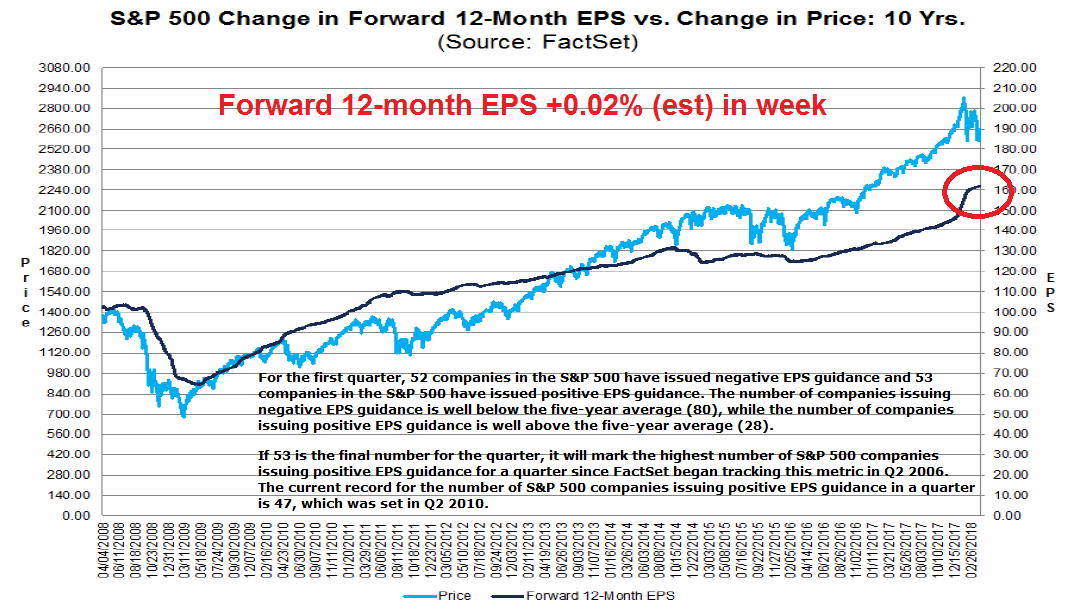
As we enter Q1 earnings season in the weeks ahead, the market may get greater clarity from the fundamental outlook. The latest update from FactSet indicates that forward 12-month EPS continue to rise, indicating fundamental momentum. As well FactSet also reported that the positive to negative guidance ratio is at an off the charts bullish reading.
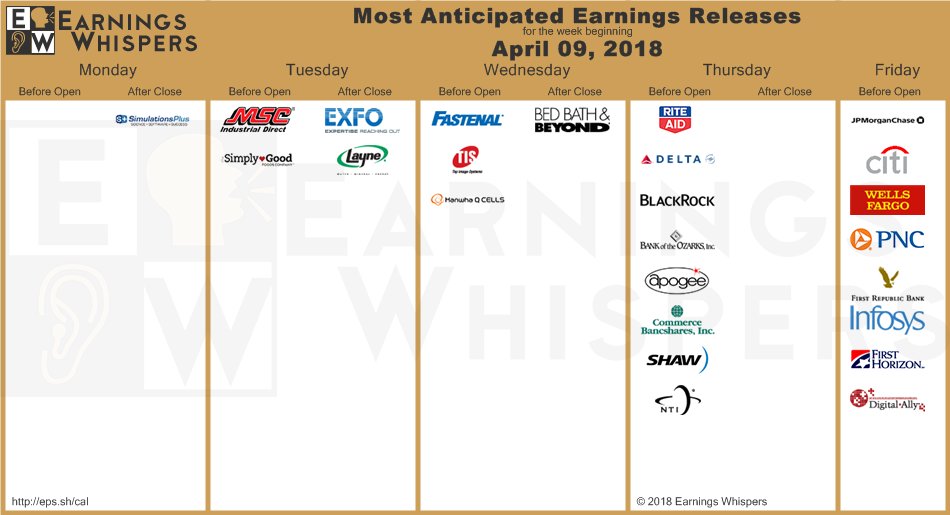
Earnings reports begin in earnest on Friday, starting with a selected financial stocks. While the market is likely to react on a daily basis to the earnings and macro news of the day, I expect that the bullish fundamental, technical, and sentiment factors outlined will assert themselves in the weeks to come.
Let the reporting season begin!
Disclosure: Long SPXL