Preface: Explaining our market timing models
We maintain several market timing models, each with differing time horizons. The “Ultimate Market Timing Model” is a long-term market timing model based on the research outlined in our post, Building the ultimate market timing model. This model tends to generate only a handful of signals each decade.
The Trend Model is an asset allocation model which applies trend following principles based on the inputs of global stock and commodity price. This model has a shorter time horizon and tends to turn over about 4-6 times a year. In essence, it seeks to answer the question, “Is the trend in the global economy expansion (bullish) or contraction (bearish)?”
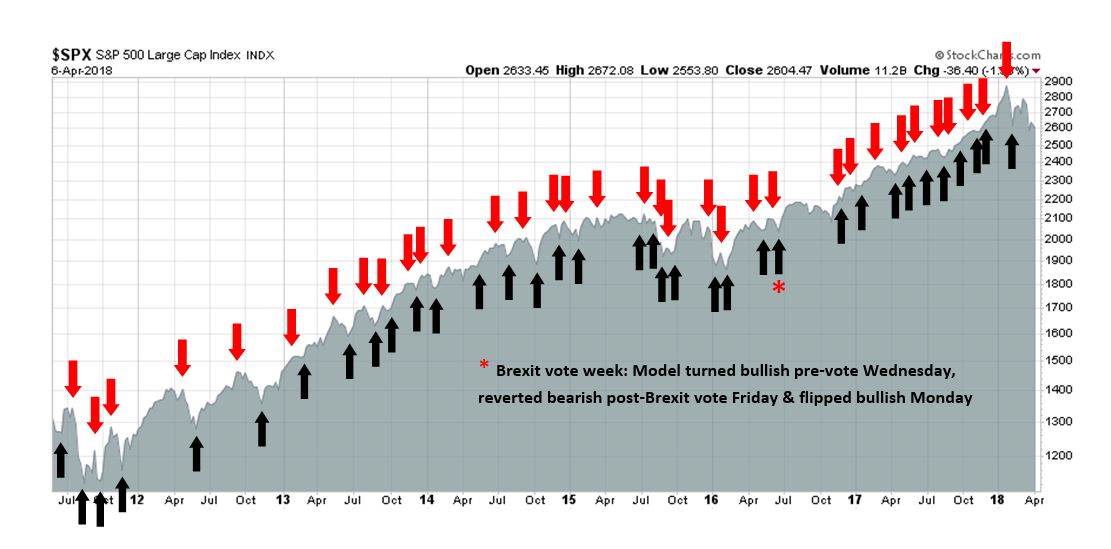
My inner trader uses the trading component of the Trend Model to look for changes in the direction of the main Trend Model signal. A bullish Trend Model signal that gets less bullish is a trading “sell” signal. Conversely, a bearish Trend Model signal that gets less bearish is a trading “buy” signal. The history of actual out-of-sample (not backtested) signals of the trading model are shown by the arrows in the chart below. The turnover rate of the trading model is high, and it has varied between 150% to 200% per month.
Subscribers receive real-time alerts of model changes, and a hypothetical trading record of the those email alerts are updated weekly here.
The latest signals of each model are as follows:
- Ultimate market timing model: Buy equities
- Trend Model signal: Bullish
- Trading model: Bullish
Update schedule: I generally update model readings on my site on weekends and tweet mid-week observations at @humblestudent. Subscribers receive real-time alerts of trading model changes, and a hypothetical trading record of the those email alerts is shown here.
Fade the trade war jitters
“Fool me once, shame on you. Fool me twice, shame on me.” We’ve seen this movie before on trade. The White House begins the process with tough and inflammatory rhetoric, only to see the threats walked back or watered down later.
Consider the case of the steel and aluminum tariffs, which were levied for national security reasons. The initial announcement shocked the market, but the Trump administration eventually walked back most of their effects by providing exemptions for Canada, Mexico, the EU, Australia, Argentina, Brazil, and South Korea. Um, those exemptions account for over half of American steel imports. What “national security” considerations are we referring to?
The KORUS deal is another example. The agreement was hailed as a great victory by the Trump administration, but the tweaks were only cosmetic in nature. The South Koreans agreed to two concessions. In return for an indefinite exemption from the steel and aluminum tariffs, Seoul agreed to a steel export quota to the US, but the quotas are toothless because they are contrary to WTO rules and could be challenged at anytime. In addition, South Korea doubled the ceiling on American cars that don’t conform to Korean standards which could imported into that country. The ceiling increase was meaningless because US automakers were not selling enough cars under the old ceiling. In other words, the KORUS free trade deal was a smoke and mirrors exercise and a face saving out of a potential trade war.
The NAFTA negotiations followed a similar pattern of using bluffs as a tactic, and reacting afterwards. Trump began the process by declaring the free trade agreement “unfair” and “terrible”. He then threatened to tear up the treaty. The latest news from Bloomberg indicates that American negotiators are pushing very hard to have an agreement in principle in place by the Peru Summit of the Americas that begin April 13 next week. How much leverage will the American side have if the other negotiators know that Trump wants a deal by next week? Much work needs to be done before an agreement in principle can be made, but watch for more climbdowns and a declaration of “victory” by the White House.
So why worry about a possible trade war with China? Investors worried about equity downside risk should instead focus on the likely direction of monetary policy. New Deal democrat recently outlined a simple recession model which states that whenever the YoY change in the Fed Funds rate rose above the annual change to employment, a recession has followed within a year.
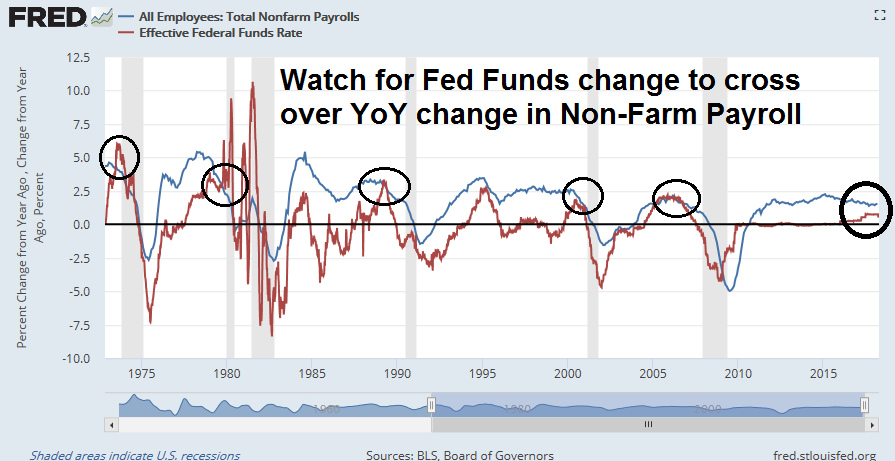
As the Fed normalizes monetary policy, it is on the verge of making a policy error where it tightens into a weakening expansion and crashes the economy. Recessions have invariably translated into equity bear markets in the past. That’s why investors should look past the trade war noise and focus on monetary policy.
Trade war: Strong offense but weak defense
In the wake of last week’s news of China’s retaliatory tariffs, and Trump’s response to consider an additional $100 billion in tariffs on Chinese goods, there has been no shortage of analysis of the relative positions of both sides. The best summary comes from the Washington Post, which correctly characterized the US as having the upper hand on trade (offense), but China having the upper hand on political resilience (defense):
China has more to lose economically in an all-out trade war. The Chinese economy is dependent on exports, and nearly 20 percent of its exports go to the United States. It sold $506 billion in stuff and services to the United States last year. In contrast, the United States sold $130 billion to the Chinese.
“In a serious economic battle, the U.S. wins. There is no question about it,” said Derek Scissors, a resident scholar at the American Enterprise Institute who has helped advise the administration on China.
But this isn’t just an economic fight, it’s also political, and there’s a strong case that President Trump would be less able to sustain a protracted conflict than the Chinese — especially with the 2018 midterm elections coming.
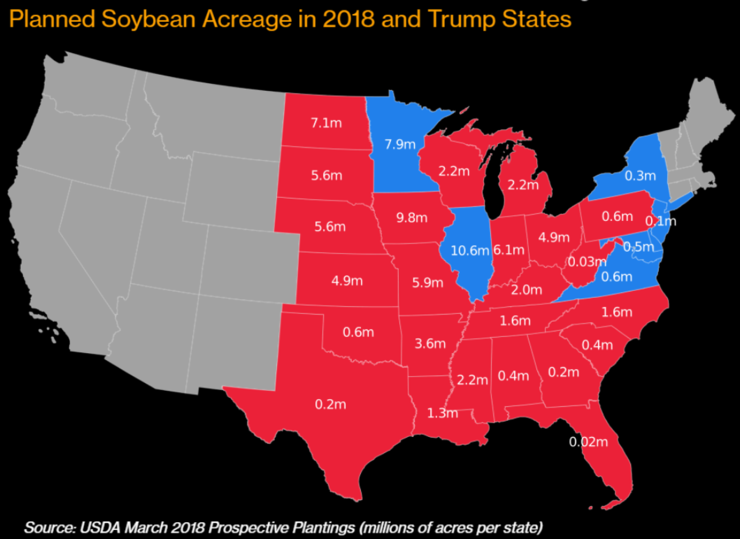
The following chart depicts US soybean production, which is a major target of Chinese retaliation. Of the 10 biggest soybean producing states, Trump won eight in the last election. A full-blown trade war will impose serious electoral pain upon the Republican Party in the upcoming midterms.
By contrast, Beijing has the financial and political capacity to to keep their economy afloat until November.

Moreover, the past leadership of the Chinese Communist Party showed it was capable of starving millions of its own citizens in order to achieve their political objectives. Xi Jinping’s “president for life” status is a signal that he has the political capital and sufficient control of the political apparatus that the Chinese economy could sustain a high level of suffering. Now imagine how a similar level of pain would play out in battleground states such as Iowa, Ohio, and Wisconsin.
The WSJ reported that Trump’s new economic advisor Larry Kudlow walked back some of the Apocalyptic tone of the trade rhetoric:
There’s no trade war here. What you’ve got is the early stages of a process that will include tariffs, comments on the tariffs, then ultimate decisions and negotiations. There’s already backchannel talks going on.
Undoubtedly there are lots of backchannel discussions to find a face saving solution for both sides. Relax, and buy the trade war panic.
A focus on monetary policy
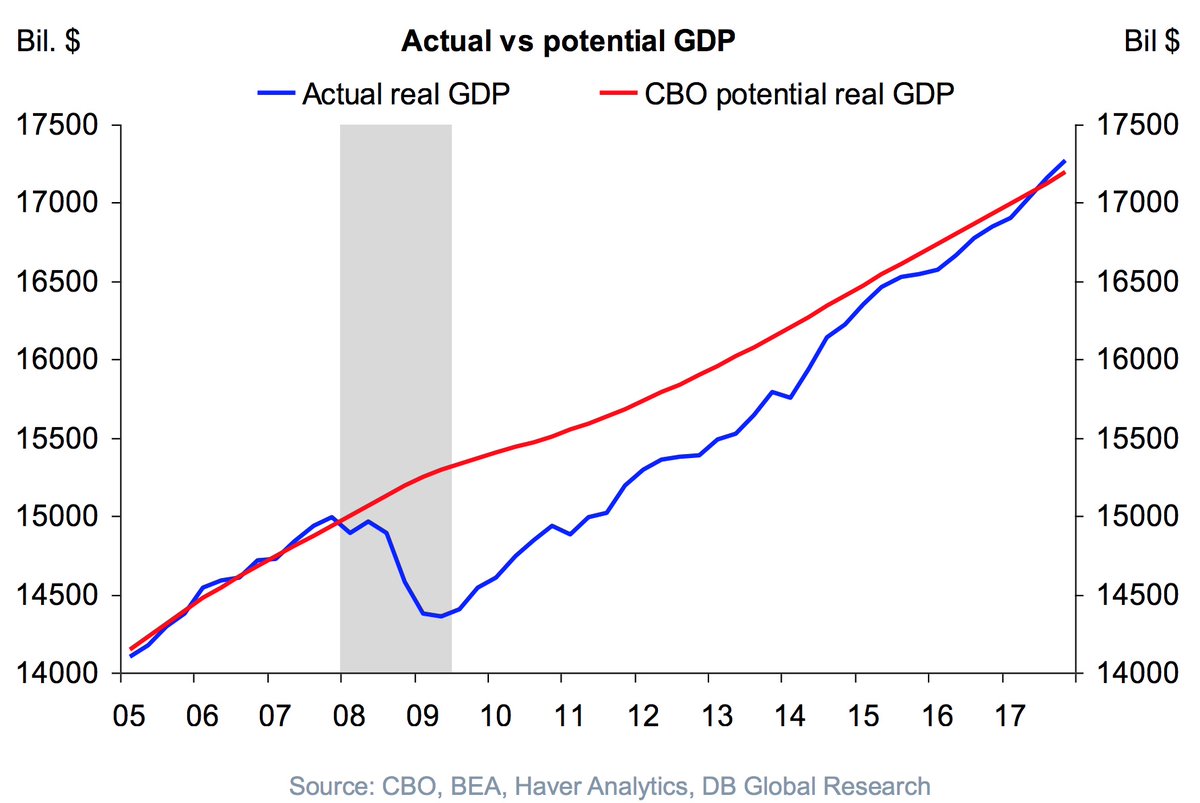
Instead, the real risk that equity investors face is monetary policy. The economy is at capacity and starting to run “hot”. The questions for equity investors is how quickly the Fed tightens, and what effect will that have on profits, growth, and P/E multiples.
In the wake of the surprisingly weak March Jobs Report, Fed chair Jay Powell gave a speech last Friday with a dovish tone to signal three rate hikes in 2018. By contrast, Reuters reported that former Fed chair Janet Yellen gave a far more cautious message to investors in a speech to Jefferies clients indicating that the growth and inflation risks are tilted to the upside:
Monday’s larger forum for Jefferies clients, she expressed the view that three or four rate rises were likely this year, and that recent U.S. tax cuts and a boost in government spending posed at least some risk of running the economy hot, according to the first source, who requested anonymity.
Jamie Dimon also sounded a similar cautionary tone on the future path of interest rates in his annual message to JPM shareholders:
Since QE has never been done on this scale and we don’t completely know the myriad effects it has had on asset prices, confidence, capital expenditures and other factors, we cannot possibly know all of the effects of its reversal. We have to deal with the possibility that at one point, the Federal Reserve and other central banks may have to take more drastic action than they currently anticipate — reacting to the markets, not guiding the markets. A simple scenario under which this could happen is if inflation and wages grow more than people expect. I believe that many people underestimate the possibility of higher inflation and wages, which means they might be underestimating the chance that the Federal Reserve may have to raise rates faster than we all think. While in the past, interest rates have been lower and for longer than people expected, they may go higher and faster than people expect.
He continued:
It would be a reasonable expectation that with normal growth and inflation approaching 2%, the 10-year bond could or should be trading at around 4%. And the short end should be trading at around 2½% (these would be fairly normal historical experiences). And this is still a little lower than the Fed is forecasting under these conditions. It is also a reasonable explanation (and one that many economists believe) that today’s rates of the 10-year bond trading below 3% are due to the large purchases of U.S. debt by the Federal Reserve (and others).
A more hawkish Fed? A 4% 10-year Treasury yield? Yikes!
The impact of tight monetary policy
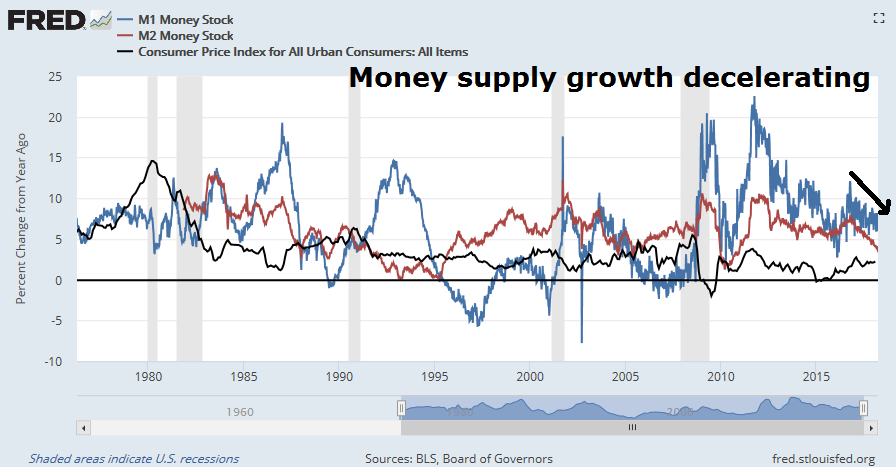
Here is what is at stake. As the Fed normalizes monetary policy, money supply growth tends to slow. Historically, whenever real money supply growth, whether M1 or M2, goes negative, a recession has followed. At the current pace of deceleration, real M2 growth is likely to flash a recession signal by Q4 2018.
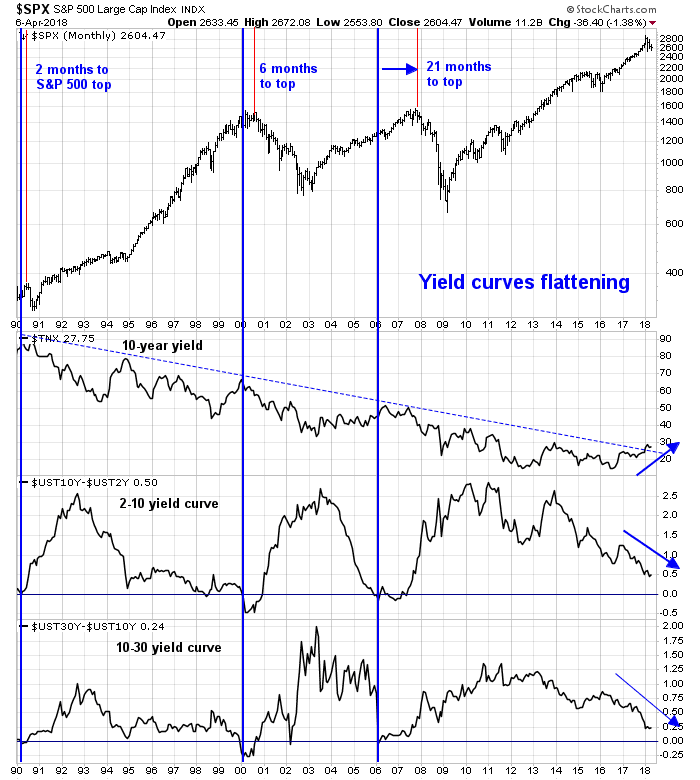
One consequence of monetary tightening can be seen in the evolution of the yield curves. Both the 2-10 and 10-30 yield curves are flattening. A further two quarter-point rate hikes are likely to result in inversions. While there was a long lag between the yield curve inversion and equity market top in the 2007, the previous two cycles saw the market top out between 2-6 months after the event.
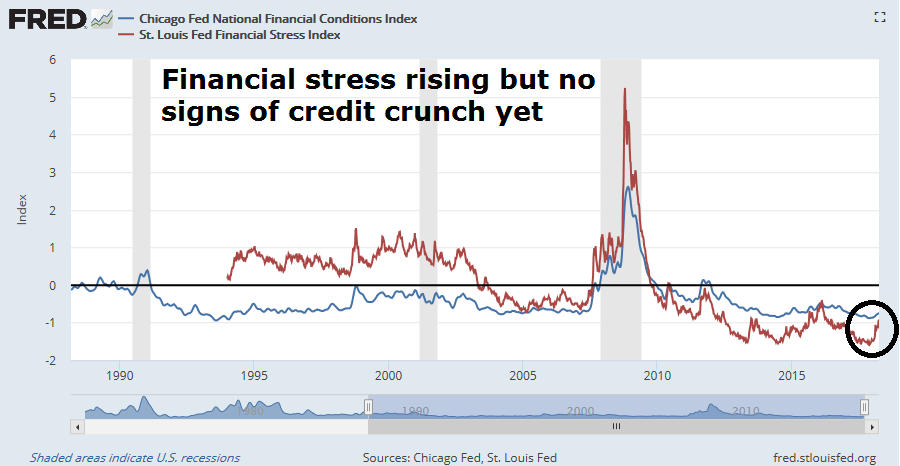
We can also see the effects of tighter monetary policy in the financial condition indices. Financial stress is starting to rise, but there are no signs of a credit crunch yet.
Goldilocks is still in the house
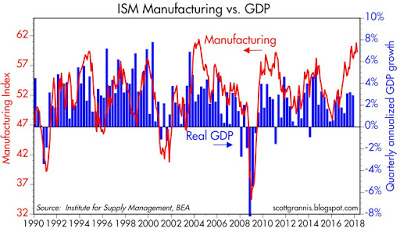
For now, not-too-hot and not-too-cold Goldilocks conditions are still prevalent. Scott Grannis pointed out that buoyant ISM Manufacturing readings are indicative of better GDP growth.
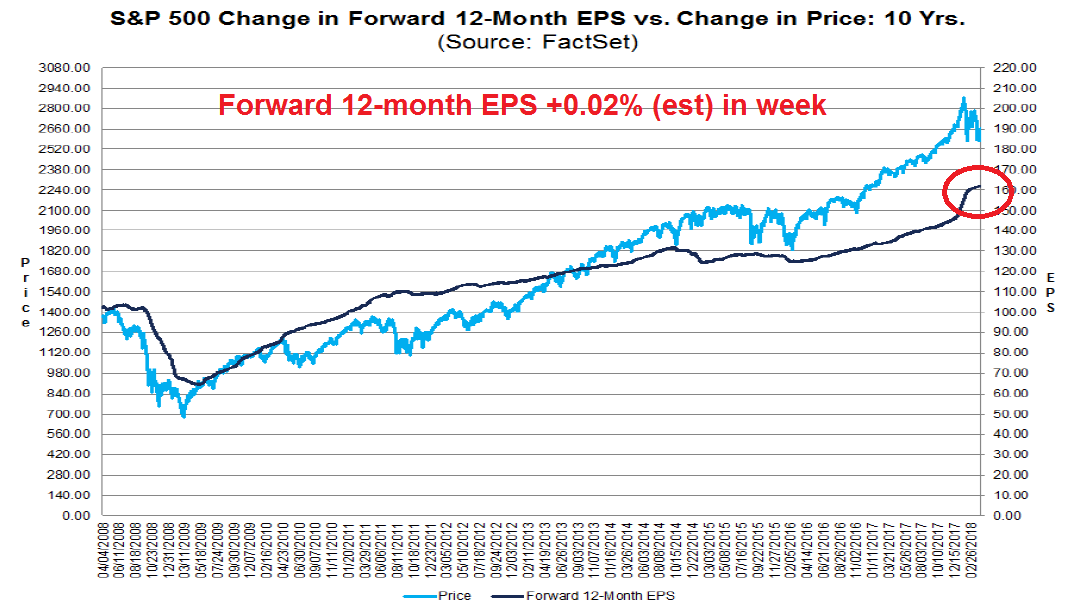
The latest update of EPS estimates from FactSet shows that forward EPS continuing to rise, which is indicative of fundamental momentum ahead of Q1 earnings season. Moreover, FactSet reported that a record number of companies are issuing positive Q1 earnings guidance, which is also bullish.
The upbeat assessment is not just confined to US equities. Ed Yardeni observed that forward revenues are rising globally.
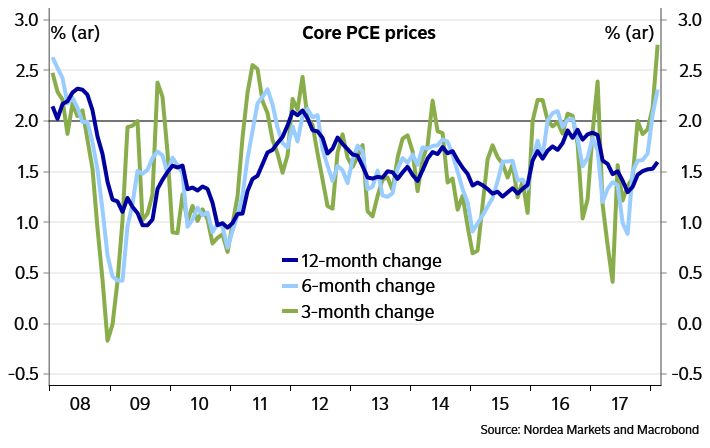
To be sure, core PCE is showing strong upward momentum. It is only a matter of time before the Fed turns more hawkish.
More worrisome for equity investors was Fed governor Lael Brainard’s speech on financial stability last week, which signaled the fading of a Powell Put. Brainard stated that monetary policy should not be the tool to achieve financial stability:
The primary focus of financial stability policy is tail risk (outcomes that are unlikely but severely damaging) as opposed to the modal outlook (the most likely path of the economy). The objective of financial stability policy is to lessen the likelihood and severity of a financial crisis. Guided by that objective, our financial stability work rests on four interdependent pillars: systematic analysis of financial vulnerabilities; standard prudential policies that safeguard the safety and soundness of individual banking organizations; additional policies, which I will refer to as “macroprudential,” that build resilience in the large, interconnected institutions at the core of the system; and countercyclical policies that increase resilience as risks build up cyclically.
In other words, don’t count on monetary policy to ride to the rescue should the markets fall apart.
Echoes of 2011
Looking ahead to the remainder of April, the market backdrop is reminiscent of the summer of 2011. The political environment was highly uncertain, and dominated by frequent eurozone summits, where participants were planning to have a plan to solve the Greek Crisis. At the same time, stock prices were volatile but stopped reacting to bad news, Equities were range-bound while flashing frequent oversold readings, as measured by my Trifecta Bottom Spotting Model, and Zweig Breadth Thrust oversold conditions. The market eventually broke up out of the range when the European Central Bank stepped in with their LTRO cheap loan scheme to re-liquify the banking system.

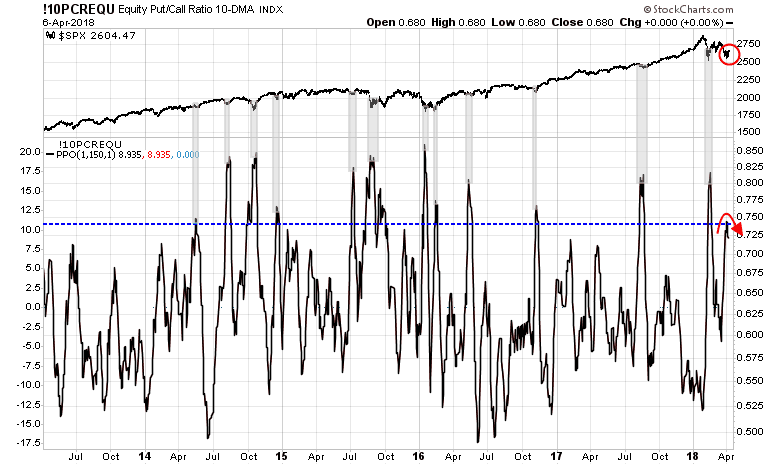
We are seeing a similar level of washed out sentiment today. The normalized equity-only put/call ratio is showing a constructive mean reversion from a crowded short reading. If history is any guide, such episodes have indicated favorable risk/reward ratio, with low downside risk.
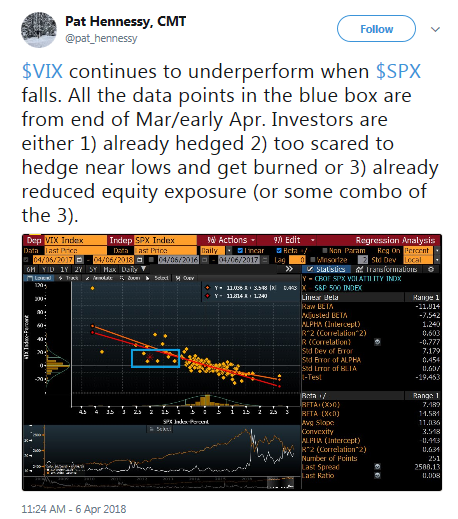
Technical analyst Pat Hennessy also observed a similar case of bearish exhaustion. The VIX Index is underperforming even when stock prices fall, indicating that implied volatility is also not responding to bad news.
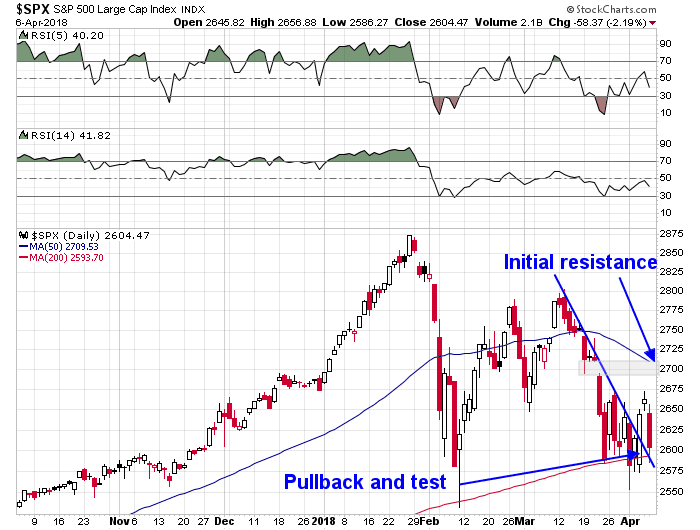
The SPX appears to have found its footing at its 200 dma. The bears have been unable to push prices below the 200 dma support level despite the bad news on the trade front. The SPX staged an upside breakout through a downtrend last week, and Friday’s weakness saw the index retreat back to test the downtrend line. Initial upside resistance can be found at the 50 dma level, which also coincides with the gap located at about the 2700 level.
Insider activity also added another intermediate term bullish signal to stock prices. Open Insider data flashed a buy signal in late March as insider selling (red line) dried up and briefly fell below the level of insider buying (blue line).
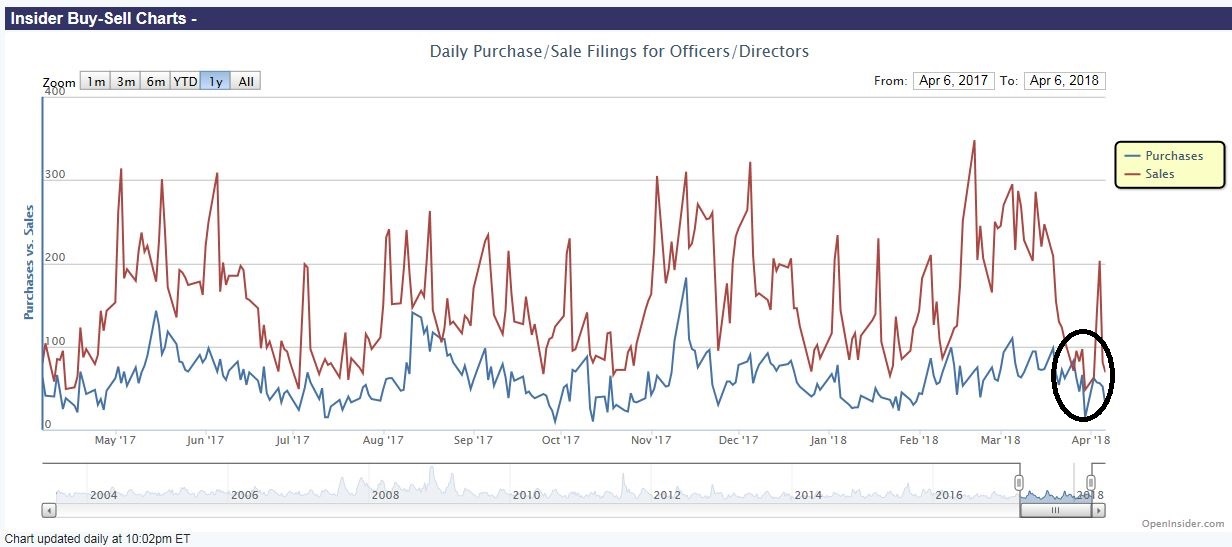
The signals from this group of “smart investors” are not infallible, but if history is any guide, downside risk is limited at current levels.

My inner investor remains constructive on the equity outlook for the next few months. My inner trader is also bullishly positioned, and he believes that the risk/reward ratio favors the bulls over the bears.
Disclosure: Long SPXL
I have been doing some original work on Tactical Factor Allocation. I’ve discovered the predictable rotation of factors (Small Company, Momentum, Value, Growth and I’ve added Long/Short Momentum) throughout the stock market cycles. It has just signaled the bear market has likely begun.
To find a standard rotation in historical bull markets, one must have an accurate method of marking the end of the previous bear market and the start of the new bull market. Longer term readers will remember that in early 2016, I was saying that a brand new bull market had started. That has since been proven. I declared that because of my factor research. Since then, the various factors have gone through their normal rotation.
The following chart shows that Momentum Factor represented by MTUM ETF has ended its rotation. Momentum is the last factor in a bull market rotation. The next phase is the bear market where Long/Short Momentum outperforms. It is best to the bottom of the bear market.
https://product.datastream.com/dscharting/gateway.aspx?guid=8f61a401-15bf-4864-ba34-f60dff4eef5f&action=REFRESH
The chart shows the Long/Short ETF has clearly started to outperform the general U.S. market. I use a 200 day moving average of the ratio as a measuring tool. This was a good signalling method back in 2015. Versus MTUM, it has just started to outperform. This signal has come later because Momentum ETF MTUM has been outperforming the general market. As I said, Momentum is the last factor in the bull market rotation.
One thing is missing from a full call that a bear market has started. There should be signs of economic distress when the signal happens. Back in 2015, high yield debt spreads were blowing out and corporate profits were down. I’ve been watching high yield spreads and although they have widened a bit, there is no evidence of corporate distress. Plus, corporate profits are very strong due to the tax cuts. So, am I disregarding the signal until signs of economic problems show up? In a word, No.
I’ve gone from cautiously positioned to very cautiously positioned (much lower equity allocation) in client portfolios. Next stage would be bear market positioned (very hedged).
Why might this signal without financial distress be valid? Economic heavyweights, Robert Shiller and David Rosenberg (who was voted best economist in the world at Merrill Lynch for his bear call in 2007-8) have both said that the tax cuts are masking deteriorating economic condition underneath.
Second, I’m concerned that forward market indicators that have worked in the past to signal a peak ahead may be late this cycle. These are the tools that Cam is showing above that have worked so well in giving 3-6 month warnings of a market peak. These indicators have been wonderful in the past to let knowledgeable experts milk that last bit of a bull market before it goes over a cliff. The reason they may be misleading this time, is that A.I. and deep analysis of these and countless other indicators is being done by organizations with hundreds of billions of dollars assets. This cycle, these expert systems I believe are being trusted and used. The last years unusual and absurdly low volatility might be the subtle sign that these algorithms are at work. If the A.I. is computing future anti-QE, plus higher rates, plus this and plus that and coming up with a lower stock market in the future and started to shift out of stocks, well the bear might be upon us now rather than later.
Hell, maybe it won’t be A.I. machines that take action sooner, it may be portfolio managers who last cycle were caught in a buy-and-hold mode in the 2008 crash (that was the Buffett portfolio manager style in 2007). Now they may be more tactical and may be shifting early given, as Cam points out, these previously leading indicators are heading for crossover signal points soon.
Ask yourself, if you managed billions and you see your trusted leading indicators are soon going to cross from positive to negative plus you have the uncertainty of Trump and also big question marks about Fed unwinding, wouldn’t you start getting out sooner?
Ken, of course it’s better to be early. Until you’re the shmuck who missed the last 10-20% of a bull market.
Very true, Martin.
I have a quote taped to my computer monitor that reads, “Until you’re prepared to look foolish, you’ll never have the possibility of being great.”
I stuck my neck out in early 2016, taking a strong stand that we were in a brand new bull market when almost everyone said we were in the final innings of a seven year bull market that was about to die.
I realize I might look like a shmuck by saying we’ve likely seen the top of this bull market and it drives on to greater heights.
By the way, I’m saying “likely”, hell make that “very likely” for the S&P 500 but I’ll go on record as saying the Canadian stock market has definitely peaked. I don’t want to be one of those “on the one hand this and the other hand that” guys.
These are important stances for my business since I’ll get fired by clients if I turn out to be a “shmuck.”
I’ve got my fingers crossed.
BTW That quote is from Cher!
Ken,
Question: when you sell off your clients equities to protect them from a down market, they presumably get a tax bill. I know I would. How do you know it will net out better in the end for your clients to take the tax hit vs. waiting out the decline?