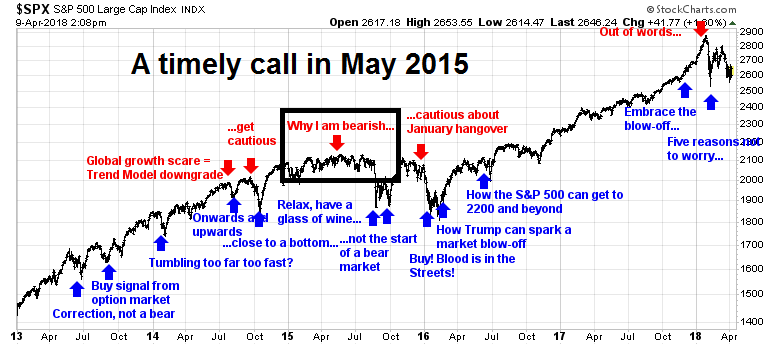
I have been a fan of Jim Paulsen for quite some time. The chart below depicts the track record of my major market calls. His work formed the basis for my timely post in May 2015 (see Why I am bearish (and what would change my mind)), which was received with great skepticism at the time.
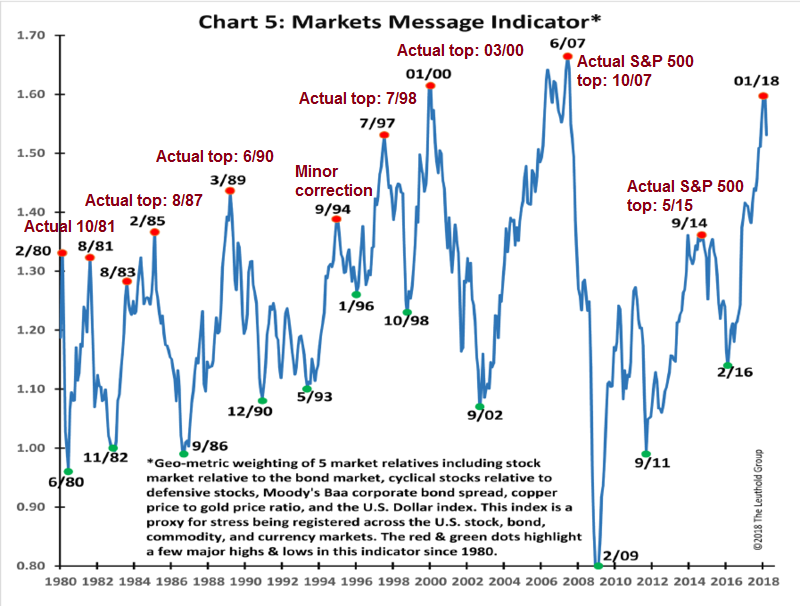
This time, though, I believe that Jim Paulsen’s warning for the equity market outlined in this Bloomberg article is off the mark. Paulsen’s cautionary signal for the stock market is based on his Market Message Indicator, which has rolled over. The indicator is described in the following way:
The gauge takes five different data points into account: how the stock market is performing relative to the bond market, cyclical stocks relative to defensive stocks, corporate bond spreads, the copper-to-gold price ratio, and a U.S. dollar index. The goal is to devise a gauge that acts as a proxy for broad market stress.
I have annotated (in red) in the chart below the subsequent peak in the stock market after this indicator gave a sell signal. This indicator is far from infallible, but the market has weakened the last few times this indicator peaked and rolled over. During the study period that begins in 1980, some sell signals simply did not work, or there were long delays between the sell signal and the actual peak.
Here is what I think Paulsen is missing.
A cyclical and stress indicator
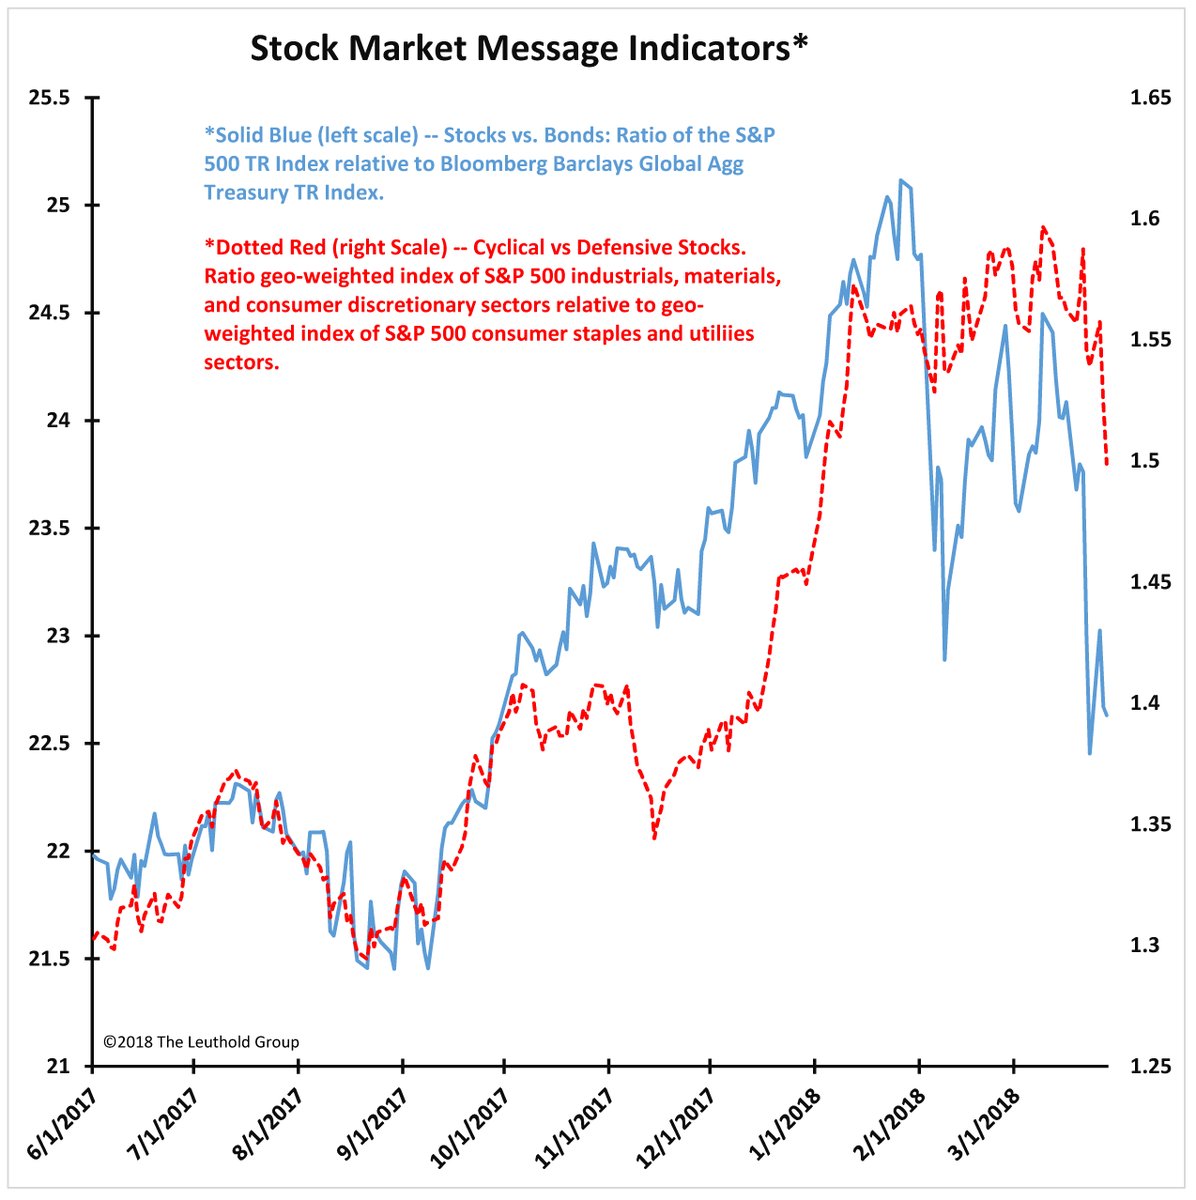
The Market Message Indicator uses five components to time stock prices, namely the stock/bond ratio, cyclical/defensive stock ratio, corporate bond spreads, copper/gold ratio, and the USD. These components mainly measure cyclical strength and stress.
While these components capture economic and global cyclicality well, they don’t tell the entire story of the risks facing stock prices.
Consider, for example, the copper/gold ratio as a way of measuring global cyclicality. The copper/gold ratio is a useful metric of the global cycle. Copper has both inflation hedge and hard asset qualities and cyclical qualities, while gold is mainly an inflation hedge. A rising copper/gold ratio can be an indication of global growth acceleration, while the reverse is a signal of growth deceleration.
The following chart shows that the copper/gold ratio is more useful as an asset allocation indicator than a stock market timing indicator. Gold/copper is more correlated to the stock/bond ratio (grey bars, top panel) than the stock market (bottom panel). In fact, there have been three separate episodes where both the copper/gold ratio and stock/bond ratio fell, indicating that bonds outperformed stocks, but stock prices did not fall.

The same remarks are applicable to the other components of the Market Message Indicator.
What Paulsen is capturing
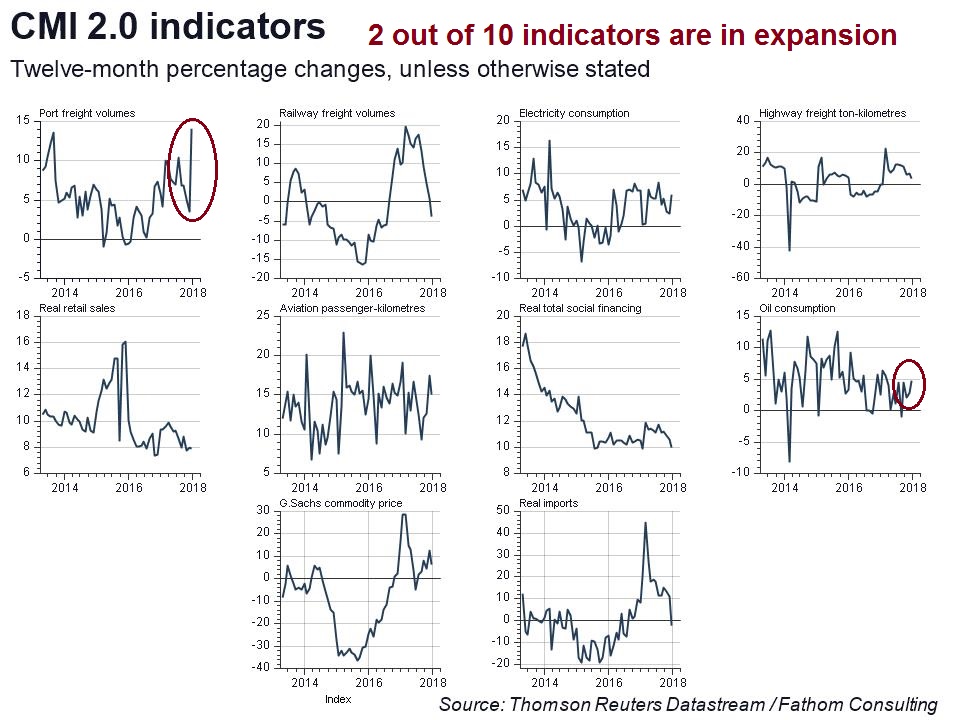
I believe that much of the cyclical slowdown captured by the Market Message Indicator can be attributable to a deceleration of Chinese growth. Only 2 out of 10 of the Fathom CMI indicators of Chinese growth are in expansion mode, the rest are either falling or rolling over.
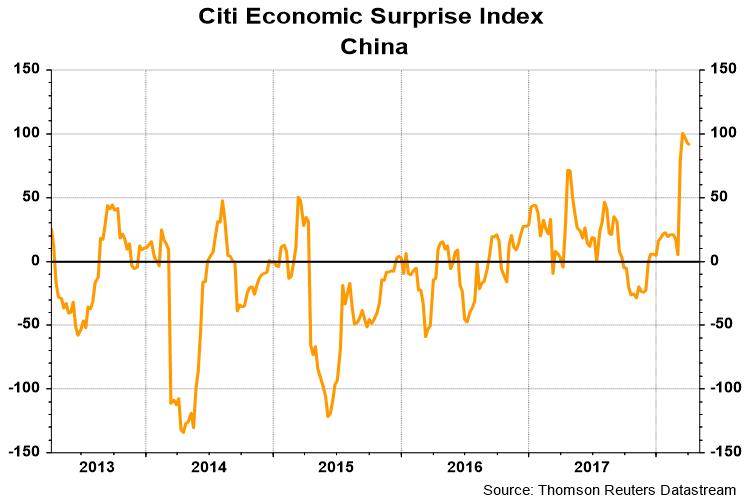
The Citigroup China Economic Surprise Index, which measures whether high frequency economic indicators are beating or missing expectations, is rolling over from a very high level.
A series of macro data disappointments in Europe may have also contributed to anxieties about a global slowdown.

By contrast, US ESI is holding up well at elevated levels.

Incipient fears about non-US cyclical weakness may be sufficient to cause a correction in US equities, but are they enough to spark a bear market?
What Paulsen is missing
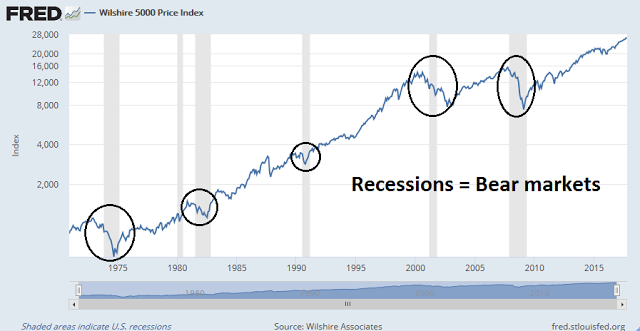
The answer is no. Sustained bear markets are usually caused by recessions. Even though my Recession Watch long leading indicators are showing some signs of weakness, the immediate risk of a recession is still quite low.
The one missing ingredient for a recession is an overly aggressive monetary policy that tightens a fragile and weakening economy into a slowdown. That is why I emphasized the focus on monetary policy in my post yesterday (see Watch the Fed, not the trade war noise).
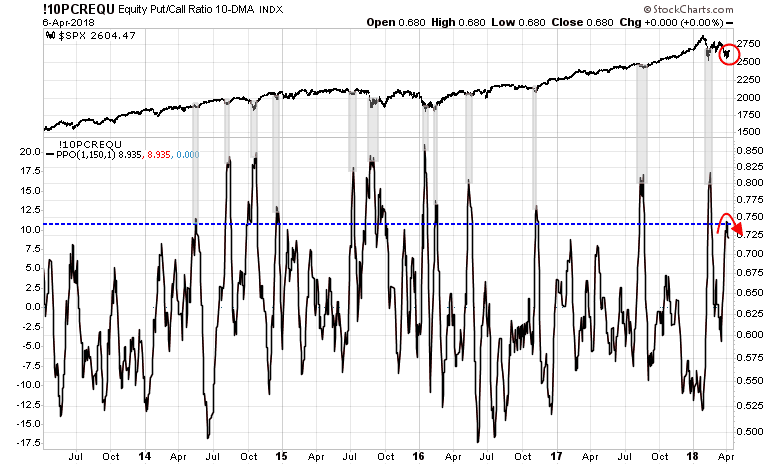
Further, I also observed in yesterday’s post that the stock market appeared to be starting to ignore bad news. Sentiment models are flashing crowded short readings, which is an indication that downside risk may be limited. I highlighted this normalized equity-only put/call ratio, which reached an overly pessimistic level and started to roll over, which is usually interpreted as a buy signal.
In short, Paulsen’s model has identified nascent cyclical weakness. As stock prices have pulled back from their January highs, the downside risk highlighted by his model may have already happened, and sentiment models are already overly bearish, indicating low downside risk.
The correction has already happened. It may be too late to sell.
To play devil’s advocate, wouldn’t a chinese recession take quite a bite out of US equities? (And most other global assets.) And how long ago did the chinese yield curve invert again..?
William
A Chinese slow down would hit resource based economies (Australia, Canada, NZ, some of the South American economies (Copper, oil and other commodity exporters), classically. China only imports 100 Billion $ give or take worth of goods from the US. Slow down in 100 Billion $ worth of trade is not likely to affect the US by much.
Personally I don’t think the US or China can have a recession without serious knock on effects throughout the world. A chinese recession would at a minimum probably cause recessions in canada, australia, and most of europe and latam. It’s possible the US could come out unscathed (just lower asset prices as the rest of the world dumps assets for cash), but seems unlikely to me. The world is just too interconnected now.
Ken… I have a question for you which I added to the previous post. Thanks. A
Canadians are taxed at 50% of the person’s normal rate. We don’t have long and short term capital gain taxes. This means taxes are less of an issue.
We also have generous tax sheltered retirement and savings plans that make trading tax free.
If you have a large tax to pay if you sell a given stock, you may rather hedge it with puts or write calls. You could also use inverse ETFs.
To be clear capital gains are taxed at 50% of a person’s normal rate.
I’ve seen clients avoid taxes by not selling and incur massive losses. One of them had their company taken over by Encana for stock. The value has fallen from $30 million to $12 million now and was $5 million at the low in 2016. Should have sold and paid the tax.
Hi Ken,
Yes. I’m Canadian too. I just live a few hundred miles down the street (Highway 1) from you! I guess I have to learn about puts and calls. Any good links to share for a novice?
I still find it hugely expensive tax-wise to sell off equities if no bear market materializes. I’m guessing you sell off percentages of your clients’ equities as you feel the risk of a major bear market rising. Is there a formula you use?
My advisor, who I like, is really buy-and-hold. They all are. He never talks to me about puts and calls. Or about timing. It’s always a struggle to convince him the let go of stocks near the top. But I know he’s there to balance my more impulsive instincts and as a sounding board for what I learn here.