Over the years, I have had a number of discussions with traders who have religiously embraced specific trading systems and investment disciplines. This is a cautionary tale of how systems fail.
Charlie Bilello won the NAAIM Wagner Award for his work on the lumber/gold ratio:
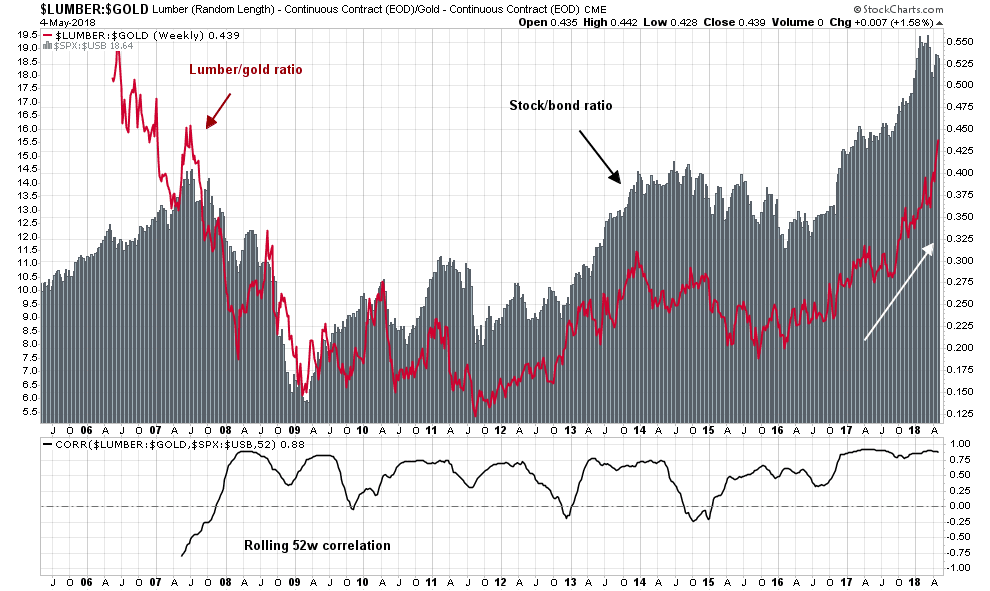
Lumber’s sensitivity to housing, a key source of domestic economic growth in the U.S., makes it a unique commodity as it pertains to macro fundamentals and risk-seeking behavior. On the opposite end of the spectrum is Gold, which is distinctive in that it historically exhibits safe-haven properties during periods of heightened volatility and stock market stress.
When you look at a ratio of Lumber to Gold, it is telling you something about the risk appetite of investors and the relative strength or weakness in economic conditions. When Lumber is leading Gold, volatility in equities tends to fall going forward. When Gold is leading Lumber, the opposite is true, and equity volatility tends to rise.
History shows that the lumber/gold ratio has been an excellent indicator of risk appetite. The bottom panel of the accompanying chart shows the rolling correlation of the lumber/gold ratio (cyclical indicator) to the stock/bond ratio (risk appetite indicator). The lumber/gold ratio is rising, which is a buy signal for risky assets.
Does that mean that you should bullish on stocks? Maybe.
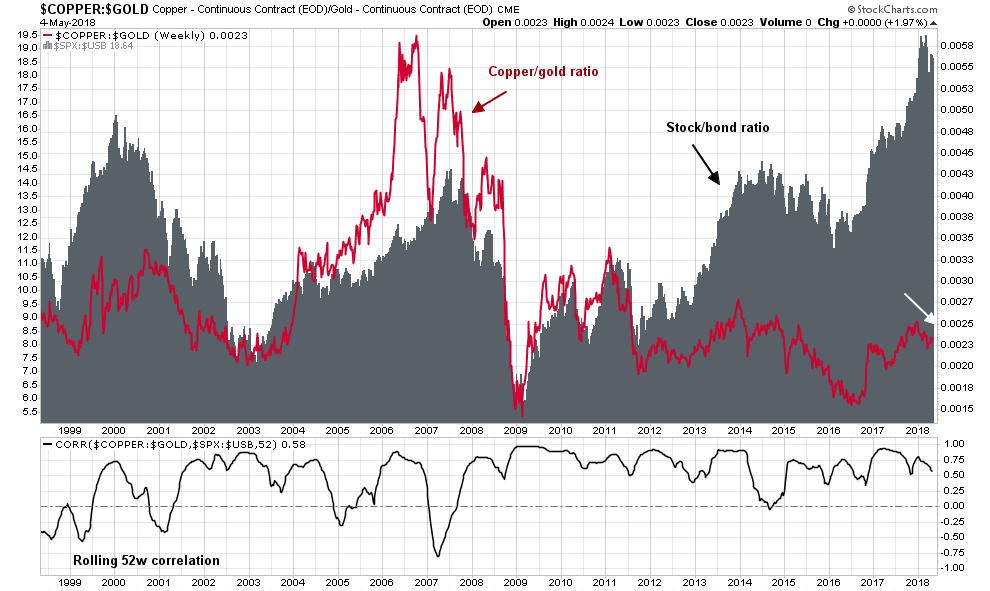
Consider the copper/gold ratio, which is another cyclical indicator based on a similar theme. The copper/gold ratio is telling a story of economic softness.
Should you be buying or selling? Which indicator should you believe?
Analyzing the indicators
I have long been an advocate of understanding the assumptions behind indicators and models. Let’s analyze the lumber/gold indicator and unpack its message. The lumber price being measured is an American lumber price that is affected by local conditions. Lumber prices started to take off when the US imposed tariffs on Canadian softwood lumber as part of a long running dispute between the two countries. Over time, homebuilding stocks have weakened relative to the market and breached a long term relative support level. Does the behavior of the homebuilders look like a sign of cyclical strength?

While lumber prices constitute a useful cyclical indicator because of it is mainly an input into housing, the housing sector has specific demographic characteristics that could affect its effectiveness. This chart shows prime age population demographics, and its correlation to housing starts.

Copper as China indicator
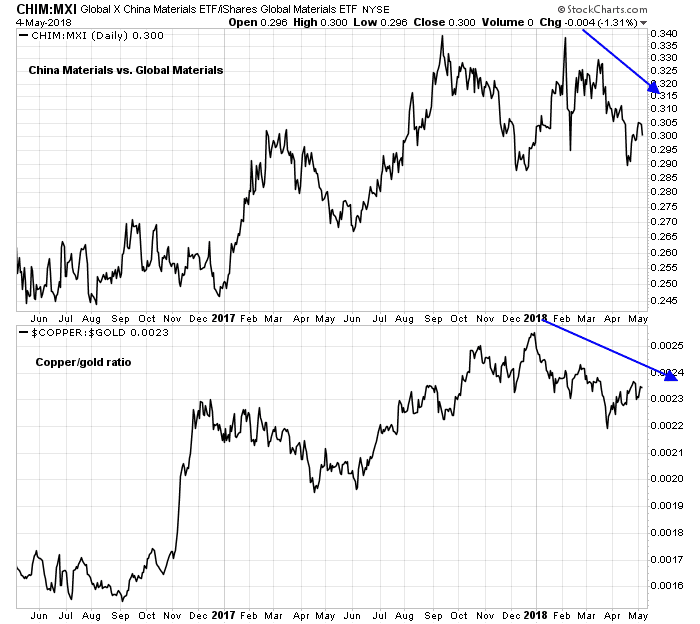
Copper has its own idiosyncrasies too. Long before China became the dominant global growth engine, copper was regarded as a good indicator of global cyclicality. Now that China has become the largest consumer of commodities, copper prices are reflective of Chinese economic activity. The chart below shows the ratio of China Materials ETF (CHIM) to Global Materials (MXI) in the top panel, and the copper/gold ratio in the bottom panel. The coincident weaknesses of the CHIM/MXI and copper/gold ratios are probably reflective of softness in China.
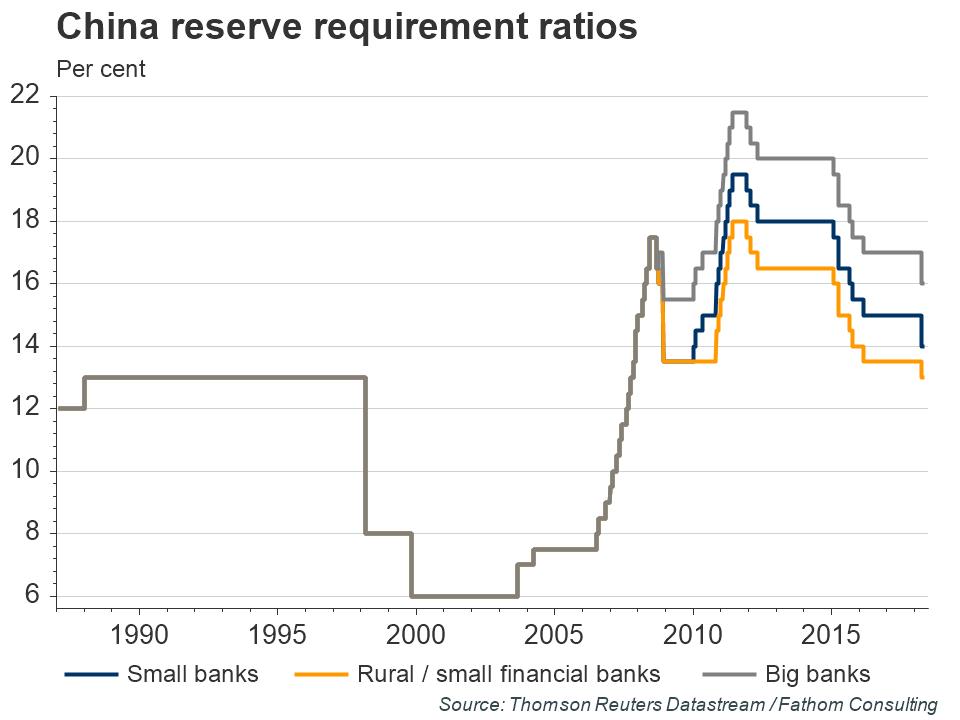
Slowing Chinese growth is also reflected in Beijing’s policy response to lower bank reserve ratios.
KOSPI: The global cyclical barometer
In addition to copper and lumber, the South Korean stock market has been regarded as a global cyclical barometer because of the significant weight of electronics giant Samsung in the KOSPI index. Moreover, the weight of Samsung`s suppliers in the Korean KOSPI index only serves to raise the weight of the “Samsung factor” to about half of the index.
The chart below shows the KOSPI (top panel), along with the relative returns of South Korean stock market to MSCI All-Country World Index, or ACWI, (second panel, all returns in USD), the copper/gold ratio (third panel), and the lumber/gold ratio (fourth and bottom panel). One of these indicators is definitely not like the other.

I began this post with the rhetorical question of which indicator investors should believe, the lumber/gold ratio or the copper/gold ratio? An analysis of the two ratios, as well as the Korea/ACWI ratio, shows that the bullish cyclical conclusion of the lumber/gold ratio as the outlier. The lumber/gold ratio has been affected by specific factors relating to US building materials market.
Further analysis of the Korea/ACWI ratio and the copper/gold ratio also reveals some differences. Both the Korea/ACWI and copper/gold ratios have been range bound for the last year. However, while Korea/ACWI has been trendless, copper/gold has entered a minor downtrend, but recovered in the last month. I interpret these conditions as copper/gold signaling some softness in the Chinese economy, but the global cycle Korea/ACWI remains trendless. Neither is signaling weakness that could lead to a recession.
The moral of this story? Models and indicators are not magic black boxes. Look under the hood before you make any investment conclusions.