Preface: Explaining our market timing models
We maintain several market timing models, each with differing time horizons. The “Ultimate Market Timing Model” is a long-term market timing model based on the research outlined in our post, Building the ultimate market timing model. This model tends to generate only a handful of signals each decade.
The Trend Model is an asset allocation model which applies trend following principles based on the inputs of global stock and commodity price. This model has a shorter time horizon and tends to turn over about 4-6 times a year. In essence, it seeks to answer the question, “Is the trend in the global economy expansion (bullish) or contraction (bearish)?”
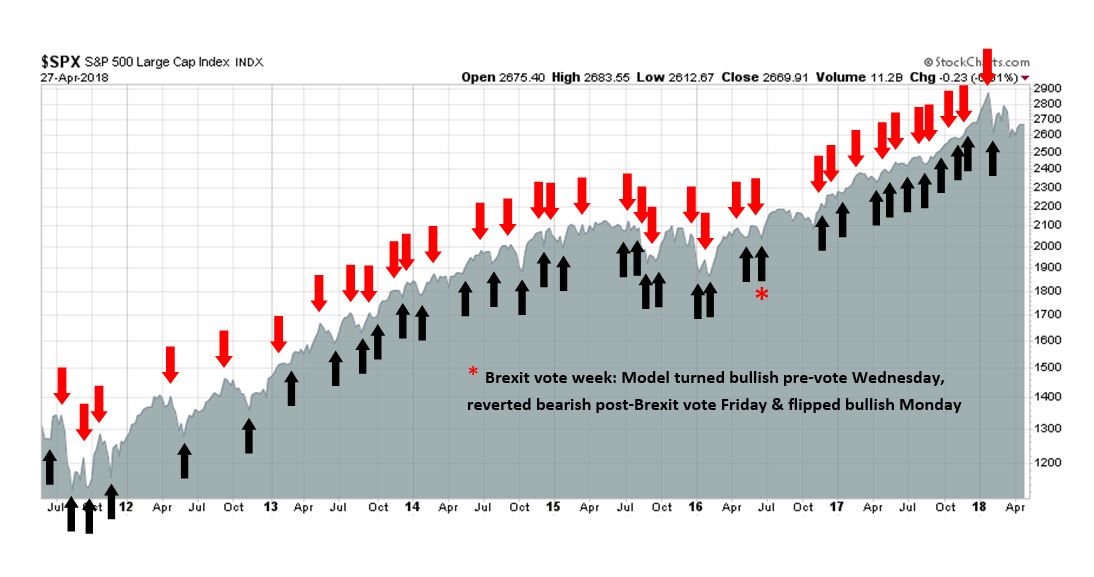
My inner trader uses the trading component of the Trend Model to look for changes in the direction of the main Trend Model signal. A bullish Trend Model signal that gets less bullish is a trading “sell” signal. Conversely, a bearish Trend Model signal that gets less bearish is a trading “buy” signal. The history of actual out-of-sample (not backtested) signals of the trading model are shown by the arrows in the chart below. The turnover rate of the trading model is high, and it has varied between 150% to 200% per month.
Subscribers receive real-time alerts of model changes, and a hypothetical trading record of the those email alerts are updated weekly here.
The latest signals of each model are as follows:
- Ultimate market timing model: Buy equities
- Trend Model signal: Bullish
- Trading model: Bullish
Update schedule: I generally update model readings on my site on weekends and tweet mid-week observations at @humblestudent. Subscribers receive real-time alerts of trading model changes, and a hypothetical trading record of the those email alerts is shown here.
The 3% question
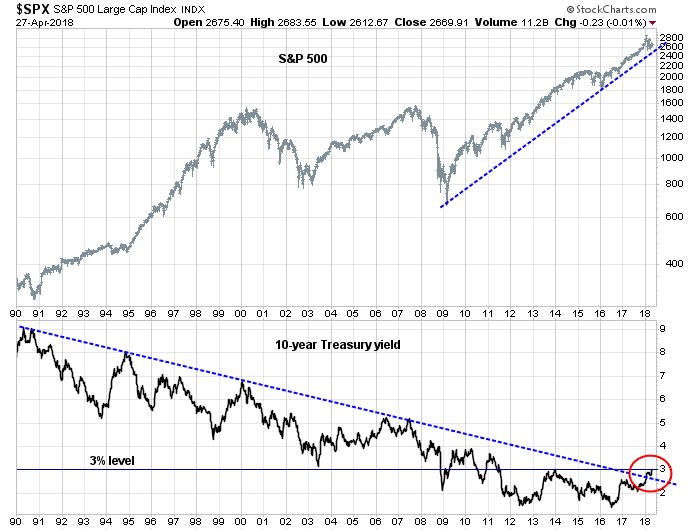
The US equity market took fright last week when the 10-year Treasury yield rose above 3%. Stock prices recovered when yields retreated. How much should equity investors worry about a 3% 10-year yield?
Rather than focus on any single level, investors would be advised to concentrate on the interaction between stocks and bonds. Consider the P/E ratio. The factors that drive equity prices are:
- How fast is the E in the P/E ratio likely to grow?
- What is the outlook for interest rates and how does it affect the E/P ratio?
It’s really that simple.
The history of rates and stock prices
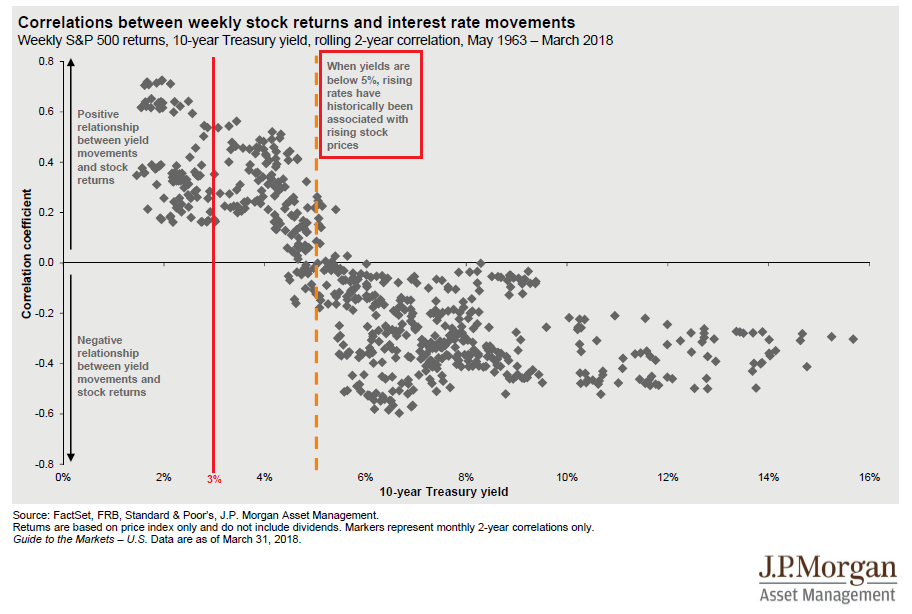
When the stock market sold off last week, I pointed to the historical analysis from JPM Asset Management that “when yields are below 5%, rising rates have historically been associated with rising stock prices” (see Is good news now good news, or bad news?)
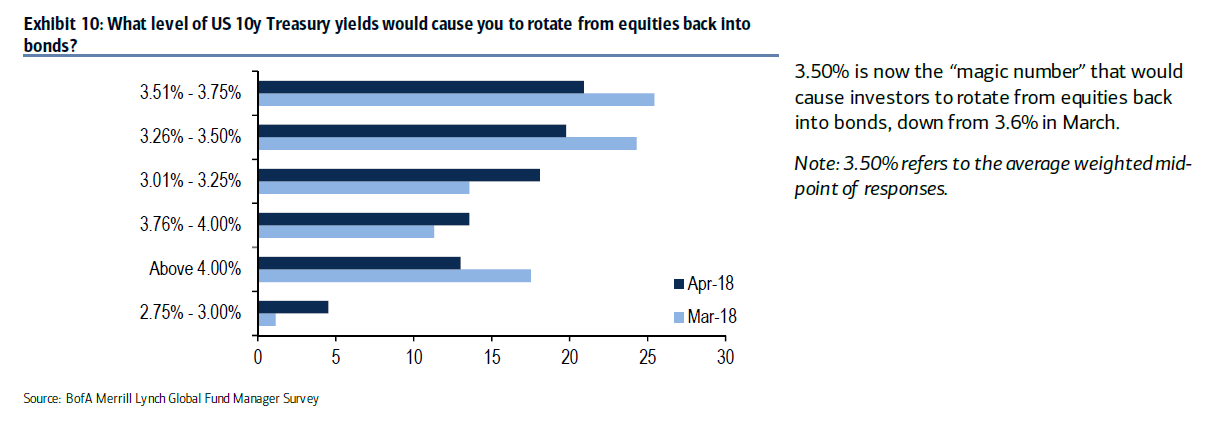
I also referred to the BAML Fund Manager Survey which indicated that fund managers were not overly worried about equities until yields approached 3.5%.
Those are all simplistic explanations that relate to valuation, but they don’t matter very much in the short run.
Good news is still good news
What really matters to stock prices is growth, and interest rates. The Q1 GDP report was an important test for investor psychology. Is good (economic) news still good (stock market) news, or bad news?
In other words, have investor focus from the bullish factors behind positive growth changing to a fear about the bearish effects of higher growth and inflation on interest rates?
As it turns out, the bulls squeaked out a narrow win on market psychology based on the results of the Q1 GDP report. Q1 GDP growth came in at 2.3%, ahead of market expectations of 2.0%. Bespoke observed that the Employment Cost Index was showing signs of acceleration. The acceleration was not just confined to higher management bonuses, but salaried staff as well.

Q1 GDP growth has historically been depressed by seasonal factors. When we unpack some of the unusual conditions, we can see that Q4 to Q1 was distorted by hurricane-driven Q4 spike in auto sales and home repairs. GDP growth ex-hurricane effects was 2.7%. YoY GDP growth, which sidesteps the seasonal issues, came in at 2.9%.
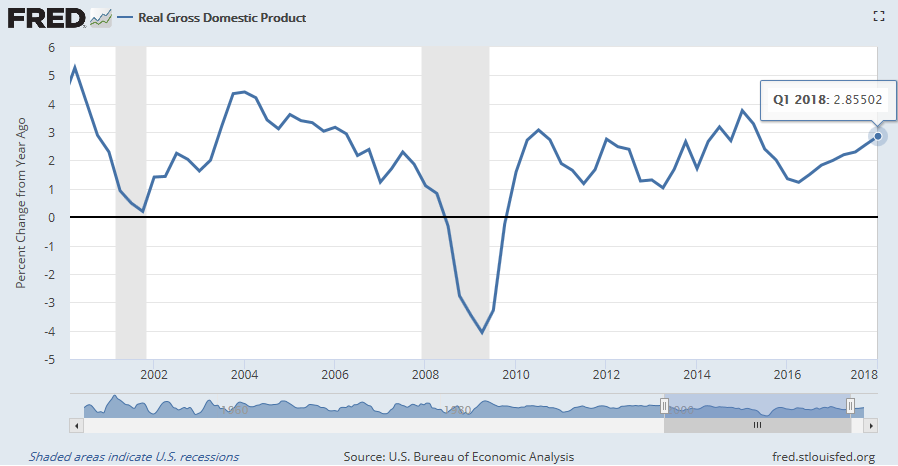
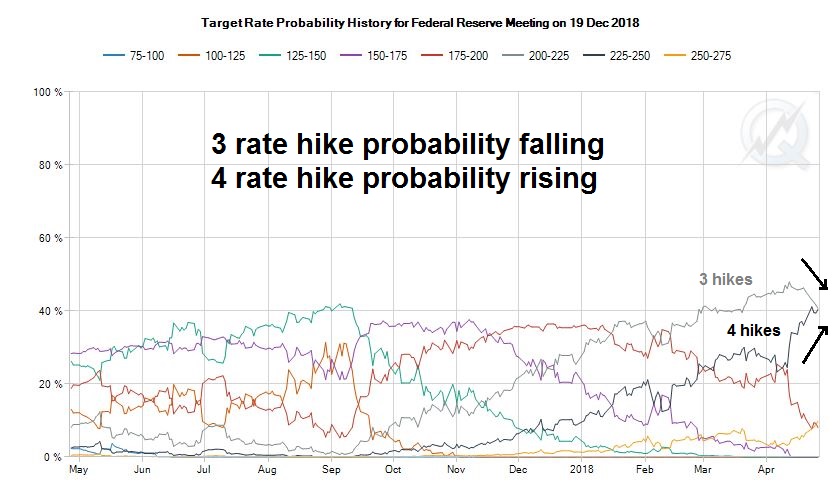
All in all, it was a strong GDP report. Moreover, inflationary factors were ahead of expectations. Core PCE prices rose 2.5% (vs. 2.4% expected), and the Employment Cost Index printed 0.8% (vs. 0.7% expected). These results should give the Fed hawks further ammunition to push for four rate hikes this year instead of three. Indeed, the latest market expectations from CME shows that the probability of four rate hikes this year has been rising, while the probability of three hikes fell. The market implied chances of three and four rate hikes are now roughly equal.
What did the market do after the GDP report? 2-year yields spiked initially but steadied to roughly flat at the close, and the yield curve flattened. Stock prices ended the day with a small gain.
Good news is still good news. It could have been a lot worse. Score one for the equity bulls in the category of market psychology.
Earnings, earnings, earnings!
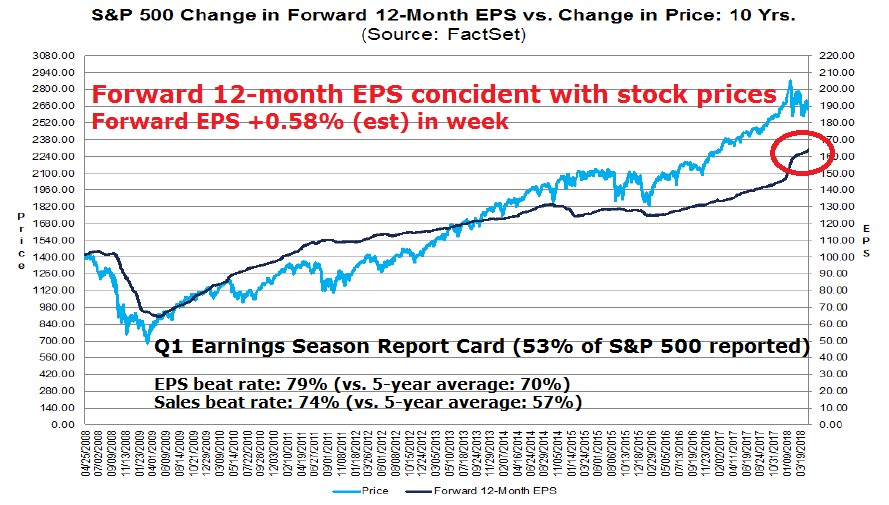
What about earnings growth? The results from Q1 earnings season has been solid. The latest update from FactSet shows that both the EPS and sales beat rates are well above their historical averages. Consensus EPS estimates rose in response to the upside earnings surprise. From a longer term perspective, forward 12-month EPS changes are roughly coincident with stock prices. While upward earnings revisions are not bullish signals in isolation, they do serve as a confirmation of the direction of Street expectations.
The market was spooked last Tuesday when Caterpillar, which is a major global cyclical bellwether, report blow-out results. In the subsequent call, management deflated expectations by stating that Q1 earnings “will be the high-water mark for the year”. That remark sent the stock’s price down, and the announcement went on to pull down the market as well. Investors should relax. CAT’s problems are likely specific to the company due to higher raw material prices from steel tariffs.
The CAT episode prompted some traders to panic and state that the market was not reacting to earnings beats. Analysis from FactSet shows that perception to be incorrect. On average, stocks are rising on earnings beats, and falling on misses. That said, the magnitude of the market reaction during this earnings season has been muted when compared to the historical average.

Score one for rising growth expectations in the E of the P/E ratio.
Watch the real economy
What about the problem of rising yields? 2-year Treasury yields have been rising steadily since the Fed began its tightening cycle, and 10-year yields are near the 3% level. When do higher rates start to hurt stock prices?
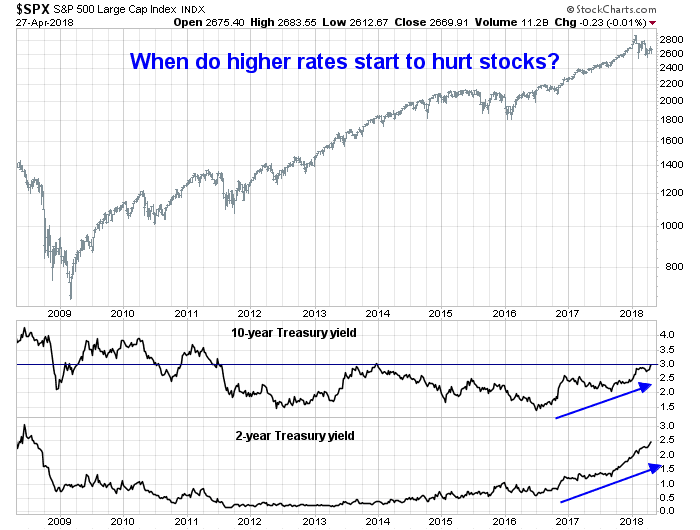
While rising yields does create competitive pressures on holding stocks, the continued dominance of the “good news is good news” narrative suggests that investors should instead focus on the secondary effects of rising rates on the real economy.
There are two likely reasons for the E in the P/E ratio to fall. Either the the Trump White House plunges the global economy into a slowdown with a trade war, or the Fed over tightens the economy into a recession. The latest news indicates that trade tensions are easing. Trump reported sounded optimistic and stated that there was a “very good chance” that a trade war could be averted. Treasury Secretary Mnuchin is on his way to China for a round of negotiations.
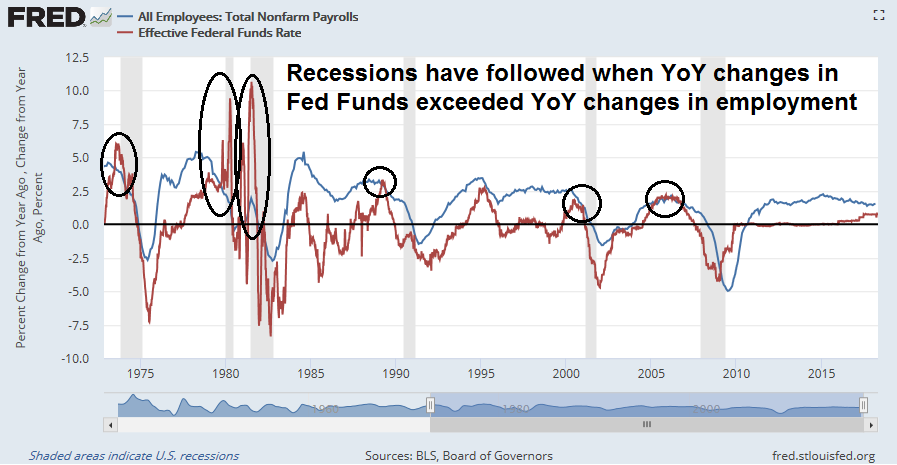
That leaves the Fed. The Fed is undergoing a tightening cycle. Instead of asking when rising rates are likely to hurt the stock market, the better question is when rising rates is likely to slow economic growth. Historically, recessions have followed whenever the YoY changes in Fed Funds rates have exceeded the YoY change in employment. This indicator is getting close to a recession signal, and I will be watching the April Jobs Report closely Friday to see how it is evolving.
In addition, the combination of higher interest rates and quantitative tightening will have the effect of slowing money supply growth. In the past, a recession has followed whenever either M1 or M2 growth has fallen below the inflation rate. Money supply growth is decelerating rapidly, and real M2 is on pace to go negative later this year.

Watch the effects of rising rates on the real economy, not just the stock market.
Too early to get bearish
Still, it is too early to get too bearish on equities just yet. There are few signs of a bull market killing recession in sight. Initial jobless claims provide a timely high frequency pulse of the American economy. There was much excitement last week when initial claims fell to the lowest level since 1969. For a better perspective, initial claims adjusted for population has been steadily declining and making all-time lows in this expansion cycle.
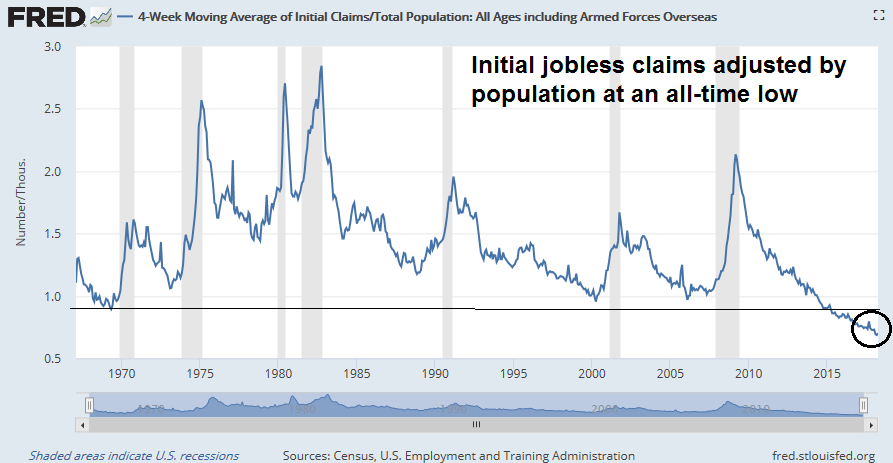
Initial claims have been inversely coincident with equity prices during the past few expansion and provides real-time confirmation of stock market trends. The bull is still alive, according to this metric.

New Deal democrat monitors high frequency economic data, and he helpfully categorizes them into coincident, short leading, and long leading indicators. His analysis indicates that there are no immediate signs of recession, though the long leading indicators are deteriorating:
The nowcast remains positive, as confirmed again by the monthly data. The short term forecast has decelerated from strongly to normally positive. The long term forecast continues to tiptoe towards neutrality, but as of now remains weakly positive, with housing, as indicated by purchase mortgage applications being the chief reason for continued positivity, although the GDP report suggests housing may be weakening slightly as well.
The exuberant reception of WeWork junk bond issue (see the details of financial analysis from FT Alphaville and Bloomberg) shows that the animal spirits are alive. The company originally tried to raise $500 million in debt, but the issue was 5x oversubscribed and upsized by 40%. The bond was priced at 7 7/8%, thought it sank to below par soon after the offering.
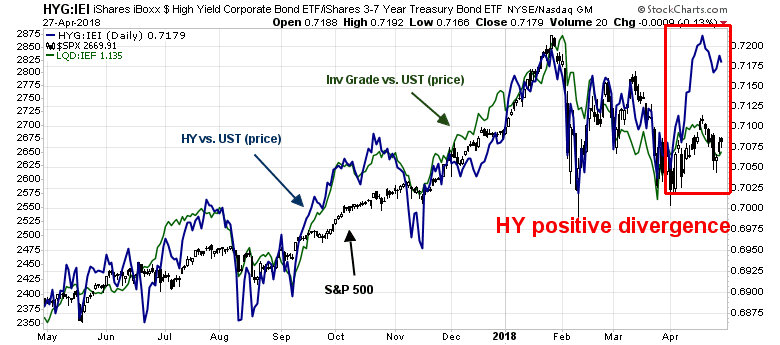
The WeWork offering is an indicator of low stress levels in the financial system. In general, high yield (HY) bonds have been flashing a positive divergence against stock prices, though the risk appetite of investment grade bonds is roughly tracking equity movements.
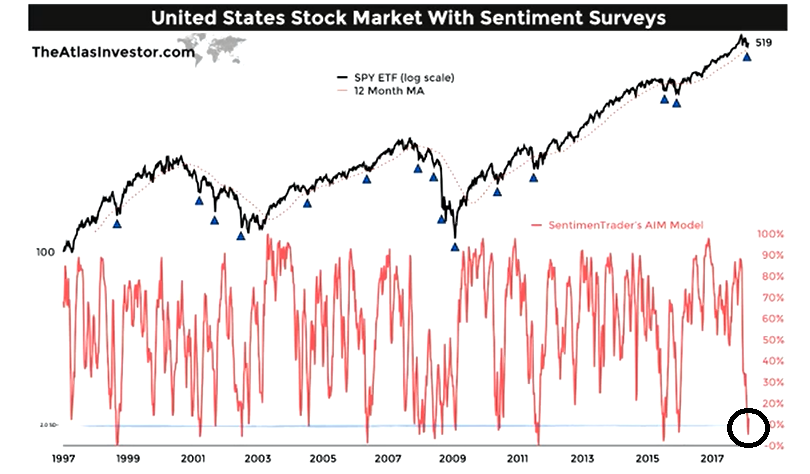
Tiho Brkan recently highlighted SentimenTrader’s AIM composite sentiment model. Readings are at levels that have produced short-term bounces. At a minimum, downside equity risk is limited at these levels.
Despite the prospect of rising rates, the combination of a strong growth outlook, robust economic nowcast, lack of financial stress, and washed-out sentiment are signals that it is too early to get intermediate term bearish. While there is no doubt that the equity bull is mature, the day of reckoning is not at hand – yet.
The week ahead
Looking to the week ahead, New Deal democrat‘s comment that the “short term forecast has decelerated from strongly to normally positive” may be setting the tone for the stock market’s outlook for the next few weeks. While the short term forecast remains positive, its deceleration has provided the impetus for the current correction. Stock price are likely to consolidate and remain range bound until some of the uncertainties that overhang the market are resolved.
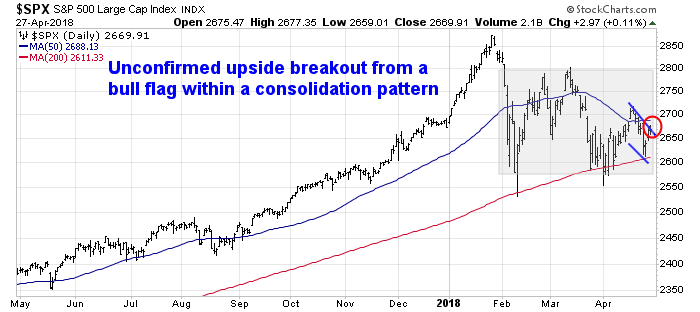
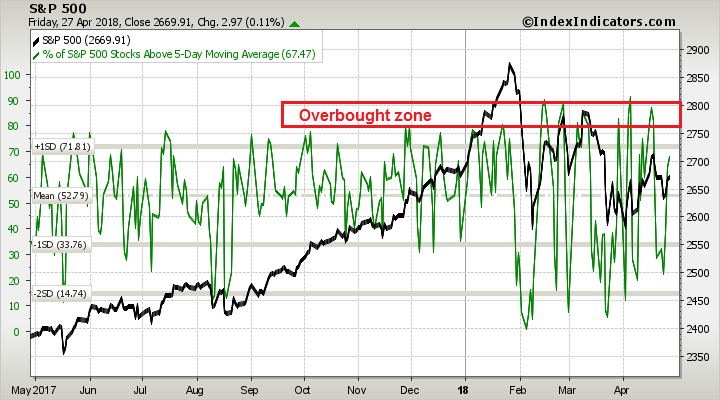
That said, the S&P 500 may be in the process of staging an upside breakout from a bull flag, which would higher prices ahead. However, the market is approaching overbought readings from a short-term (1-2 day) time frame.
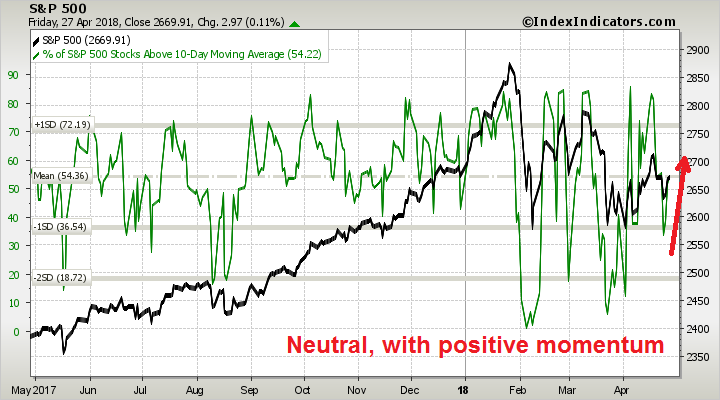
On a longer (3-5 day) time frame, breadth readings are neutral but exhibit positive momentum tendencies, which is bullish.
While the bias is bullish, expect lots of event driven volatility next week. From a macro perspective, the FOMC announcement on Wednesday, and the Jobs Report on Friday will undoubted create some choppiness. As well, Q1 earnings season is in full swing, and remember how AMZN, CAT, and FB created both upside and downside market swings last week?

My inner investor continues to be bullish on equities. My inner trader had taken a small long position, and he is prepared to add to his longs should the opportunity present itself.
Disclosure: Long SPXL
The global debt level is much higher now than before the GFC. Therefore the potential economic fallout from rate increases is much higher and could show up in markets much sooner than history. All of those dots in the scattergram happened during times of low borrowing.
It’s very obvious that three rate hikes this year will hurt the U.S. economy like a Class 5 hurricane. It’s as if a highly indebted nation is like climate change making hurricanes much more deadly. If you lived in hurricane alley in the Southern U.S., you’d better prepare for hurricane season a lot differently nowadays.
Likewise, I’d suggest preparing for Hurricane Powell. It’s coming. Will the mayhem start sooner or later? Who knows? But after hurricane season ends, I’m sure most people will look back and say they should have taken greater precautions. They may regret trying to get a lot of golf games in the period before the expected storms rather than preparing.
Step one in portfolio preparation is tactical reduction of equities. Even a little will start ones mindset heading right. It’s like going to Home Hardware to buy some plywood to build the storm shutters for your windows. You may be surprised that many others there doing the same while your buddies are out playing golf.
The incredible outperformance of the Utility sector recently when everyone is worried about interest rates, tells me there is an institutional shift to those defensive stocks. Those are the guys that move hundreds of billions and need to move early in a large tactical shift when smaller actors are willing to buy from and sell to them in size.
Here is a contrarian opinion to Ken’s;
https://fat-pitch.blogspot.com/2018/04/weekly-market-summary_28.html
Here is some more detail on the “rising rates support equities” claim:
Now, it’s true that rising rates killed equities when they rose to 20% in the 1970s, but during the prior three decades (the 1940s, 50s and 60s) when rates were similar to now, equities rose with rates. This made sense to everyone at the time: when the economy and companies are growing faster, there is greater demand for money, so interest rates are higher. And bigger, faster growing profits make companies more valuable (chart from Robert Shiller).
Looking at the chart from the fat-pitch post in more detail, one could argue that valuations actually expanded from 1949 (coming out of recession) to the mid 60s – during that period of time US public debt in comparison to GDP was already lower compared to current levels. In addition, 1948-49 was expected to be much worse of a recession than it actually turned out to be, sentiment was understandably very bearish.
This paper “suggests limited risks in the ability of the U.S. corporate sector to cover interest payments”:
https://www.federalreserve.gov/econres/notes/feds-notes/potential-increase-in-corporate-debt-interest-rate-payments-from-changes-in-the-federal-funds-rate-20171115.htm
Corelogic assumes mortgage payments to rise much faster than disposable income, but typical monthly payments to remain well below 2006 levels:
https://www.corelogic.com/blog/2018/02/forecasts-suggest-homebuyers-typical-mortgage-payment-could-rise-over-15-percent-this-year.aspx
The far end of the yield curve is at the mercy of overseas buyers. The 10 year treasury, may not increase in yield much as overseas buyers buy US paper, keeping yields on 10 year depressed (A German investor may find US 10 year that yields 3 % more attractive than a ten year bund yielding say 0.6%). The yield curve may therefore inverts this time, but may not indicate recession as it has done in the past. Cam and others have talked about this in the past. As a rule of thumb, stocks rally in the early part of interest rate rise. Rising inflation usually forces the hand of the Fed to raise rates, and if done too fast, will kill the stock market rally. We do not know how fast will the Fed raise rates this time.
I’m suggesting that risks in a highly indebted world with interest rates projected to rise rapidly is one where risk is higher than we realize. Therefore some form of risk reduction or insurance is a good idea.
This is coming from a person who was very bullish in early 2016. I was saying that we were starting a brand new bull market. And we did. So I am not a permanent bear.
If you want a similar historical period to now that will strike fear in your heart, look at 1937. We had a deflationary bust from 1929 to a 1932 low with a new Democratic President elected with a very stimulative monetary policy (New Deal). Sounds similar to the GFC Obama and QE. Then there was a huge economic recovery that made people think the Depression was over. The Fed tightened because the thought the New Deal was inflationary. What followed was a 50% collapse in the stock market and the economy fell back into a Depression. In hindsight they made a big error in thinking that the economy was normal after the deflationary bust of the early 1930s. Many economists are worried the current economic landscape is very fragile following our GFC deflationary bust. The new Fed Chairman and new appointees to the board are not the gentle types like Yellen. They could make a policy blunder with nasty stock market outcomes.
I’m not say this will happen. I’m just saying that we are heading into unknown and possibly stormy waters.
Ken, can you quote references to the concern you express going forward? Yes, I agree with you, intuitively the next recession may be much more difficult than past recessions.
As we discuss the rise of bond yields, one unknown that concerns me is the cash that US companies repatriate from overseas. This is going to come out of US treasuries, pushing yields higher. On the other hand, the European Central bank is also cutting back on QE, pushing Corporate bond yields higher. All of these factors remain an unknown. There are likely to be unintended consequences.
D.V.
Here is a Ray Dalio interview where he talks about the similarities to 1937.
https://www.youtube.com/watch?v=hFcnu_54zl8&list=PLeJkoT3kS6vCEGrXq6e4v39M3X5uT2-sB
Thanks.