Preface: Explaining our market timing models
We maintain several market timing models, each with differing time horizons. The “Ultimate Market Timing Model” is a long-term market timing model based on the research outlined in our post, Building the ultimate market timing model. This model tends to generate only a handful of signals each decade.
The Trend Model is an asset allocation model which applies trend following principles based on the inputs of global stock and commodity price. This model has a shorter time horizon and tends to turn over about 4-6 times a year. In essence, it seeks to answer the question, “Is the trend in the global economy expansion (bullish) or contraction (bearish)?”
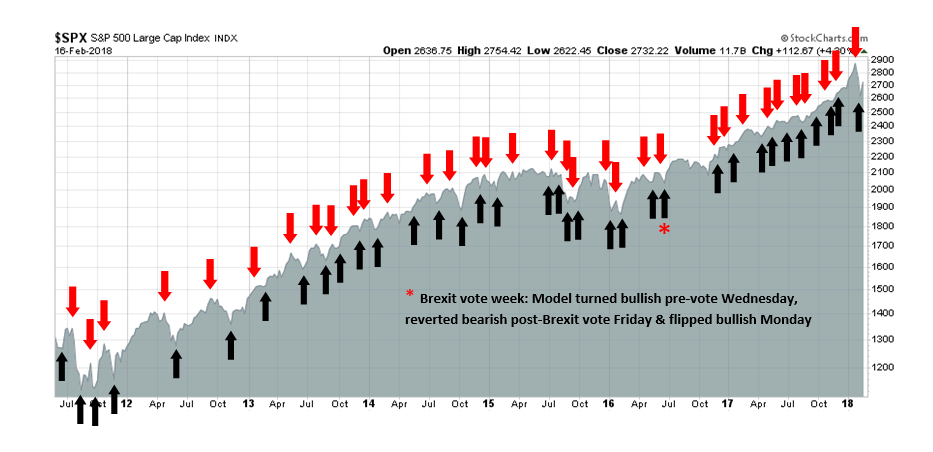
My inner trader uses the trading component of the Trend Model to look for changes in the direction of the main Trend Model signal. A bullish Trend Model signal that gets less bullish is a trading “sell” signal. Conversely, a bearish Trend Model signal that gets less bearish is a trading “buy” signal. The history of actual out-of-sample (not backtested) signals of the trading model are shown by the arrows in the chart below. The turnover rate of the trading model is high, and it has varied between 150% to 200% per month.
Subscribers receive real-time alerts of model changes, and a hypothetical trading record of the those email alerts are updated weekly here.
The latest signals of each model are as follows:
- Ultimate market timing model: Buy equities
- Trend Model signal: Neutral
- Trading model: Bullish
Update schedule: I generally update model readings on my site on weekends and tweet mid-week observations at @humblestudent. Subscribers receive real-time alerts of trading model changes, and a hypothetical trading record of the those email alerts is shown here.
A change of the guard at the Fed
Is the bond market telling us that it’s all over? Stock prices got spooked when the 10-year Treasury yield approached the 3% mark, which was the “line in the sand” drawn by a number of analysts that indicated trouble for equity prices. As the following chart shows, the 10-year yield had violated a trend line that stretched back from 1990. One puzzle is the mixed message shown by the yield curve. Historically, both the 2-10 yield curve, which represents the spread between the 10 and 2 year Treasury yields, and the 10-30 yield curve both inverted at the same time on the last three occasions to warn of looming recessions. This time, the 2-10 yield curve has been volatile and steepened recently, which the 10-30 yield curve stayed on its flattening trend.

What’s going on? We can get better answers once we have greater clarity on the future direction of the Powell Fed.
- How will the Powell Fed’s reaction function to inflation differ from the Yellen Fed? The risks of a policy mistake are high during the current late cycle expansion phase of the economy. Adhere to overly strict rules-based models of monetary policy, and the Fed risks tightening too much or too quickly and send the economy into a tailspin. Allow the economy to run a little hot with based on the belief of a symmetrical 2% inflation target, inflation could get out of hand. The Fed would consequently have to step in with a series of staccato rate hikes that guarantee a recession.
- What about the third unspoken mandate of financial stability? Will there be a “Powell put” that rescues the stock market should it run into trouble?
Those are all good questions to which no one has any good answers. No wonder the yield curve is sending out confusing messages.
Many opinions, no real answers
There are many opinions, though. Fed watcher Tim Duy believes that the Powell Fed is unlikely to give the market a put, at least in the short-run. Instead, it is more likely to focus on the long-term outlook implications of monetary policy:
I suspect the challenge for the Fed will be to keep market participants focused on their medium-term forecast. If, as many believe, wage growth and inflation make an appearance this year, the Fed will have the opposite problem from 2017. Then they struggled to keep the focus on gradual rate hikes despite disappointing data. In retrospect, I think the dovish policymakers did us few favors last year, tamping down rate hike expectations that then were quickly reversed in recent weeks.
In 2018, we should be cautious of the opposite, of rising rate hike expectations (to four and beyond). To be sure, this is the risk to the forecast. But policymakers will likely send a message that they will not overreact to higher inflation just as they did not overreact to lower inflation in 2017. I don’t think anyone could be faulted for believing that two percent is a ceiling, not a target. This would be the opportunity for the Fed to disabuse us of that notion and prove that the inflation target is symmetric. I suspect this message would be well received by market participants fearful that the Fed is going to accelerate rate hikes at the slightest provocation.
Gillian Tett of the Financial Times is also skeptical of the existence of a Powell put. She believes that the Fed is likely to be more hawkish than market expectations:
These days, with a new governor — Jay Powell — in charge, nobody knows exactly where policy will head next. But Mr Powell does not seem a natural dove: he has previously said that he is concerned that loose monetary policy has created bubbles in fixed income, and last year stressed that it is “not the Fed’s job to stop people from losing money”.
His colleagues do not seem dovish right now either. This week Bill Dudley, head of the New York Fed, dismissed the equity market falls as “small potatoes”.
It is also important to note that the staff of the mighty Fed — who appear to be rising in power now, since Mr Powell is not an economist — are determined to keep the institution immune from political pressure. Every time President Donald Trump tweets about the stock market, this determination rises.
This means that it will be hard for the Fed to sit on its hands if inflation keeps rising — even if equity markets tumble. Or to put it another way, in the past the Fed might have tolerated the idea that there was a “put”, since price pressures were weak. Now, the Fed put is withering away, or has been reset at a much lower level…
The key point is that 10 years after the Great Financial Shock, a regime change is now under way, in terms of the intellectual framework of the Fed. It would be a mistake to presume that Mr Powell will ride to the rescue if share prices do slide. Even (or especially) in an era when Mr Trump has made stock prices a bellwether of his success.
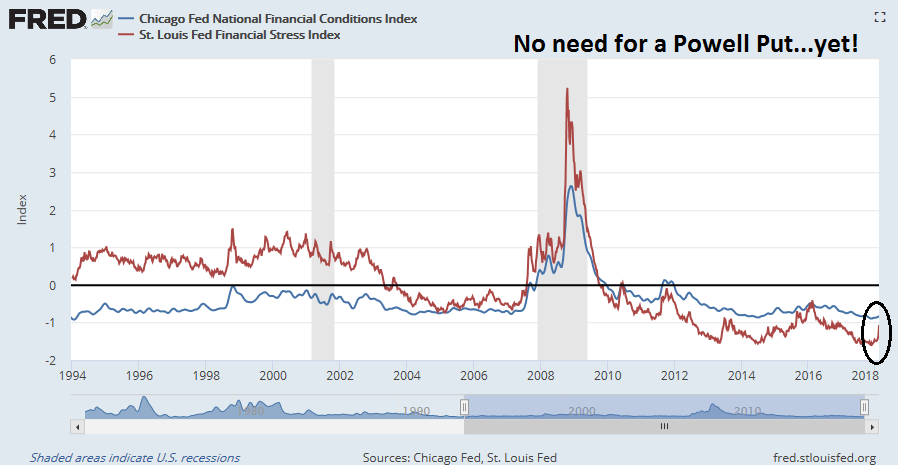
For some perspective, financial conditions are still loose despite the recent market hiccup. There is little necessity for a Powell put, at least for now.
Still, everyone is speculating and making informed guesses about the likely path of Fed policy. No one knows very much. This level of uncertainty is raising risk levels for the markets.
The Yellen Fed baseline
However, we are not completely in the dark about Fed policy. We have a reasonably good idea how the Yellen Fed would react to current conditions. From that baseline, we can project likely policy based on assumptions about whether the Powell Fed would be more hawkish or dovish than the Yellen Fed.
Today, there are signs of looming inflationary pressures. Consider, for example, the CPI print that spooked the market. Even though January’s core CPI rose 0.3%, which was ahead of market expectations of 0.2%, the WSJ pointed that actual core CPI rose 0.349%. Had it increased by as little as 0.001% and core CPI would have rounded up to 0.5%, which would have spooked the markets even more. In addition, headline CPI was up 0.5448%, another 0.0012%, it would have rounded up to 0.6%.
Other inflation metrics are indicative of rising inflation pressures. The New York Fed’s Underlying Inflation Gauge came in at 3.0%, which is significantly ahead of the Fed’s 2% inflation target.

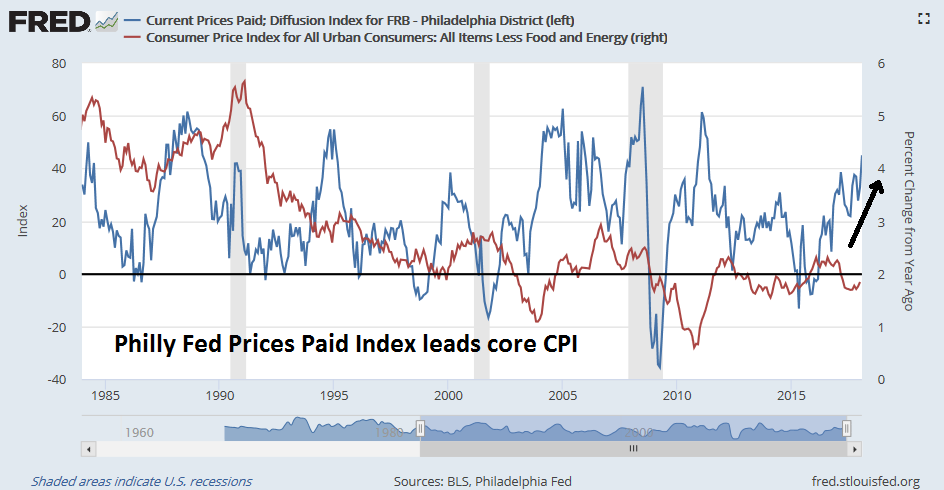
The Philly Fed’s prices paid diffusion index has been a rough leading indicator of core inflation pressures. The Empire State has a similar prices paid index, which correlates highly with the Philly Fed index but it is not shown because it has a much shorter history.
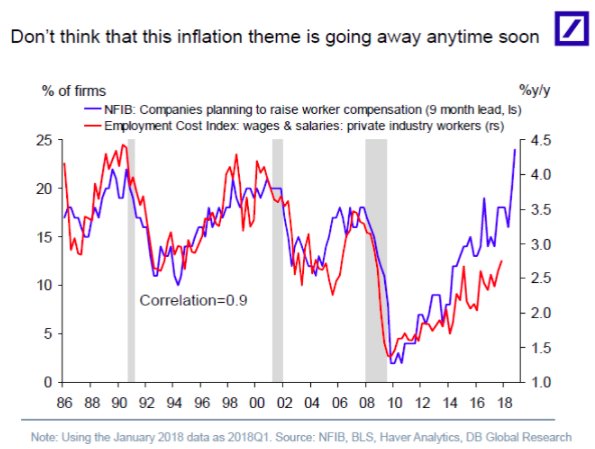
What about the closely watched wage inflation, which is part of the Phillips Curve and a key component of Fed policy? Deutsche Bank pointed out that the small business plans to raise worker compensation leads the Employment Cost Index by about nine months. As the chart below shows, this leading indicator is pointing to rising wage pressure.
These conditions suggest that the Yellen Fed’s dot-plot projection of three rate hikes would represent a floor on the number of hikes in 2018.
Likely policy changes
What’s more, those projections are based on the actions of the Yellen Fed’s 2017 FOMC. The evolution of the votes of the regional Fed presidents in the 2018 FOMC makes it more hawkish than the 2017 FOMC. In 2018, the votes of dovish regional presidents such as Evans and Kashkari have been replaced by uber-hawk Mester, and Williams, who is centrist but tilts slightly hawkish.
For further clues as to the evolution in monetary policy, I would watch two developments, the fate of Fed governor nominee Marvin Goodfriend, and who the Trump White House nominates to fill the position of vice chair.
I wrote extensively about Marvin Goodfriend (see A Fed preview: What happens in 2018?). Gavyn Davies had endorsed Goodfriend’s nomination for Fed governor and characterized him as a rules-based monetarist in the Republican mold:
- Goodfriend’s conservative pedigree goes all the back to Reagan’s Council of Economic Advisors. He is a typical member of his generation…in having a very profound distaste for inflationary monetary policies.
- Goodfriend believes in a formal inflation target, which he thinks should be approved by Congress, rather than being set entirely within the Fed…On the Taylor Rule, Prof Goodfriend has recently argued that the FOMC should explicitly compare its policy actions with the recommendations from such a rule, because this would reduce the tendency to wait too long before tightening policy.
- Goodfriend believes that interest rates are a much more effective instrument for stabilising the economy than quantitative easing.
- Goodfriend has frequently argued forcibly against allowing an “independent” central bank to buy private sector securities such as mortgage-backed bonds, which he deems to be “credit policy”.
- Goodfriend has always been worried that “independent” central banks will develop a chronic tendency to tighten monetary policy too late in the expansion phase of the cycle.
Goodfriend’s confirmation as Fed governor is not a done deal. He squeaked past the Senate confirmation committee by one vote as the committee voted along party lines, with Republicans in support and Democrats against. The next hurdle is the confirmation vote by the full Senate, where the Republicans hold a narrow 51-49 majority. Already, Republican senator Ron Paul has voiced his opposition to Goodfriend’s confirmation. If Goodfriend is confirmed as a Fed governor, expect FOMC policy to tilt in a more hawkish fashion.
The other development to watch is the identity of the Fed vice chair, which is vacant since the resignation of Stanley Fischer. Various names have been floated for the position, and the latest is Cleveland Fed president Loretta Mester. Mester’s history indicates that she would also steer Fed policy in a more hawkish direction. Other leading candidates include John Taylor, who would be dogmatic and hawkish, and Mohamed El-Erian, who is centrist and pleasing to the market.
In short, while there is much we don’t know about the likely path of monetary policy, we do know that the latest Fed chair is not an economist, and he would lean on the advice of other major figures in the FOMC. There are two most likely paths for FOMC policy direction, neutral or hawkish.
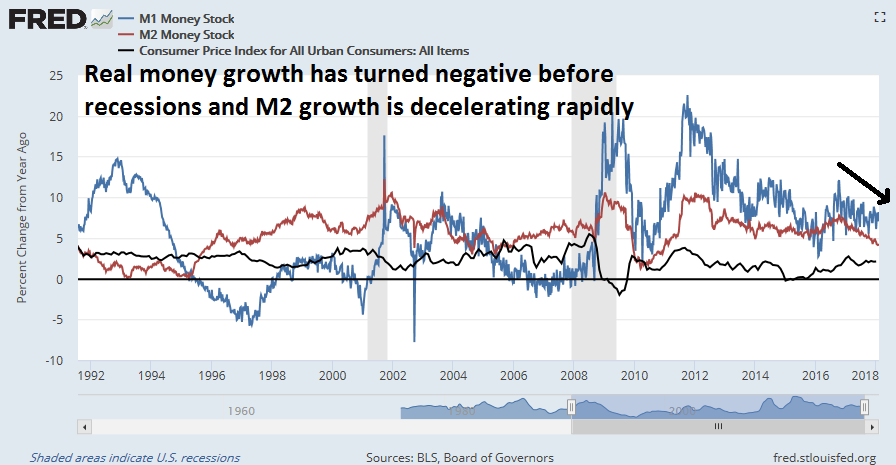
At a minimum, expect three rate hikes this year. Five would not be out of the question. In the past, real money supply growth, as measured by either M1 or M2, has turned negative in advance of recessions. M2 growth (red line) is already decelerating rapidly, while CPI has a stable to upward bias. How much more inflation and monetary tightening before real M2 growth turns negative?
Bullish short-term
For the time being, the short term stock market outlook remains bullish. The latest FactSet update of earning expectations is positive. Forward 12-month EPS continues to rise, which is reflective of positive fundamental momentum.
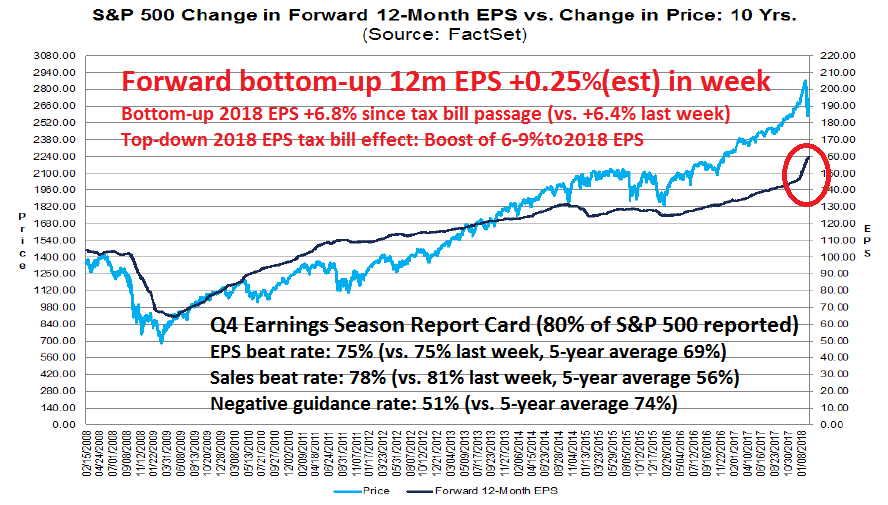
That said, bottom-up EPS upward revisions are starting to slow from their former torrid pace, as company analysts have largely factored in the positive effects of the tax cuts. 2018 EPS estimates are up 6.8% since the passage of the tax bill, which is roughly in line with top-down projections of a 6-9% earnings boost.

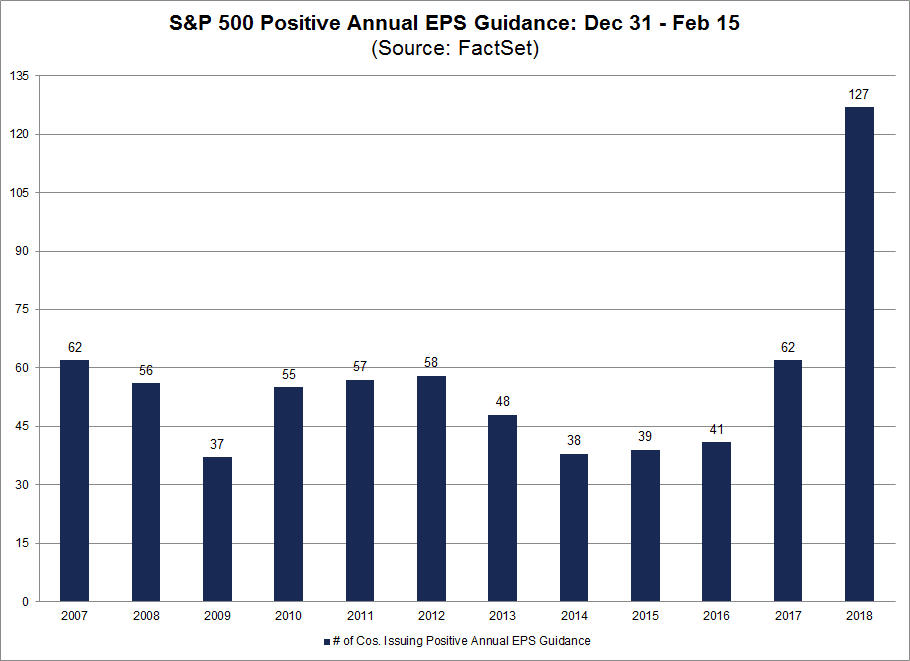
Q4 earnings results have been nothing short of spectacular. Both EPS and sales beat rates are well ahead of expectations, and a record number of companies are issuing positive guidance for 2018.
The latest update of insider activity from Barron’s is flashing a buy signal. However, these readings have tended to be noisy and therefore should be treated with some caution.
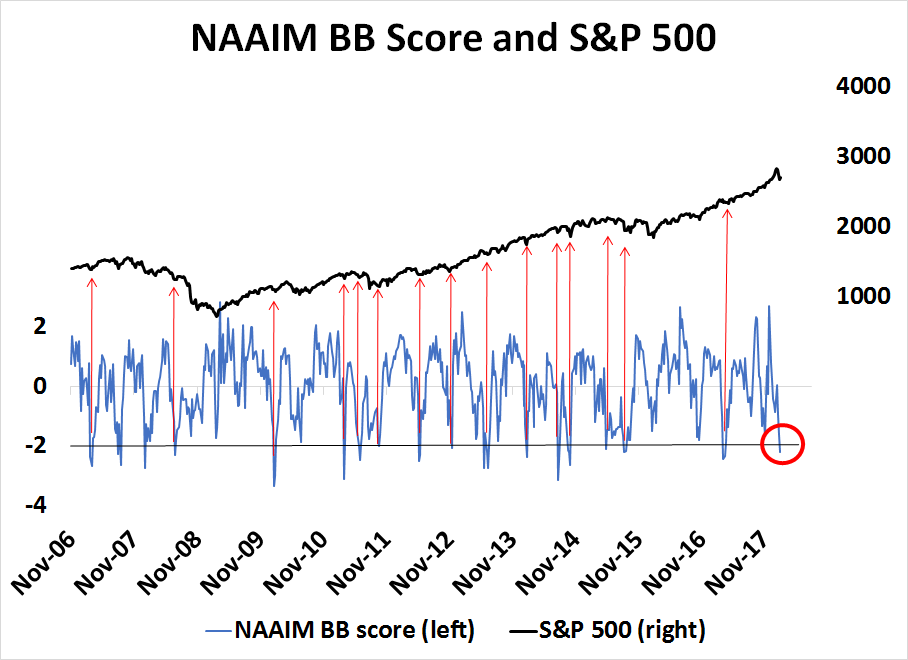
In addition, the sentiment backdrop is intermediate term bullish. The following chart measures how far the number of standard deviations the NAAIM Exposure Index deviates from its 20-week average (blue line). Historically, readings below -2 are contrarian bullish and have marked short-term market bottoms.
There is, however, one dark cloud on the horizon. The Commerce Department “found that the quantities and circumstances of steel and aluminum imports threaten to impair the national security” and recommended a series of tariffs or quotas on steel and aluminum. Commerce Secretary Wilbur Ross gave President Trump three options on steel:
- A global tariff of at least 24% on all steel imports from all countries, or
- A tariff of at least 53% on all steel imports from 12 countries (Brazil, China, Costa Rica, Egypt, India, Malaysia, Republic of Korea, Russia, South Africa, Thailand, Turkey and Vietnam) with a quota by product on steel imports from all other countries equal to 100% of their 2017 exports to the United States, or
- A quota on all steel products from all countries equal to 63% of each country’s 2017 exports to the United States.
And three options on aluminum:
- A tariff of at least 7.7% on all aluminum exports from all countries, or
- A tariff of 23.6% on all products from China, Hong Kong, Russia, Venezuela and Vietnam. All the other countries would be subject to quotas equal to 100% of their 2017 exports to the United States, or
- A quota on all imports from all countries equal to a maximum of 86.7% of their 2017 exports to the United States.
The market largely shrugged off the news of the Commerce findings on steel and aluminum, which hit the tape at noon on Friday. Notwithstanding any fears over a possible trade war, the combination of short-term positive fundamental momentum, washed out intermediate term sentiment, and probable rising hawkishness from the Fed paints a scenario of a short-term equity market rally, followed by heightened downside risk later this year.
The week ahead
Looking to the week ahead, the risk/reward of the short-term trading outlook is turning more cautious. The SPX has rebounded very rapidly in a short period, and it may be showing signs of stalling at its 61.8% Fibonacci retracement level. Moreover, the market ended on Friday with a gravestone doji, a bearish reversal formation.

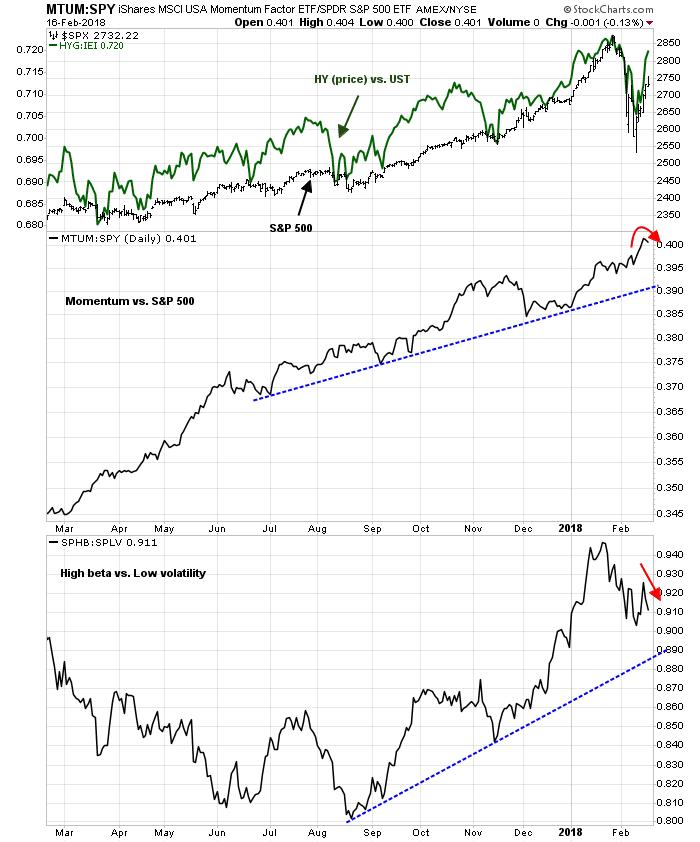
Measures of risk appetite are showing some early signs of weakness. The relative performance of price momentum (middle panel) and the relative returns of high beta vs. low volatility are rolling over. The one positive sign is the continued confirmation of the equity recovery by the relative price performance of junk bonds against duration equivalent Treasuries, despite the news of mass redemptions out of investment grade and high yield ETFs.
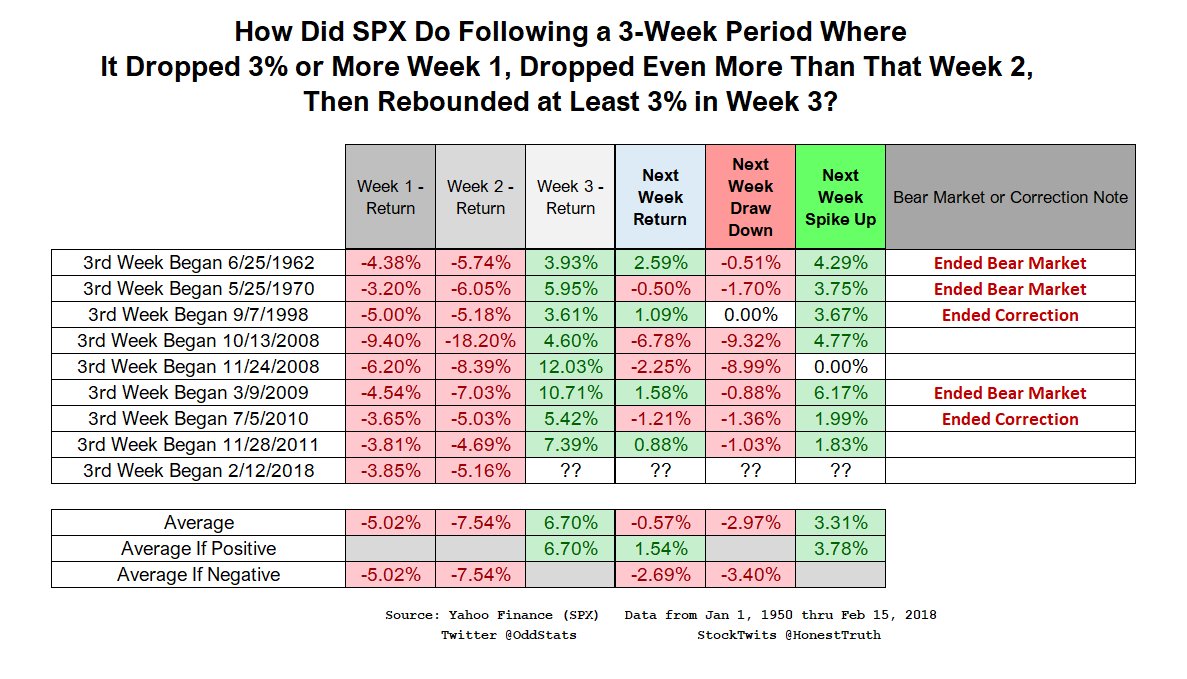
The current momentum surge isn’t totally unprecedented, but past rallies that have exhibited such power have marked the end of bear markets or corrections. While the market has gone on to new highs on an intermediate term basis, the historical record suggests that a pause is in order (via OddStats).
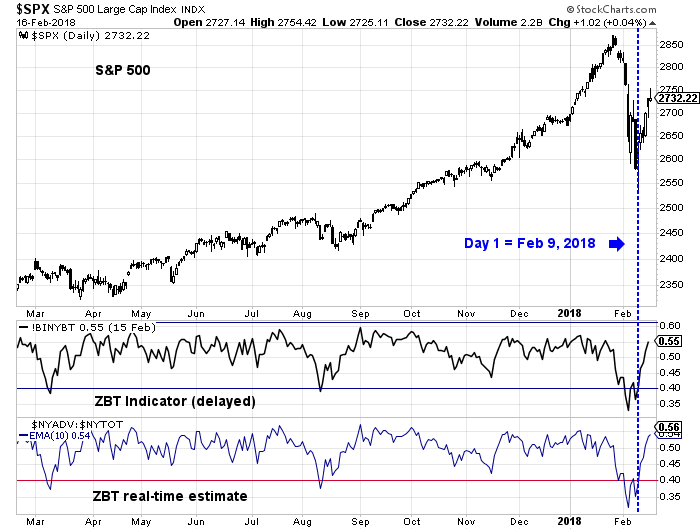
Still, I haven’t totally given up on the idea that the market may form a V-shaped bottom. I identified a possible Zweig Breadth Thrust buy signal setup (see How the market could fool us again). The clock is ticking, and the market has until February 22 to complete the momentum thrust.
My inner investor remains constructive on equities. My inner trader took some partial profits on his long positions late last week, but he remains long the market. He will add to his position should the market weaken and test the lows while flashing positive breadth divergences, or if market surges and the ZBT flashes a buy signal.
Disclosure: Long SPXL
David Rosenberg is an expert Fed watcher and is warning that the Fed will be much more hawkish going forward. The next couple of Fed meetings with their accompanying texts will be very key to gauge any change in tone.
Here is the text of an email I sent with a weekly momentum report. Ken
It is fascinating to watch new Leaders and Laggards evolve after a new low is established. It’s early to anoint February 8 as a sentiment low but it’s useful to mark it until another, lower low arrives. We simply want to know if previous leaders are still leading. On the report, I make the previous week the January 26 week which was the stock market high week. That week will tell us the performance from the August 18, 2017 LLLL sentiment low. How are things shaping up now, after a 10% correction and a rally?
Previous leaders that are leading again; Metals and Mining, Software, Technology, Aerospace and Defense, NASDAQ, Momentum, China.
New Leaders: Clean Energy, Emerging Markets
Previous LLLL leaders that are lagging now; Energy related, Autos, Transportation, Consumer Discretionary, Retail, Home Construction
There has been a positive bump to all things dividend oriented. This risk-off behavior happens whenever stocks fall and may not be a new trend.; Utilities, REITs, Dividend.
Laggards that are still lagging; Canada, India, Consumer Staples, Europe.
It’s up to you as a DIY investor or portfolio manager to match momentum performance with your investment thinking.
There is a possibility that Feb 8 will mark the LLLL sentiment low. We had a ‘Flash Crash’ while the background economic statistics are very positive. I have my idea about that, you will have yours. Good luck.
Great work. Much appreciated.
Humble,
On ZBT, I have Feb 9 as still below 40, with Feb12 being day 1. Am I wrong here ?
I show the ZBT Indicator at 56 as of Friday’s close.
As of Friday I show 54.19. We obviously are using different sources.
I see why we differ. I keep two charts, one for fraction advancing, the other the ratio of A/D. The former includes traded but unchanged issues. Normally this doesn’t matter, but this time the fraction advancing will include an extra day.
Have no idea which is right.
Correction : Ratio is A/(A+D)