Mid-week market update: I can tell that a stock market downdraft is a correction and not the start of a major bear market when the doomsters crawl out of the woodwork after the market has fallen (see Is the ‘short volatility’ blowup Bear Stearns or Lehman Brothers?) and analysis from SentimenTrader shows that their smart and dumb money sentiment indicators are at an extreme. As a frame of reference, SentimenTrader defines each term in the following way:
The dumb money indicators are typically made up of retail traders and trend-followers. This is NOT to say that all (or even most) retail mom-and-pop investors, and certainly not most trend-followers, are “dumb”. In fact, they are by definition correct during the bulk of a trend.
The smart money indicators are mostly made up of institutional accounts. These traders are often hedging day-to-day moves in the market, and therefore are often trading against the prevailing trend. Again, it is only when these traders move to an extreme that a market is most likely to reverse in their direction.

Sure, this could be the start of a bear market, but bear markets usually begin with technical deterioration, which are not present today.
A V or W shaped bottom?
Yesterday, the S&P 500 tested the first Fibonacci retracement level and powered through it today, despite the hotter than expected CPI print. The index is now approaching its 50% retracement level.
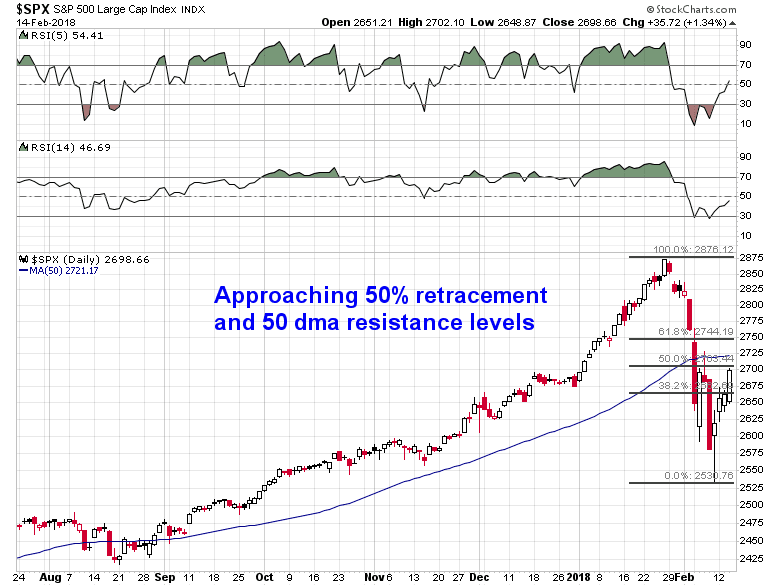
What’s next? Is it time for the stock market to take a breather? Is this correction a V or W shaped bottom? Urban Carmel, writing at The Fat Pitch, explained the difference between the two formations this way:
Corrections during bull markets have had a strong propensity to form a double bottom. Since 1980, only 16% of corrections have had a “V bounce” where the low was never revisited.
The current bull market has been different. Since 2009, about half of the corrections have had a “V bounce.” So what happens this time?
Sentiment can be reset through both time and price. It’s a good guess that if price recovers quickly, sentiment will again become very bullish, making a retest of the recent low probable. A slower, choppier recovery will keep investors skeptical, increasing the odds that the index continues higher.
He concluded that the odds of a V bounce amounts to a “coin toss”.
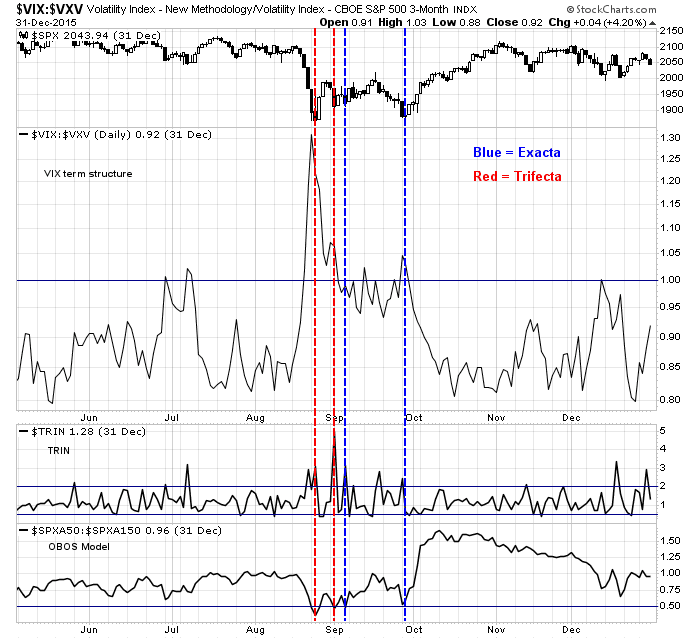
I am on record that current conditions are reminiscent of the W-shaped corrective bottom of 2015 (see Risk on, or risk off?). Stock prices fell suddenly in August 2015 and my Trifecta Bottom Spotting Signal flashed a buy signal, and the market proceeded to bounce and trade in a choppy manner for about a month before staging a sustainable rally.
Watching for the Zweig Breadth Thrust
Here is what’s bothering me. The consensus among technicians is the market is in process of forming a complex W-shaped bottom. If that`s the consensus, could we all get fooled and see a V-shaped rebound?
I am open to the possibility of the V formation, but the hurdles for such a market surge are not easy. We would need to see a Zweig Breadth Thrust. As of Friday, February 9, 2018, the market was setting up for a possible Zweig Breadth Thrust (ZBT) buy signal.
To explain, the Zweig Breadth Thrust is a variation of an IBD follow-through day pattern, but on steroids. Steven Achelis at Metastock explained the indicator this way:
A “Breadth Thrust” occurs when, during a 10-day period, the Breadth Thrust indicator rises from below 40% to above 61.5%. A “Thrust” indicates that the stock market has rapidly changed from an oversold condition to one of strength, but has not yet become overbought.
According to Dr. Zweig, there have only been fourteen Breadth Thrusts since 1945. The average gain following these fourteen Thrusts was 24.6% in an average time-frame of eleven months. Dr. Zweig also points out that most bull markets begin with a Breadth Thrust.
The Breadth Thrust is a rare but powerful bull signal that presages significant gains ahead for the stock market, should its conditions be satisfied. Day 1 was Friday, February 9. Here is the chart so far and the Breadth Thrust Indicator has 10 trading days to accomplish its task of reaching over 61.5%. The second panel in the chart below depicts the ZBT Indicator, as calculated by Stockcharts. As the Stockcharts signal update is often delayed, the middle panel depicts our own estimate of the ZBT Indicator. As the composition of the NYSE Composite is significantly different than the S&P 500, I constructed my own ZBT Indicator based on the SPX components in the bottom panel.

Readers who would like to follow along at home in real-time can use this link.
The market has until February 22 to achieve a ZBT buy signal. The clock is ticking.
Disclosure: Long SPXL
In 2015 the high yield bond spreads were widening right into the first low in August. As the market made a recovery they narrowed a bit but when they went to new highs the market made its double bottom.
Here since the January peak, yield spreads blew out over 50 basis points. High Yield ETFs have seen massive outflows. Spreads have retreated a bit with the stock market rally. My guess it that if spreads hit new highs, stocks will fall.
BTW, In this monetary insanity of loose Central Banks and tax cuts with huge deficits to follow when the economy is hot, gold and gold mining stocks seem a rational thing to hold. I call it “Bitcoin for people who’ve experienced inflation.”
Here is the link to the high yield bond spread if you want to follow it.
https://fred.stlouisfed.org/series/BAMLH0A0HYM2
I’m currently watching the EUR/USD – which is retestig the January levels. If EUR continues to strengthen and break through the 1.25 barrier that would be supportive of higher prices for multinational S&P 500 companies (with information technology likely being the largest contributor):
https://insight.factset.com/sp-500-companies-with-more-global-exposure-reporting-higher-earnings-growth-in-q4
If, on the other side, the USD starts to strengthen that would be a positive for european stocks (with likely Germany being the largest beneficiary) – the interesting part here is the January EUR/USD effect as outlined by Peter L Brandt, it concludes that EUR/USD is likely to set the high or low for a large part of the year during January or early February:
https://www.peterlbrandt.com/u-s-dollar-seen-annual-high-low-january-20-past-21-years/