Mid-week market update: After much indecision, the SPX paused at its 61.8% Fibonacci retracement level.
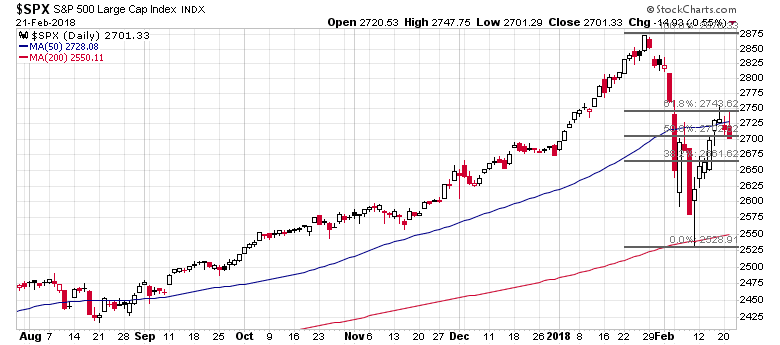
The 50 day moving average (dma) which could have acted as support did not hold. I had also previously identified a possible Zweig Breadth Thrust buy signal setup. Unless the market really surges in the next two days, the ZBT buy signal is highly unlikely to be triggered.
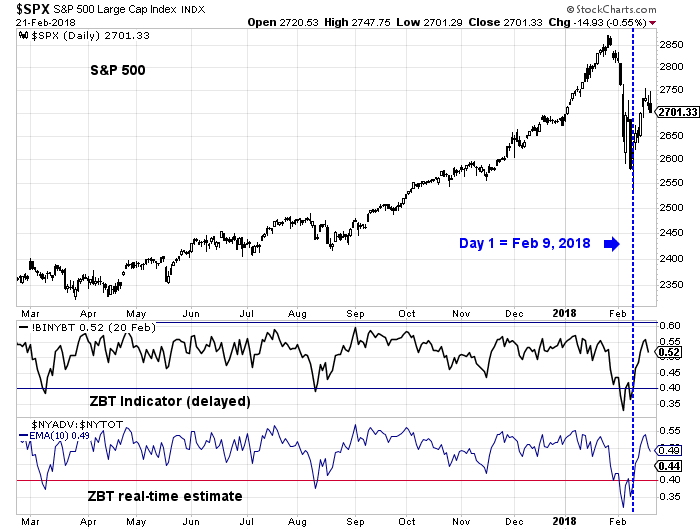
This market looks like it is setting up to form a W-shaped bottom.
Short-term headwinds
Rob Hanna at Quantifiable Edges identified two short-term headwinds for US equity prices. First, he pointed out that the week after a option expiry (OpEx) week where prices rose strongly tended to see price reversion.

In a separate post, Hanna observed that last Wednesday`s market surge was an IBD follow-through day, but on weak volume. Such episodes have tended to resolve themselves bearishly in the short run.

Despite these short-term hurdles, I wouldn’t get overly bearish just yet.
Buy the dip
There are plenty of reasons to be intermediate term bullish. Mark Hulbert reported that market timers have turned extremely bearish in a short period, which is a contrarian bullish:
Consider the average recommended equity exposure level among a group of short-term stock market timers I monitor who focus on the Nasdaq market (as measured by the Hulbert Nasdaq Newsletter Sentiment Index, or HNNSI). When I last wrote about this average, three weeks ago, it had just dropped 46 percentage points in only one week’s time, to 42.9%. That was enough of a drop to convince contrarians that the bull market was yet alive.
Believe it or not, the HNNSI today is even more negative, at minus 21.9%. That’s more than 64 percentage points lower than it was then, despite the market’s rally since its Feb. 8 lows. So contrarians are even more upbeat today than they were at the beginning of February.

The Commitment of Traders report also tells a similar story. The Hedgopia analysis of COT data shows that large speculators, or hedge funds, have moved to a crowded short position in the high beta NASDAQ 100, which is another contrarian bullish sign.

The market rally off the bottom has been led by high beta momentum stocks that are overweighted in the NASDAQ 100. Risk appetite is alive, and how long before hedge funds capitulate and engage in a short covering rally?

In conclusion, my inner trader is wary about being overly bearish in order to catch a few percentage points on the downside. The risk/reward is not favorable, and shorts could get their faces ripped off by a rally at any time.
That said, my inner trader did take some partial profits on his long positions late last week, and he is waiting for a dip to buy back in. Rather than specify specify support levels, I would prefer to watch for signs of positive RSI and breadth divergences as buy signals.

The market action in the next few weeks is likely to be choppy and treacherous. Traders should therefore scale their bets in accordance with the higher volatility environment – and be careful out there.
Disclosure: Long SPXL
I like the new look.
Thanks. That’s just the first step. Stay tuned for more.
Hi Cam, thank you for the new look of the website. I still hope in new highs:
1)
https://fat-pitch.blogspot.cz/2018/02/weekly-market-summary_19.html
2)
If this is a W correction pls have a look on 2015 and 2011 the highest high was reached after 69, 63 periods on 2h. chart. So we have a time approx. till max 8/3 to form the high in the midle of W – then down to second low.
What do you think about above mentioned?
Therefore your decision to stay long is very clever/wise.
Once more thank you very much for all you do. Hope that you are doing fine after fire. Pls write if you and your neighbours incl. dog are OK.
Have a nice day. Petr Pomazal, Czech Rep.
IN FAT PITCH PLS SEE:
The very short term trend in SPX indicates that further upside is still ahead. SPX has now risen 6 days in a row; in the past 5 years, that has led to at least one higher close within the next 7 days all 12 times. 10 of those instances occurred within the next 5 days. Risk/reward has been more than 3:1 positive over this period. Data back to 1990 shows a pattern of weakness over the next few days followed by relative outperformance 5-10 days later (from Dana Lyons).
Bubbles build by proving experts wrong until the great unwashed public disregards them and the bubble goes to absurd levels.
Experts are logical. Crowds are emotional. If we go to a new high after just a two week correction, prepare yourself for the absurd.
The market is as confusing as ever — quite honestly.