Preface: Explaining our market timing models
We maintain several market timing models, each with differing time horizons. The “Ultimate Market Timing Model” is a long-term market timing model based on the research outlined in our post, Building the ultimate market timing model. This model tends to generate only a handful of signals each decade.
The Trend Model is an asset allocation model which applies trend following principles based on the inputs of global stock and commodity price. This model has a shorter time horizon and tends to turn over about 4-6 times a year. In essence, it seeks to answer the question, “Is the trend in the global economy expansion (bullish) or contraction (bearish)?”
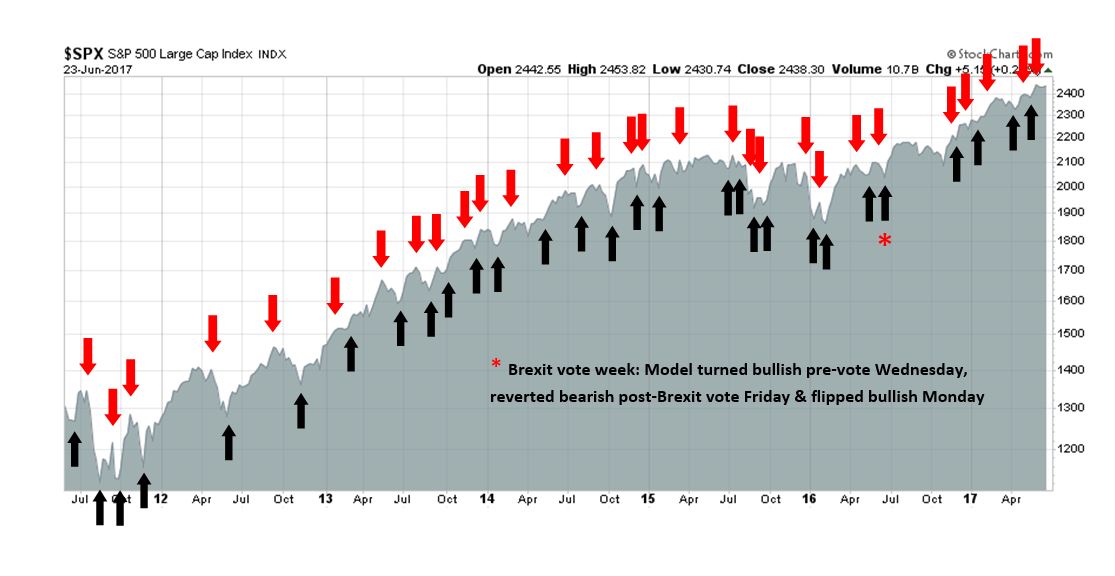
My inner trader uses the trading component of the Trend Model to look for changes in the direction of the main Trend Model signal. A bullish Trend Model signal that gets less bullish is a trading “sell” signal. Conversely, a bearish Trend Model signal that gets less bearish is a trading “buy” signal. The history of actual out-of-sample (not backtested) signals of the trading model are shown by the arrows in the chart below. Past trading of the trading model has shown turnover rates of about 200% per month.
The latest signals of each model are as follows:
- Ultimate market timing model: Buy equities
- Trend Model signal: Risk-on
- Trading model: Bearish
Update schedule: I generally update model readings on my site on weekends and tweet mid-week observations at @humblestudent. Subscribers will also receive email notices of any changes in my trading portfolio.
The global bull keeps on charging
Despite my recent negativity (see Risks are rising, but THE TOP is still ahead and Things you don’t see at market bottoms, 23-Jun-2017 edition), I am not ready to throw in the towel on this equity bull market.
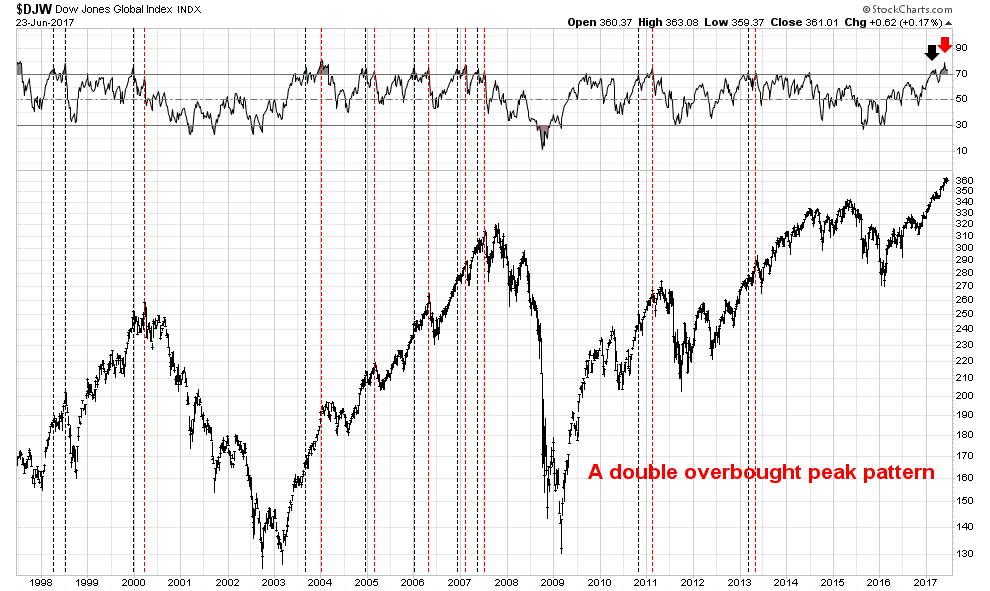
From a long-term perspective, the reflation trade is still alive, and growth is global in scope. As the 20-year monthly chart below of the Dow Jones Global Index (DJW) shows, the last two tops were preceded by negative RSI divergences. So far, DJW is barely overbought and has not even had the opportunity to exhibit a negative RSI divergence. This suggests that global equities can continue to grind higher, and the ultimate top is, at a minimum, several months away.

The tactical outlooks suggests that there may be some near-term weakness ahead. Drilling down to the weekly chart, DJW has shown a pattern of flashing double RSI overbought sell signals. In the past, the index has achieved a first RSI peak overbought reading (dark vertical line) which was followed by a second RSI peak (red vertical line). DJW has recently shown the same double overbought peak pattern, and, if history is any guide, the market is likely to stage a minor pullback.
I interpret these technical conditions as being in favor of the global reflation trade, though some minor pause may be necessary. This scenario is consistent with current macro and fundamental readings that are supportive of a reflationary driven equity advance..
Global reflation still lives
Last week, Business Insider featured a number of charts from market strategists that confirm my reflationary view.
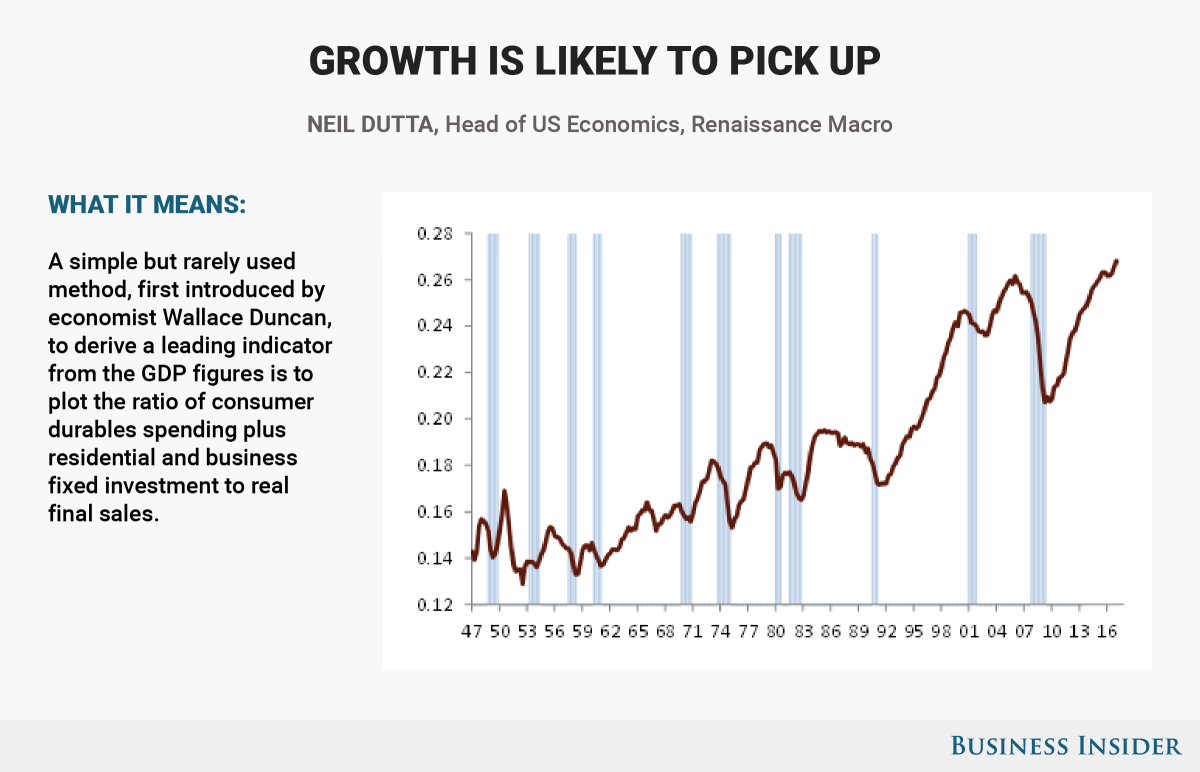
Starting with the US, Neil Dutta of Renaissance Macro observed that a simple but rarely used leading indicator is pointing to improving growth.
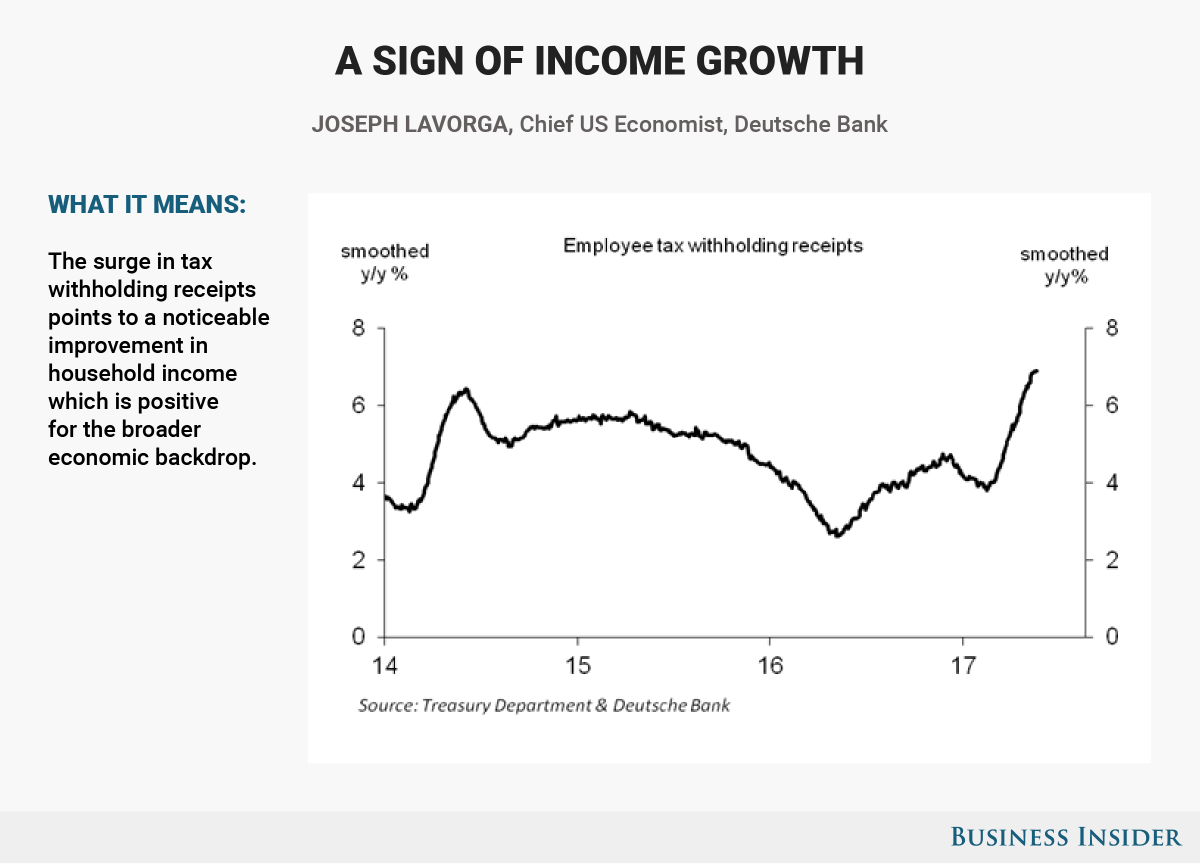
Joe LaVorga at Deutsche Bank noted that employee withholding tax receipts are trending upwards, which implies a healthy employment and consumer spending outlook.
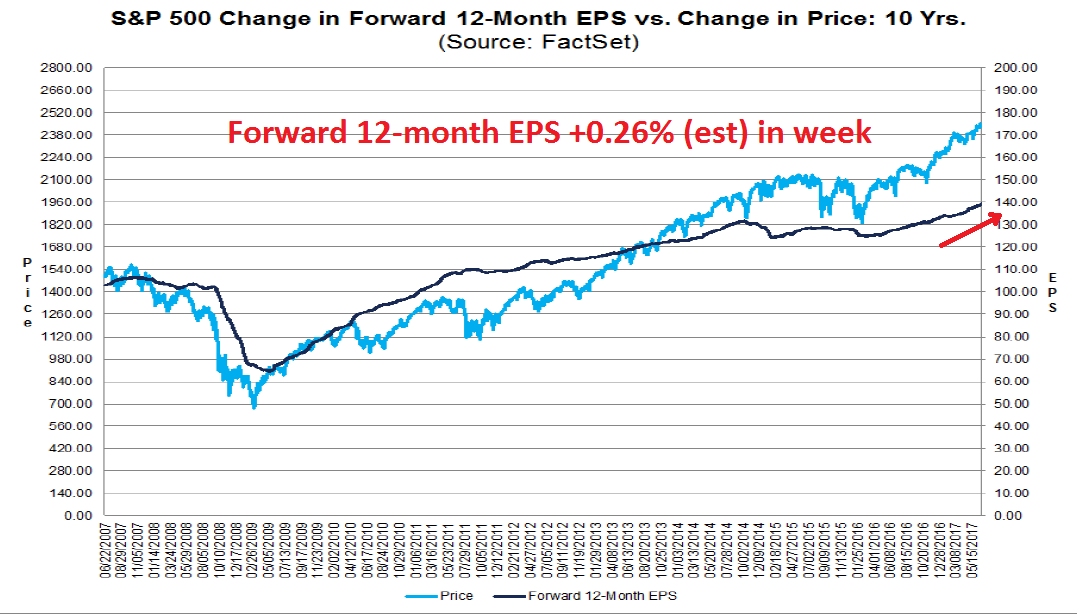
From a bottom-up perspective, the latest update of earnings estimates from FactSet shows that forward EPS continues to rise. Fundamental momentum of rising estimates should act to support higher stock prices in the near future.
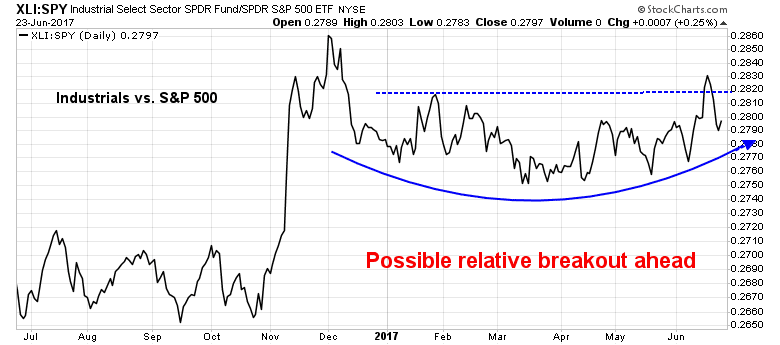
Last week, I wrote that the next stage of the market cycle typically sees leadership from capital-goods intensive stocks (see Risks are rising, but THE TOP is still ahead). The market relative breakout of the Industrial sector that I observed last week proved to be premature. Nevertheless, the technical pattern remains constructive.
Sean Darby of Jefferies observed that the Philly Fed’s expected capex outlook leads non-residential fixed investment, indicating that capex revival is likely ahead.

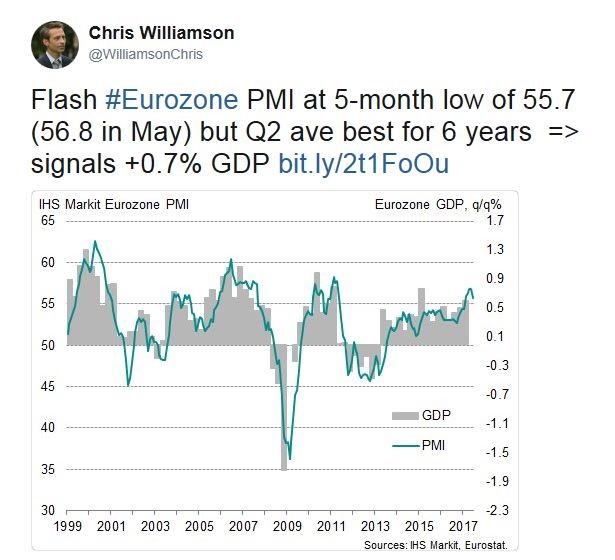
Across the Atlantic, Chris Williamson of IHS Markit commented that Friday’s Eurozone Flash PMI is still signaling better GDP growth.
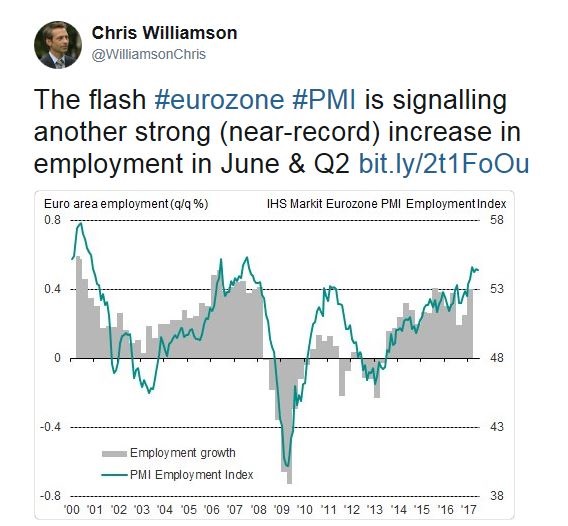
Moreover, Williamson also noted that employment in the eurozone is likely to be strong.
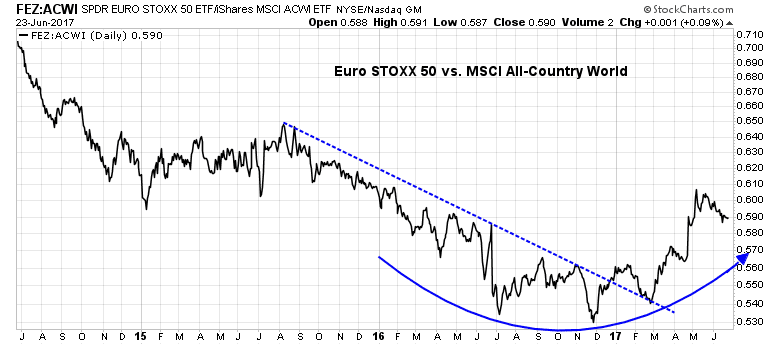
The recent record of better than expected growth has propelled the Euro STOXX 50 to break out of its relative downtrend against the MSCI All-Country World Index.
Over in Asia, the market signal from the performance of the stock indices of China’s major Asian trade is positive. Beijing’s crackdown on credit and the shadow banking system has shown little or no effect on Asian stock markets. The Shanghai Composite has managed to recover above its 50 and 200 dma, and only the resource heavy Australian market is struggling below its 50 dma.

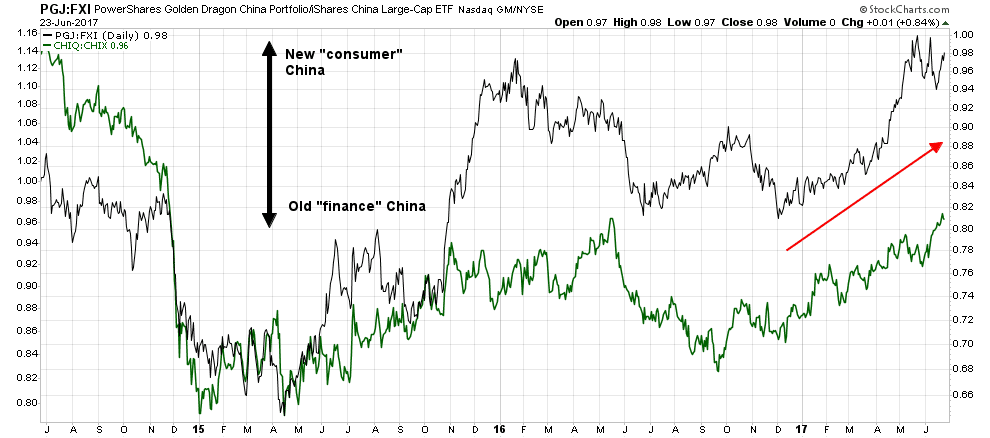
The Chinese authorities appear to have engineered the perfect economic re-balancing even as they tightened credit. My two pair trades of long new “consumer” China and short old “finance and infrastructure” China shows that new China is winning.
In short, the global reflation trade remains on track, with few impediments in sight.
How the Fed could take away the punch bowl
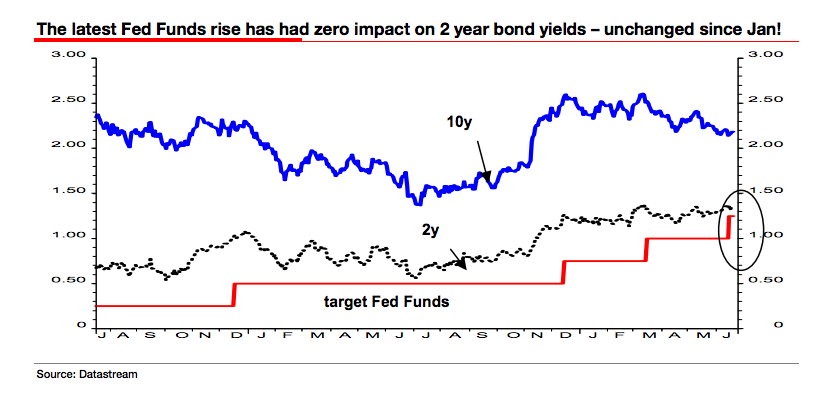
The biggest risk to the global reflation trade is a Fed policy that is more hawkish than market expectations. This chart from Albert Edwards (via Business Insider) tells the story of how the market doesn’t believe that the Fed`s dot plot rate hike projections. As the Fed announced its latest rate increase, 2-year Treasury yields barely budged, indicating market disbelief of further tightening because of tame inflation statistics.
That’s where the market may be in for a big surprise. Tim Duy agrees. He is turning to the hypothesis that the Fed is working backwards in order to justify its rate normalization policy. It first specifies the interest rate target, and works backwards to arrive at projected inputs afterwards:
What I don’t like is the feeling that the Fed’s unemployment rate forecast is essentially being reverse-engineered. They have a rate forecast that delivers policy normalization in a time frame they think appropriate. And they have a reaction function. If policy makers forecast lower unemployment then they need to either adjust the reaction function or lower their estimate of the natural rate of unemployment more aggressively. They don’t want to do either. So to keep their rate forecast intact, they need to set a matching unemployment rate forecast. And that produces a flat unemployment rate for this year.
While this approach of calculating the answer first and massaging model inputs is inherently objectionable, Duy thinks that Yellen believes the risks of the Fed falling behind the curve is rising quickly:
Yellen must feel there is a substantial risk of undershooting the natural rate of unemployment. It’s implied by the Fed’s growth forecast and Yellen’s view of the labor markets. This explains the Fed’s hawkishness in the face of low inflation. Indeed, despite years of below target inflation, officials continue to attribute the weak numbers to transitory factors. Yellen’s “idiosyncratic factors” has become a defense mechanism in response to fears that if unemployment drifts too low they can stave off inflation only by triggering a recession.
Ultimately, the Fed sees the risks associated with undershooting the natural rate of unemployment as greater than those of low inflation.
What this means is that the Fed will not turn dovish easily. Officials will not take their rate hike plans and go quietly into the night, even in the face of low inflation. Expect their baseline case to remain another rate hike and balance sheet reduction this year, plus another three 25 basis point hikes next year.
If Duy’s interpretation of Fed policy is correct, then the risk of a central bank engineered economic slowdown is substantially higher than expected. At a minimum, the market is going to be in for a big surprise.
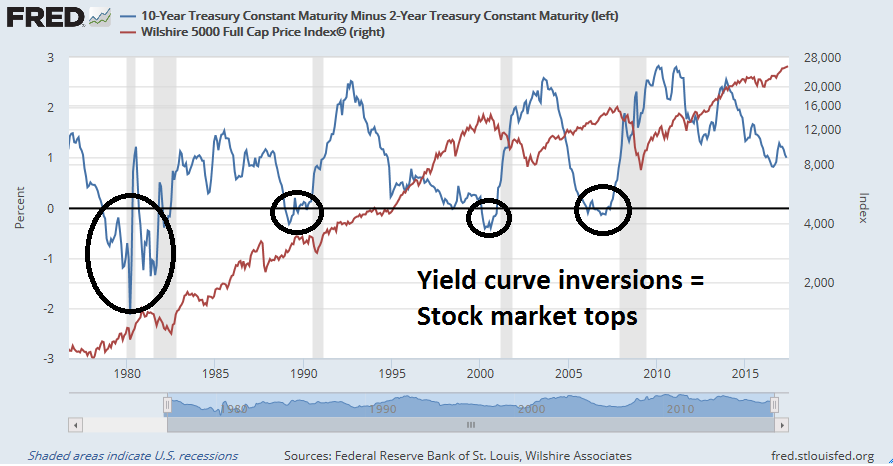
Let’s consider how the market might react to this “new reality”. Currently, the 2/10 yield curve stands at about 0.80%. Supposing the Fed were to hike again in September and signals that it will pause in December, but begin to reduce its balance sheet then, which is another form of tightening. 2-year yields adjust upwards by 50bp (25bp for the September hike and 25bp for a delayed effect from the June hike), while 10-year yields compress by 20-30bp. The result is a yield curve that gets very close to inversion. As the chart below shows, equity market tops have either coincided or shortly followed yield curve inversions in the past.
On top of that, we haven`t even considered the additional risk that the FOMC becomes more hawkish with the addition of Trump appointees to the Board of Governors (see More surprises from the Fed?), New governors are likely to adhere to the Republican audit-the-Fed orthodoxy of rules-based monetary policy.
That day of reckoning is not here yet, and such a scenario is purely speculative. Meanwhile, enjoy the reflation party.
The week ahead
Looking to the week ahead, the short-term technical direction is less clear-cut than it has in the past. Both the bull and bear cases are equally compelling.
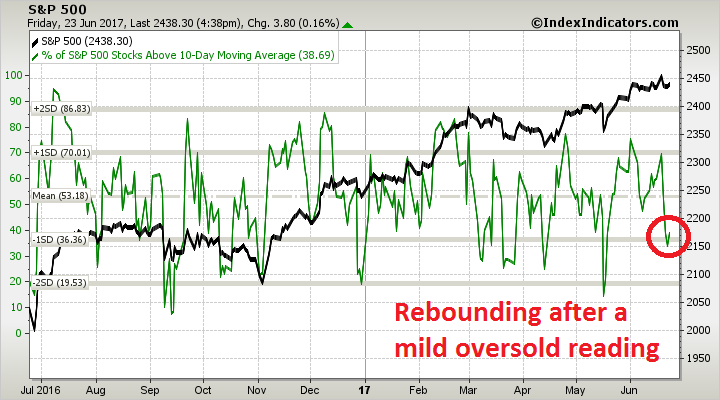
The short-term bull case can be summarized by this breadth chart from Index Indicators. The market is starting to rebound after a mild oversold reading, indicating a possible change in direction.
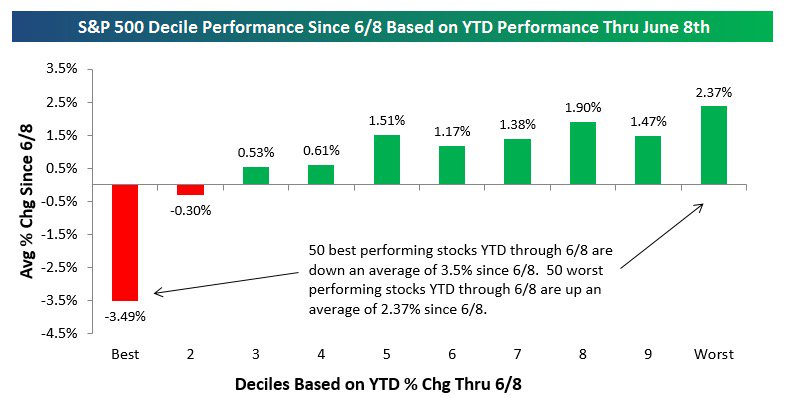
The correction that I have been calling for seems to have been accomplished in time rather than in price. As the chart below shows, the recent Tech correction appears to have been nothing more than just performance mean reversion and internal rotation.
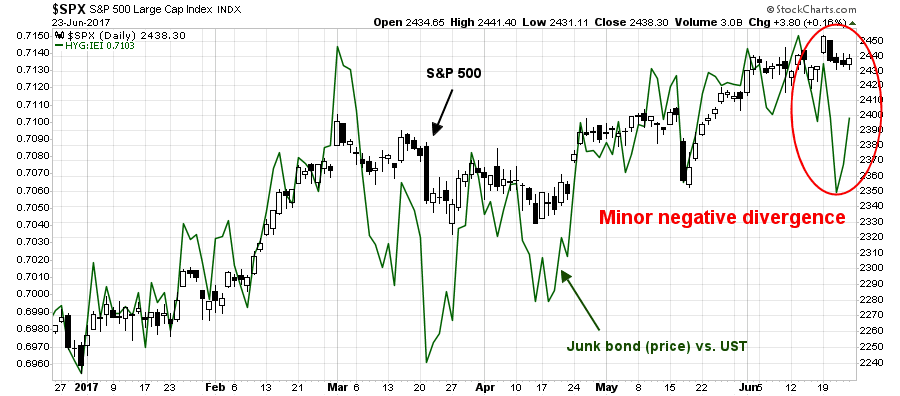
On the other hand, there are negative divergences everywhere that haven’t been resolved. I had cited the negative divergences that overhang the market (see A market breadth model that works) and the negative divergence seen in DJW at the beginning of this post. The chart below also shows a minor divergence between credit market risk appetite and the equity market.
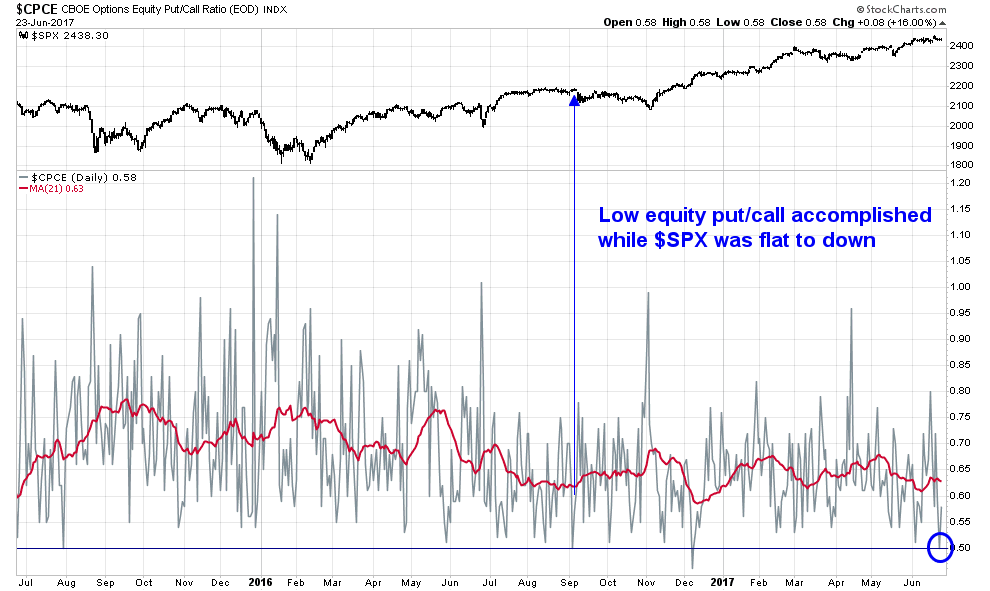
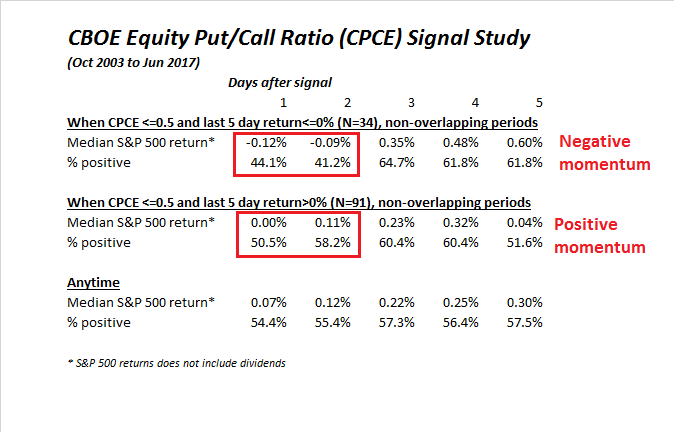
As well, option sentiment flashed an unusual contrarian signal on Thursday, when the CBOE Equity Put/Call Ratio (CPCE) fell to 0.50, which is a historically low reading. Thursday’s low CPCE was followed by an equally low 0.58 on Friday. What is unusual is this was accomplished when the stock market was flat to down. CPCE is normally low when the market is rallying, and a low put/call ratio is reflective of the growing bullishness momentum traders. The only instance in the last two years of CPCE at 0.50 or less on flat returns resolved itself with a minor pullback.
A longer term study of CPCE below 0.50 revealed a definite momentum effect. Forward equity returns tended to be strong when CPCE was low but past returns were rising, but forward returns were weak when CPCE was low but past returns were weak. However, that effect was short-lived and only last two days.
These cross-currents in the market has left my inner trader utterly confused. He is inclined to believe that the market is likely to trade sideways in a choppy fashion until either and upside breakout or downside breakdown is accomplished.
My inner investor remains constructive on equities. My inner trader is hanging on to his short position, though he may opportunistically cover his position on weakness and move to the sidelines.
Disclosure: Long TZA
Hi Cam,
Note that the Australian Stock Exchange is also being affected by a (temporarily?) weaker banking sector due to concerns about excessive household mortgage debt and a new Federal Government bank levy which was recently announced. Bank stocks make up about 25-30% of the market cap.
I am solidly bullish going forward. My readings in behavioral economics tells me to be on guard for ‘confirmation bias’ where people looks for articles which confirms one’s views. Experts in behavior tells us to search for things that are contrary to balance one’s thinking. I do that, as distasteful as it is.
The most negative thing I’ve read this week is a piece on forward earnings. They calculated that the big gain in second half S&P 500 projected earnings is predicated on strong energy industry earnings gains on the back of oil prices being forecast in the high $50’s. I’m in oil country and I know that crude forecast could be slashed at any time, sending the forward earnings into a tailspin.
The other negative thing is St. Louis Fed President, James Bullard’s, very learned ideas about why the Fed should stay on hold with no further raises. He has been the most accurate Fed official on the economy and interest rates. If others out-vote him and raise rates in a weak economic environment, that could have nasty outcomes. Here is his talk on Bloomberg and I suggest signing up at the Federal Reserve Bank of St. Louis to receive his media releases whenever they occur. He is a renegade at the Fed and his fresh ideas have been bang on.
https://www.stlouisfed.org/from-the-president/video-appearances/2017/bullard-bloomberg-us-monetary-policy-inflation?utm_source=FPUpdate&utm_medium=email&utm_campaign=FPContentUpdate
Ken
Like all trades, at some point, the oil trade is going to dissociate itself from general equities. As oil plumbs new lows, smaller companies will go under, the ones that survive, will bottom out, creating less of a downdraft to the S&P. Energy as a component of S&P is much lower than what it was at its peak. The adage “lower for longer” is applicable to oil at this juncture. At some point, the tax cut effect of oil should come into play.
Cam
When I see the FRED 2-10 curve, it appears that at 0.8% 2-10 year point in history, there were 2-3 years ahead for curve inversion and 3-5 years to equity peaks with another 30-50% capital gain, give or take. I am referring to points on the curve, with a “directionality” that is pointing down towards zero on the x axis and a subsequent inversion. I have ignored those 0.8% points on the curve where the directionality was pointing upwards on the 2-10.
Now, of course, the incoming Fed governors could cause havoc by raising the Fed funds rates too fast, one never knows. Until that time, barring 5-10% pull backs, with tight stops, one hopes the market remains buoyant. It appears staying long here is the hard trade.
As unemployment trends lower, the Fed would be fearful of “wage inflation” before general inflation. That said, there are powerful forces in the US economy that have been keeping wage inflation in check. So, the “new normal” on wage inflation and unemployment may not be at 4.5% unemployment, but say at 3% unemployment. There are no historical precedents to what I have written. Models and ideas like Phillips curve are not likely to work, and here is why:
The US economy is captive of a one time in history of automation causing attrition of human labor and a huge pool of long term unemployed (unemployed people more than six months). Furthermore, US economy is creating low wage jobs (the 25$ per hour General motors jobs are gone). The long term pool of unemployed Americans will be forced into low end of jobs, unless imported labor is able to take up the slack. There is also the “Uberization” of the US economy, by which what I mean is that existing plant and equipment (for lack of a better phrase), will be forced into higher productivity. So, my car that sits in the garage, can be driven for more miles, reducing demand for new cars. My lawn mower can be lent/rented to my neighbor, so that only one lawnmower is purchased and not two.
I have no crystal ball better than anyone else that tells me that this what the macro economy will do. Jim Bullard could well be on the right track and that would be hugely constructive for equities. That would also prove the bond market to be right. As the US ten year treasury approaches 2.00% the fear is of an impending recession. Another way to look at it is that it is indicating that Mr. Bullard will get it right, nothing more nothing less.
DV –
We are only a couple of quarter point rate hikes (or less) from a yield inversion. As I pointed out, the 2-year yield did not respond at all to the last rate hike. If we get more hawkish Fed speak and one more hike, plus some downward pressure in the 10-year, the yield curve gets very, very close to 0.
We can debate all day about whether Bullard is right or not, but he is outside the mainstream of FOMC thinking. What matters is what Yellen et al thinks. On top of that, there is the risk of the appointment of Republican audit-the-Fed rules-based governors to the Board, to which there are three vacancies.
Already, we have had Fedspeak from Williams (SF) and Dudley (NY) that have hawkish tones. Yellen is scheduled to speak Tuesday.
What would you bet on?
Cam
May you live in interesting times is more true for the last decade, I suppose, than any other time in recent history. One could have never imagined that loose money policies would last a decade since 2008.
The fed could well do the unthinkable here and keep on tightening, calling the bluff of the 2 year treasury. As you have indicated, the ten year note could well rally some, closing the gap with the two year treasury, getting the 2-10 year close to zero.
Bets aside, the inversion of the yield curve hangs on the market as a Damocles’s sword. It appears to have been a “hard” indicator, despite the lag effect between inversion and stock prices, I was alluding to earlier. I remember the time of the last significant tightening, circa 2005, give or take, that eventually killed the stock market, and the banking system with it. I have to concede here, to you, that the fed will likely do the unthinkable, and keep tightening. After all, that is what is historically true.
The stock market has made a clock work like habit of 50% market losses in the recent past (2000, 2007, ?? 2018-19). So, question I have for you, is how do you see a pull back in the markets? We are already seeing a (rounded) market top, here, or so it seems (time will tell). Recent market gains have been hard fought, which is what one expects close to a peak.
Cam, I totally agree. Bullard will be out voted and a policy error could happen. That is the possible 1937 disaster error repeated.
But like you say, too early to exit. Just be prepared.
Ken, would you kindly explain the history of (1929-) 1937 policy error? This market appears to be eerliry, tracking the 1929-32-37 trajectory. Thanks.
To make a long story short: The Fed misinterpreted signals of recovery and tightened too early and pushed the economy into a slowdown.
The start of the war in 1939 and Hitler subsequently overrunning Poland, Norway, Denmark, the Low Countries, and France didn’t exactly help the stock market either. (I know that American all think that World War II began on December 7, 1941, but the markets thought that it began much sooner than that).
The NYSE margin loan report is out today. It was down 1.7%, a very small move. This shows a cooling of speculation from the hot increases in the months before. But doesn’t indicate a change from greed to fear.
Doug Short’s blog is always best on the margin loan analysis every month. Here is this month’s just posted;
https://www.advisorperspectives.com/dshort/updates/2017/06/27/a-look-at-nyse-margin-debt-and-the-market