Preface: Explaining our market timing models
We maintain several market timing models, each with differing time horizons. The “Ultimate Market Timing Model” is a long-term market timing model based on research outlined in our post Building the ultimate market timing model. This model tends to generate only a handful of signals each decade.
The Trend Model is an asset allocation model which applies trend following principles based on the inputs of global stock and commodity price. This model has a shorter time horizon and tends to turn over about 4-6 times a year. In essence, it seeks to answer the question, “Is the trend in the global economy expansion (bullish) or contraction (bearish)?”
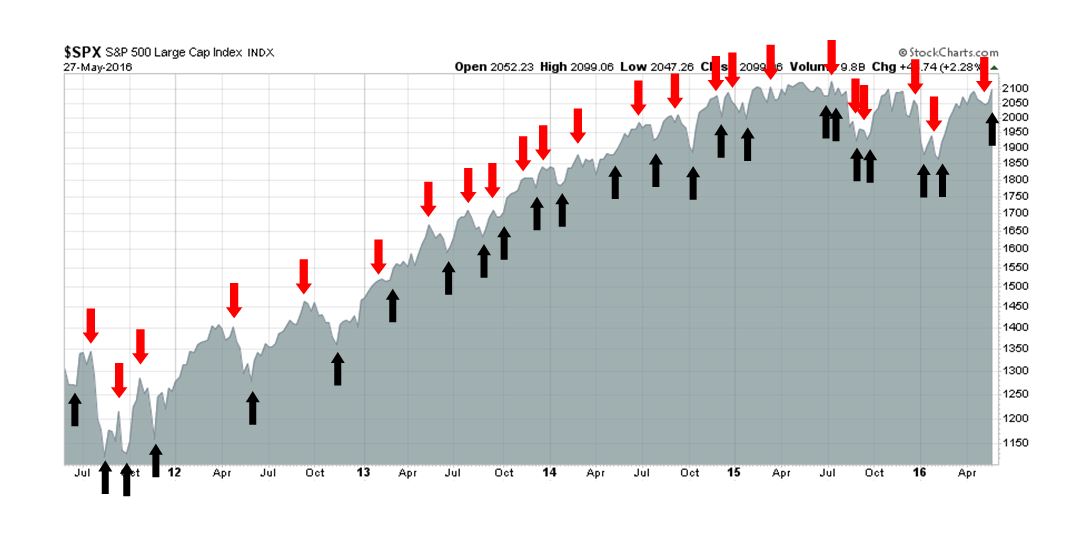
My inner trader uses the trading component of the Trend Model to look for changes in direction of the main Trend Model signal. A bullish Trend Model signal that gets less bullish is a trading “sell” signal. Conversely, a bearish Trend Model signal that gets less bullish is a trading “buy” signal. The history of actual out-of-sample (not backtested) signals of the trading model are shown by the arrows in the chart below. Past trading of the trading model has shown turnover rates of about 200% per month.
The latest signals of each model are as follows:
- Ultimate market timing model: Buy equities
- Trend Model signal: Neutral
- Trading model: Bullish
Update schedule: I generally update model readings on my site on weekends and tweet any changes during the week at @humblestudent. Subscribers will also receive email notices of any changes in my trading portfolio.
Not turning bearish yet
No, my inner investor isn’t turning bearish, but I believe it is prudent to be thinking about how a market top develops. The bull market that began in 2009 is getting mature and I am getting starting to watch for signs that a market top is developing. My analytical framework is as follows:
- Macro-economic analysis: I am grateful for the work by New Deal democrat in his recent post A roadmap to the next recession. This chart from Gene Epstein at Barron’s shows the risks to equities should economic growth stall and roll over. While stock prices can fall and correct at any time, the most severe declines have been associated with recessions.

- Growth and valuation: I think of stocks in terms of the two components of the PE ratio. First, how much is E like to grow? Second, will the P/E ratio expand or contract? The big question in the current environment is the intersection of growing E as the Fed embarks on a tightening cycle. How will stock prices respond as earnings rise, but higher interest rates puts downward pressure on the P/E ratio?
A roadmap to the next recession
In his post, New Deal democrat laid out a very sensible checklist for anyone watching for the next recession (comments in parentheses are mine):
- Interest rates continue to fail to make new lows. (Check: he means short rates).
- House prices and stock prices stop meaningfully appreciating. (Stocks, yes. Houses, not yet but it could be soon as sales lead prices – and sales have stalled).
- Inflation picks up to 2% or more as energy prices begin to go up again. (Check: see Core CPI).
- Maybe – the Fed raises rates in response to increased CPI readings, perhaps enough to invert the yield curve. (Yield curve is not inverted, but see the risks in my post Three steps and a stumble).
- Corporate lending stalls, housing turns down, and consumer spending begins to turn down, resulting in a recession.
The growth outlook
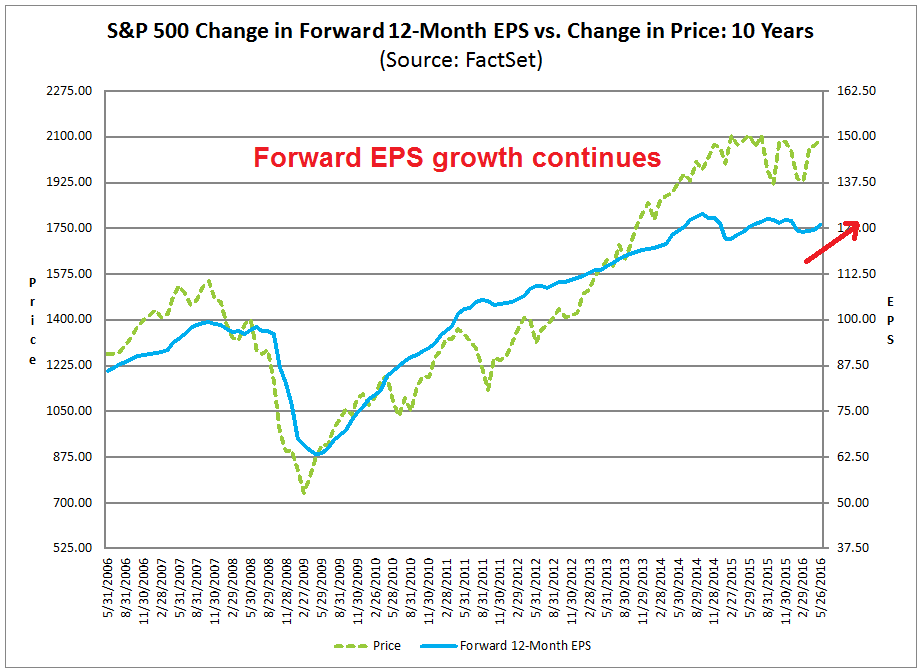
The second leg of my analytical framework is the growth outlook. Indeed, growth is returning after the recession scare in January and February. John Butters of Factset shows that forward EPS estimates continue to rise, as optimism is returning to the Street.
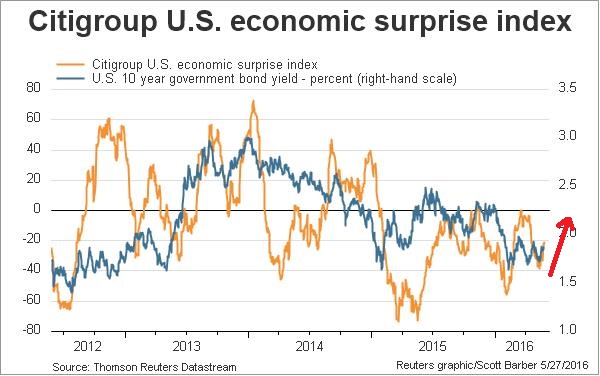
The Citigroup Economic Surprise Index (gold line), which measures whether economic data is beating or missing expectations, is on the rise again.
The big question is what happens to stock prices. During past rate hike cycles, equities have been able to shake off the first few rate hikes and rally in the face of tight monetary policy. The reason can be attributable to the positive effects of strong growth overcoming the negative effects of a rise in interest rates. A post by Jeroen Blokland indicates that history shows that Fed rate hikes have led to better returns by commodities and global equities.
The chart below shows the 10-2 year yield spread (in black, as a measure of the yield curve), the gold to bond price ratio (green, as a measure of inflationary expectations) and the Dow Jones Industrial Average (bottom panel). I chose the DJIA as an indicator because it contained relatively few technology stocks and therefore had fewer distortions from the NASDAQ Bubble of the late 1990s. In the past, when inflationary pressures (green line) ticked up, the Fed responded by raising rates and eventually inverting the yield curve. Stock prices were flat to up during those inflationary uptick episodes (marked by the red rectangles) for the reasons I mentioned above.
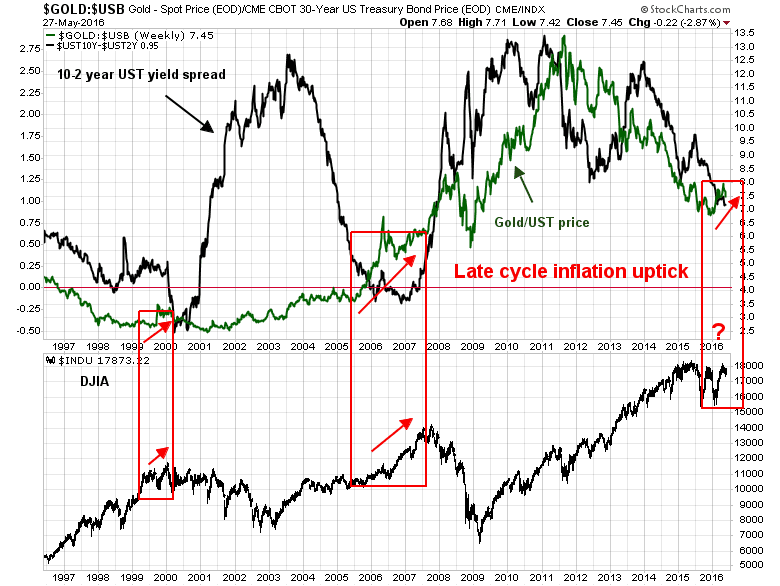
We are entering a similar period where inflationary expectations are starting to rise again. Based on past historical experience, stock prices should see new highs before rolling over into a bear market as the Fed over-tightens the economy into the recession.
Conventional analysis suggests that the next US recession should be fairly mild, as there have been few excesses built up in the current cycle. But the Great Financial Crisis taught us that the world is highly inter-connected. The main risks to the market and the economy comes from outside US borders. Europe is by no means fixed and European bank balance sheets are still very stretched. China`s challenges with its white elephant infrastructure and debt overhang are well known. So what happens when the US economic locomotive slows down and the American consumer stops spending?
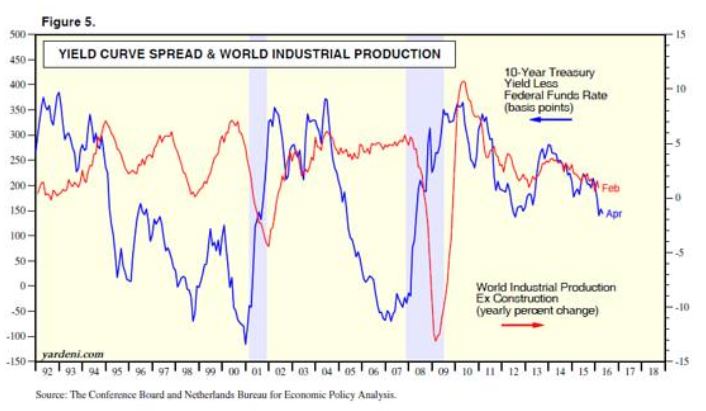
The WSJ reported that Ed Yardeni believes that the rest of the world is far more sensitive to a Fed rate hike than the American economy. Just take a look at the correlation (don`t say causation) between the Treasury yield curve and global industrial production.
Here is the Treasury yield curve and global trade.
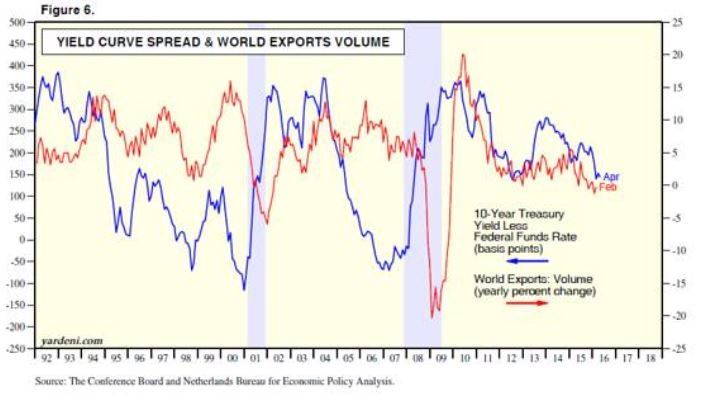
I can easily imagine a scenario where a slowing US economy puts the brakes on global trade and industrial production, which exposes the problems in China and European bank leverage. The aftermath would not be a pretty picture.
The road ahead
I do not write for Zero Hedge and this is not meant to scare anybody. So far, all we have is a “this will not end well” investment story. The trigger has not been pulled yet and growth is still holding up.
In a more bullish scenario that I had written about before, I postulated a similar roadmap, but with a more dovish Fed that was willing to hold its fire until the December meeting (see How the SP 500 could get to 2400 this year). Nevertheless, much of the analysis I wrote for that post still holds true. Earnings could rise another 5-10% from current levels as energy and commodity prices “`less bad”. Assuming no change in the P/E ratio, this would translate to a 5-10% rise in stock prices, which puts an upside SPX target of 2200-2300 for this year.
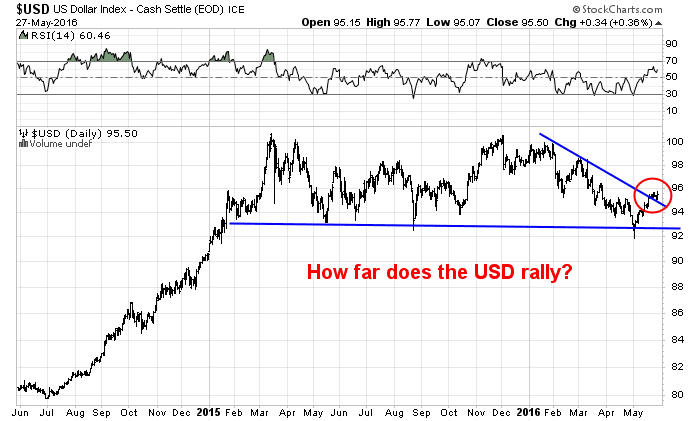
The unknowns are how Federal Reserve policy affects the yield curve and the US Dollar. USD weakness has provided a tailwind for stock and commodity prices, but the recent bout of strength could reverse many of those gains. A strong greenback puts downward pressure on the earnings of multi-nationals doing business outside US borders and further USD strength would exacerbate the negative effects of interest rate hikes.
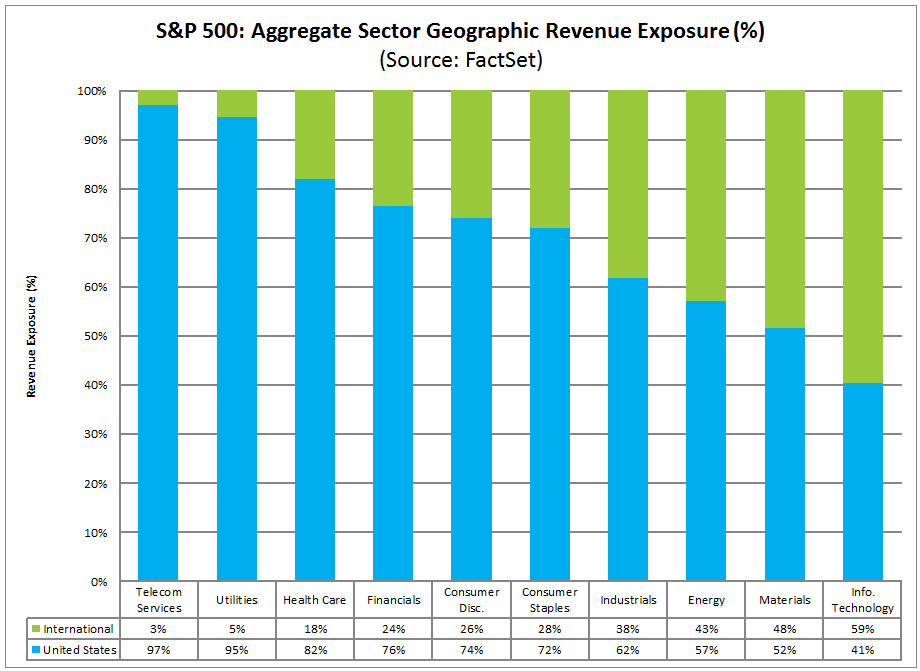
Analysis from Factset shows that the sectors with the greatest foreign sales exposure are Technology, followed by cyclically sensitive sectors like Energy, Materials and Industrial companies. In effect, USD weakness is a pro-cyclical factor, or a double-edged sword, affecting stock prices.
The near-term market outlook
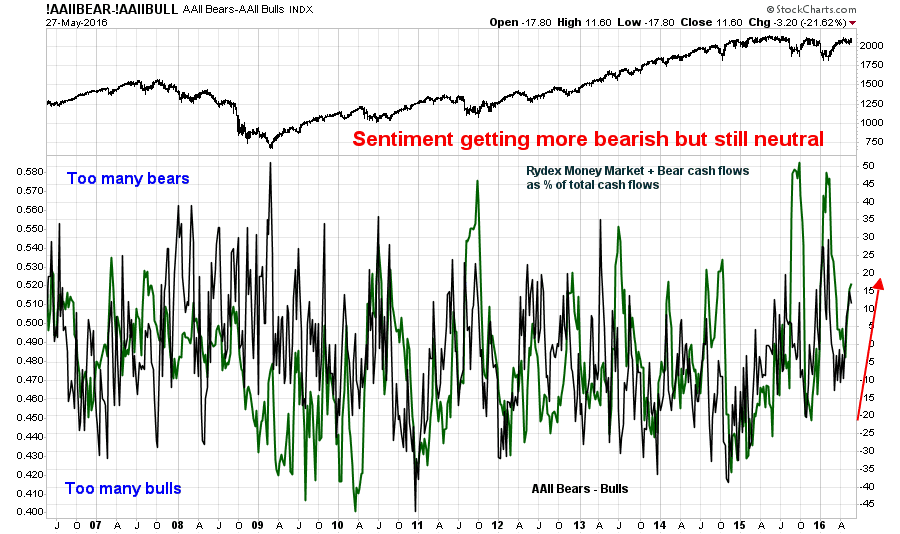
For now, the short and intermediate term stock market outlooks are still bullish. Sentiment readings are neutral to bearish, which means neutral to contrarian bullish for stocks. My inner trader is encouraged by the continual bearish tilt in sentiment despite the strong rally last week.
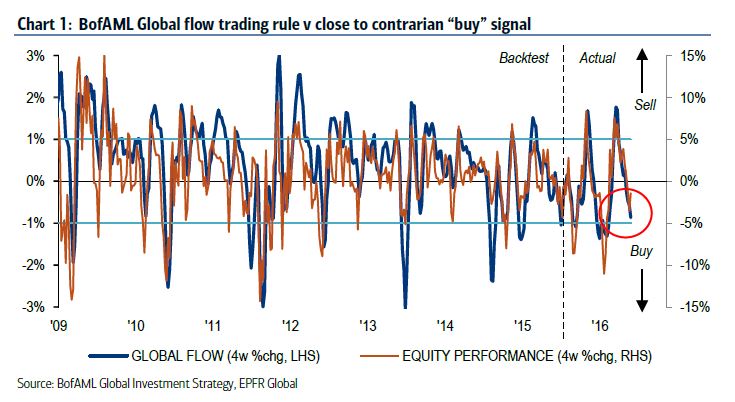
Michael Harnett of BoAML indicated that their global fund flows model is getting very close to a buy signal (via Marketwatch):
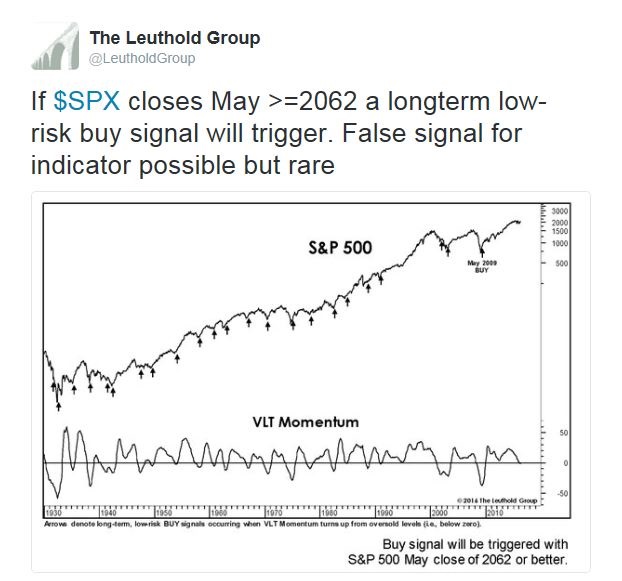
Momentum is still positive and Leuhold Group wrote it was getting close to a buy signal should the SPX close May above 2062 (it currently stands at 2099). The pending Leuthold Group signal is consistent with my thesis that the market can make new highs in 2016.
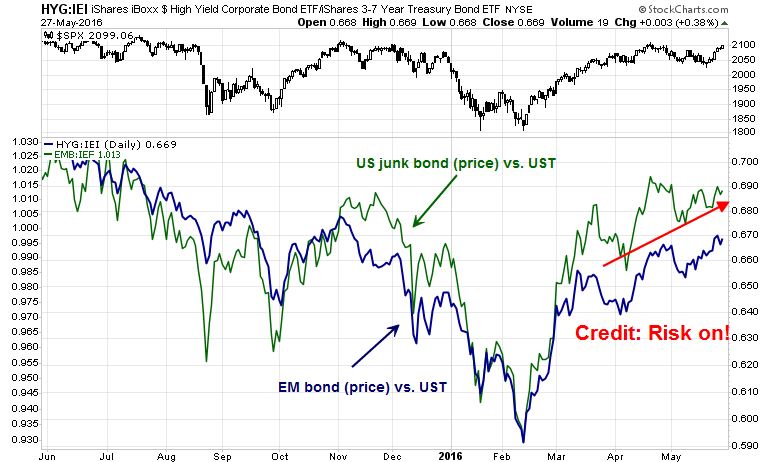
The message from the credit markets is also supportive of higher stock prices. The chart below of the prices of US junk bond and emerging market bond against their duration equivalent US Treasury benchmarks shows a pattern of higher lows and higher highs, which is reflective of improving risk appetite.
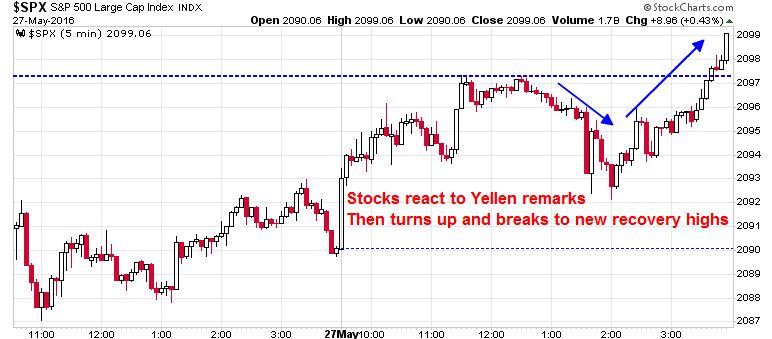
Even the market reaction on Friday to Janet Yellen’s comments was revealing. It first weakened as Yellen indicated that a rate hike was just around the corner. It then shrugged off the bearish content and rallied to new recovery highs. This was a sign that the bulls have control of the tape.
My inner trader flipped from bearish to bullish last week (see The correction is (probably) over). My inner investor remains bullish on stocks, but he is carefully monitoring the recession indicators in the Ultimate Market Timing Model (see Building the ultimate market timing model) for signs that the Fed is engineering a recession in 2017.
Disclosure: Long SPXL
From the chart above, stock prices fall in anticipation of recessions, and the point of the exercise should be to know when the fall might start, not the recession itself. Some of the checklist points occur too late for that.
Essentially it is all about inflation and the interest rate means to control it. Recessions might be viewed as arising from over-controlled responses to inflation due to lags in the system (waiting for the latest inflation read; lag from rate action to effect). Rates overshoot inflation, the economy brakes, rates are relaxed. I suspect the Fed is attempting to be more preemptive this time, which is why they are surprising the markets.
The Fed may succeed by causing a milder recession. But don’t we need debt extiction?
No model will get you out at the exact top or get you in at the exact bottom. These models are intended you to enjoy the fruits of equity ownership (historical returns better than stocks) but without the really ugly 30-50% downturns that come around during recessions.
Once you recognize a recession is on the horizon, you should be able to sell out with a 10-20% drawdown. Drawdowns of 10-20% happen all the time and they represent the normal risk of equity ownership. If you can’t stand a 20% loss, then you need to either diversify enough away that 20% becomes less (e.g. 10% with a 50% equity, 50% bond or cash allocation), or, at worse, not be in equities at all.
in June, Dollar and RMB+china poicy might be the concern. after fed hike in june/july, the market has more chance to lift off, if dollar rally pauses after the hike.
I still maintain that the increased EPS chart is merely a case of financial engineering. The data for S&P 500 total earnings indicate no change from 2011 to present ( see: http://www.seeitmarket.com/mind-gap-bull-market-lost-sight-earnings-growth-15706/). The changes in EPS are due to reductions in shares outstanding rather than increases in corporate earnings. I believe that a high P/E ratio may be warranted for a company that is actually growing its business. I do not believe it is warranted for one that is simply using cheap debt to buy out some of the owners.
Banks can make lots of money but with little prospect of growth. Hence the market values them at a P/E of 12. Most S&P companies should be valued similarly in my opinion.
There are several issues to address here:
1) Buybacks: See comment about funding for buybacks came from mainly with internally generated cash flow: https://twitter.com/bySamRo/status/737031725272993794
2) P/E ratio: The forward P/E for this market is 16.7 (E/P = 6.0%) and trailing P/E is 18.7 (E/P = 5.3%). With the 10-year UST below 2%, what is the alternative? You can rail about Fed manipulation, yadda, yadda yadda, but this is a low-return environment.
If you are postulating a higher bond yield, then you won’t get one unless the bond market believes that growth is going to be much higher. In that case, higher growth = higher P/E.
I cannot emphasize strongly enough the profound change in financial markets since December 16, 2015. That was the day of the first Fed rate hike for eight years. Everyone thought the lid would come off the artificially low rates and we would ramp up to “normal” rates of 4-5%. But something totally unexpected happened. The long Treasury bond went DOWN 50 basis points over the next two months not up. This is leading to a huge reset in investors outlook to “lower for longer” future rates.
EVIDENCE: Dividend ETFs have outperformed the S&P 500 by 10 full percent since December. Before that, they rose and fell in tandem. 10% over 4 months is VERY unusual.
I believe stock markets are extremely cheap based on dividend yield versus bonds now that the interest rate future has turned tame.
Roy, the accountants can fudge the P&L but dividends are a solid number and they are rising. You can get a 4% yield on the Select Dividend ETF when the ten year bond is at 1.71%. What is the better bargain? If the yield goes from 4 down to 3%, the share price would go up 25% plus you get the dividend. Plus the dividend will
We are in a new era that emphasizes dividend yield. Expect good dividend stocks to perform even if the E in the PE ratio is flat.
Already we see consumer staple and utility stocks leading the market. Looking at them conventionally they have a very high PE versus history. Strategists are saying to avoid them. But in a world that focuses on yield, they will continue to lead.
The demographics of investors says retiring people will search for yield. They are and will gravitate to yield stocks. Portfolio managers will miss this winning trend because they focus on corporate profits and historic PEs.