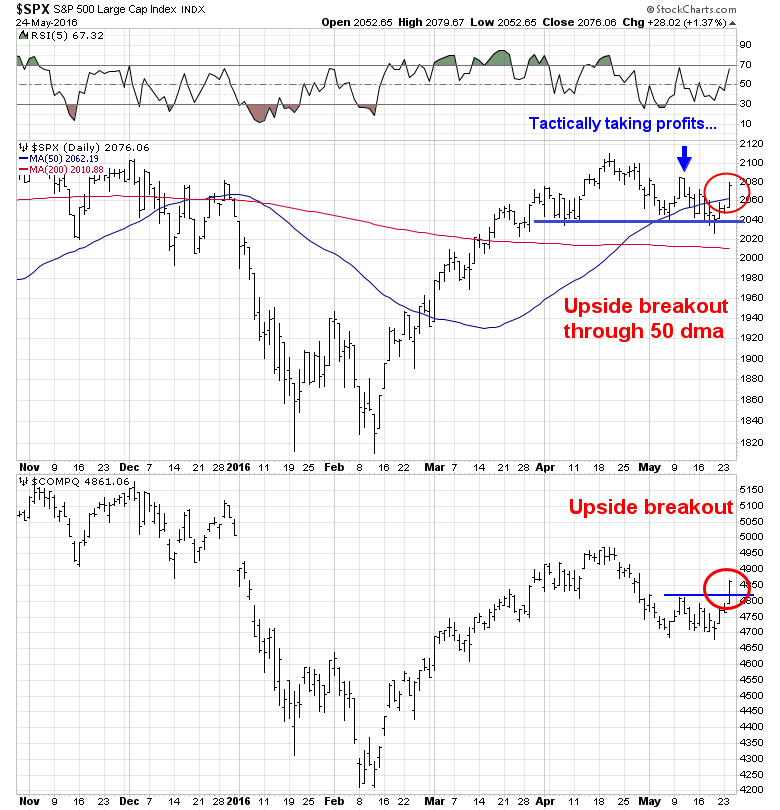
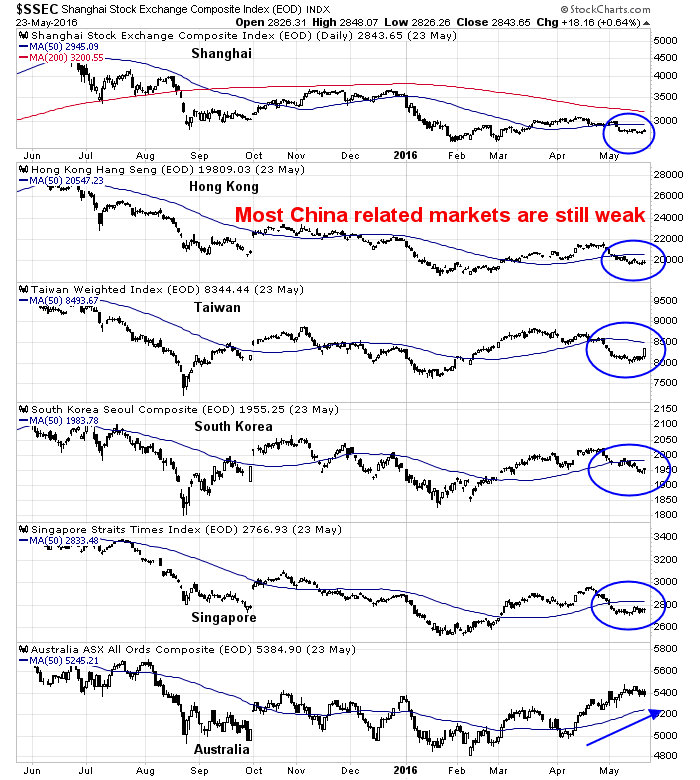
Mid-week market update: About two weeks ago, my inner trader turned cautious on the US stock market (see my tweet and subsequent post Tactically taking profits in the commodity and reflation trade). I had cited as reasons the weakness from China, the commodity markets and, later, Europe (see Waiting for the storm to pass), which was based on inter-market and cross-asset analysis. (Though my inner investor remained constructive on stocks.)
Since then, the SPX weakened to test an important technical support at 2040, which represents the neckline of a potential head and shoulders formation. (As all good technicians know, a head and shoulders formation isn’t complete until the neckline is broken.) While the market did break 2040 last week on an intra-day basis, neckline support held. In addition, the NASDAQ Composite confirmed the strength today by staging an upside breakout through resistance.
At the time of the bearish trading call, I said that I would turn bullish if:
- The US stock market got oversold and sentiment models flashed a crowded short reading; o
- The stock markets improved in Europe or Asia.
The bull case
Rob Hanna at Quantifiable Edges found a historical bullish pattern based on the recent consolidation action that suggests a positive bias going out to two weeks.


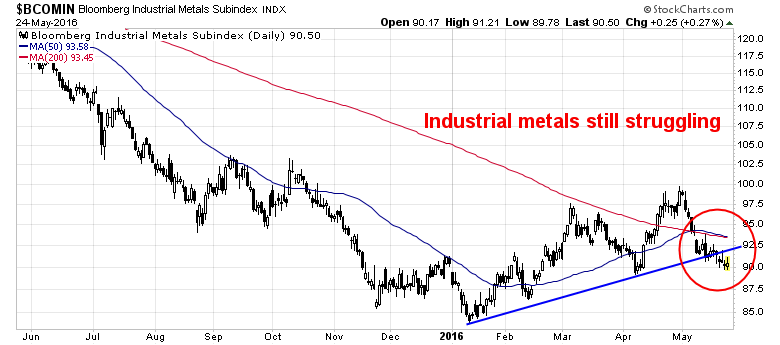
On the other hand, the cyclically sensitive industrial metals are still struggling:
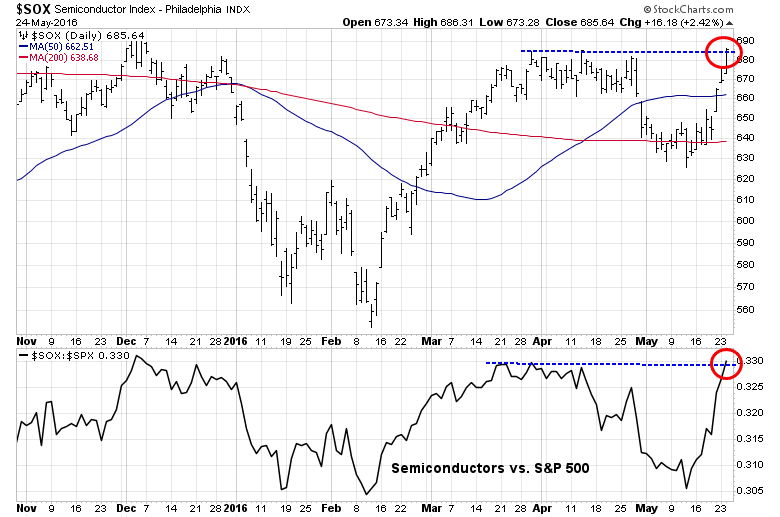
Another positive cyclical development has been the dramatic rally in the semiconductor stocks, which staged a marginal upside breakout from resistance on an absolute (top panel) and relative (bottom panel) basis. While these stocks appear to be extended in the short term, their turnaround is a positive signal for the global growth outlook.
The bear case
Bear case getting less bad
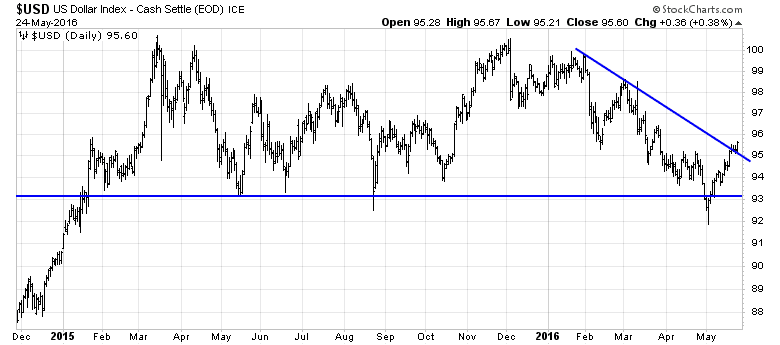
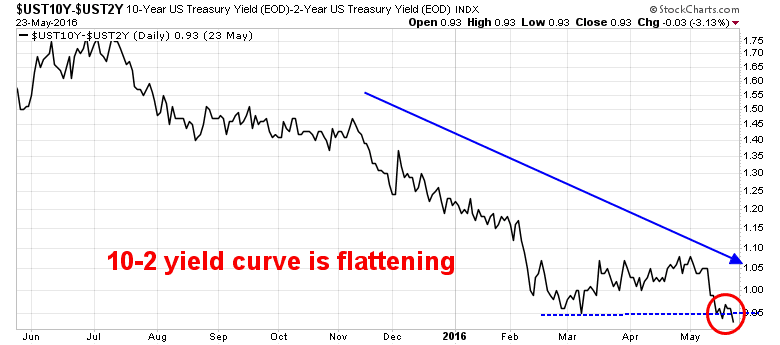
The bear case getting less bad. This is mostly all about the Fed. The price action of the USD and the flattening yield curve can be explained by the sudden hawkish Fedspeak in the last couple of weeks after the dovish tone from the last FOMC statement. Tim Duy summarized the disagreement within the FOMC as a debate over whether the economy faces inflationary pressures from the employment picture, as the decline in the unemployment rate has stalled because the participation rate is rising again:
To me then, it appears that by raising rates now the Fed is risking falling short on its employment mandate at a time when the price mandate is also challenged. And falling short on the employment mandate now suggests an economy with sufficient slack to prevent reaching that price mandate. And that is without considering neither the balance of risks to the outlook nor the possibility that escaping the zero bound requires approaching the inflation target from above rather than below. Consequently, it seems that the case for a rate hike in June should be quite weak.
I would think that Federal Reserve Chair Janet Yellen should also find it quite weak. But the minutes of the April FOMC meeting and recent Fedspeak indicate that a large number of monetary policymakers find the case for a rate hike quite compelling. Given her past concerns regarding underemployment, I would have expected Yellen to lean stronger in the opposite direction. But I don’t know that she is in fact leaning against the logic driving a rate hike. I am hoping we learn as much via her upcoming speaking engagements.
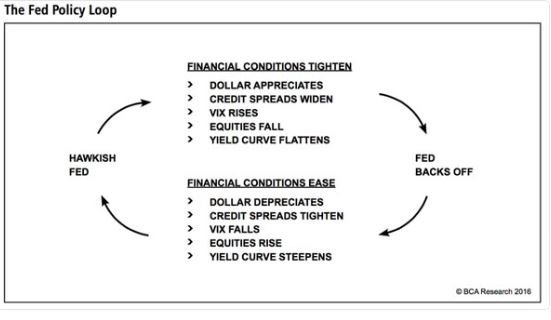
Hopefully, we should get greater clarity about the direction of Fed policy when Janet Yellen speaks on June 6. My guess is that Yellen, who was trained as a labor economist, tilts towards the side of the doves and the Fed Policy Loop begins yet again.
From my inner trader’s perspective, the improvement in tone in stock prices represents an unconfirmed signal of strength. Things are getting less bad – and that`s bullish. Should the market hold the breakout points (SPX 50 dma, FTSE 100 50 and 200 dma, etc.) tomorrow on a closing, he will cover his current short position and reverse to the long side. This brief correction is probably over.
Disclosure: Long SPXU
Did you switch to LONG already, Cam?
to be precise: did your “inner trader” switch to long?
Yes I did.