Preface: Explaining our market timing models
We maintain several market timing models, each with differing time horizons. The “Ultimate Market Timing Model” is a long-term market timing model based on research outlined in our post Building the ultimate market timing model. This model tends to generate only a handful of signals each decade.
The Trend Model is an asset allocation model which applies trend following principles based on the inputs of global stock and commodity price. This model has a shorter time horizon and tends to turn over about 4-6 times a year. In essence, it seeks to answer the question, “Is the trend in the global economy expansion (bullish) or contraction (bearish)?”
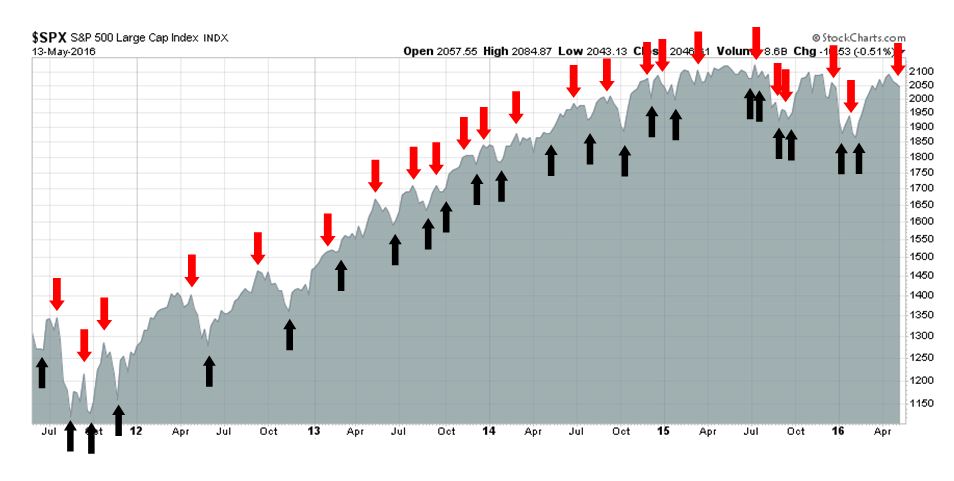
My inner trader uses the trading component of the Trend Model to look for changes in direction of the main Trend Model signal. A bullish Trend Model signal that gets less bullish is a trading “sell” signal. Conversely, a bearish Trend Model signal that gets less bullish is a trading “buy” signal. The history of actual out-of-sample (not backtested) signals of the trading model are shown by the arrows in the chart below. Past trading of the trading model has shown turnover rates of about 200% per month.
The latest signals of each model are as follows:
- Ultimate market timing model: Buy equities
- Trend Model signal: Neutral
- Trading model: Bearish
Update schedule: I generally update model readings on my site on weekends and tweet any changes during the week at @humblestudent. Subscribers will also receive email notices of any changes in my trading portfolio.
Don’t panic, it’s only a correction
My last blog post created a bit of a stir among readers as I was inundated with questions (see Tactically taking profits in the commodity and reflation trade). To reiterate, I made a trading call to get more cautious based on a developing slowdown coming from China, which was signaled by falling commodity and Asian stock prices.
At worst, this growth scare will result in nothing more than a minor US equity correction. The intermediate term outlook remains bullish. How would you feel about equity prices if I told you:
- Earnings are continuing to recover
- Fed policy is dovish and equity friendly
Investors just have to wait out the storm.
The earnings recession is over
Deutsche Bank’s Binky Chadha argues that the worst is over and earnings growth is coming back.
Like, right now.
“Time for a significant inflection,” Chadha writes. “The 5 drivers imply a combined boost of 8.2% to Q2 SP 500 earnings; after -6.3% in Q1 to slightly positive growth of +1.9%. The bottom-up consensus presently sees only a modest turn, to -4.7%.
Adding: “The differential between our top-down arithmetic and the bottom-up consensus suggests downgrades should stop and indeed they have paused recently and eventually lead to upgrades or positive surprises.”

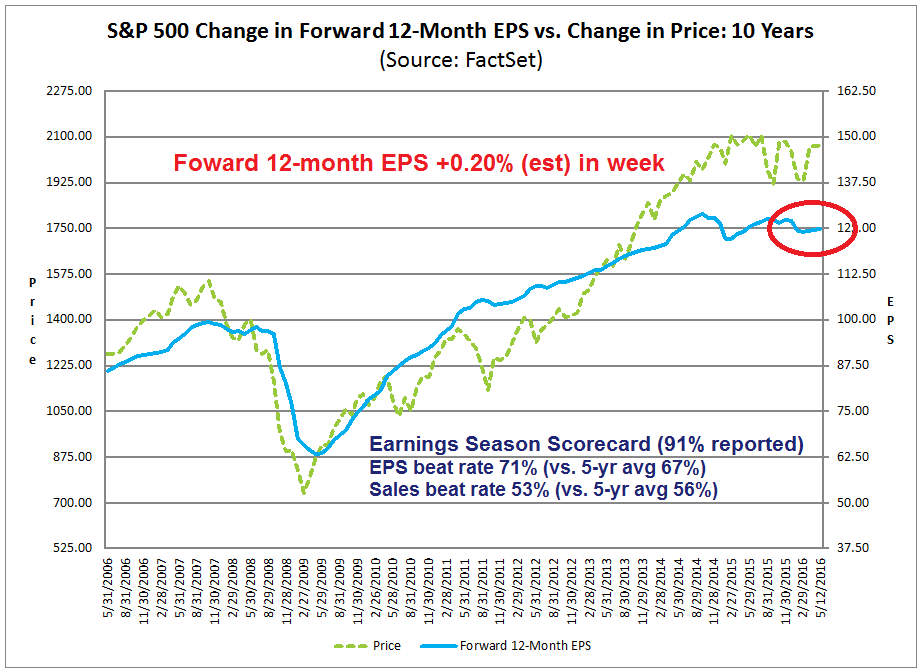
Indeed, the latest update from John Butters of Factset confirms Chadha’s thesis, as forward EPS are continuing to rise. With Q1 Earnings Season almost over, the EPS beat rate was above historical norms, though the sales beat rate fell short. In a separate note with bullish overtones, Michael Amenda at Factset pointed out that EPS beats came mainly from margin expansion, which is a reflection of better operating metrics, and not financially engineered share buybacks.
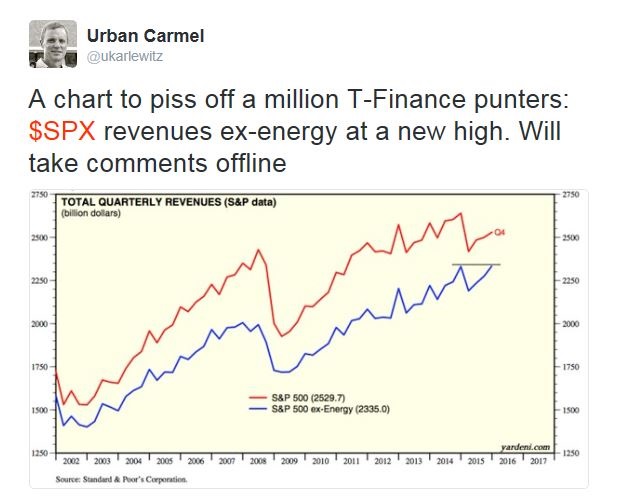
Chadha’s projection of roughly 8% YoY EPS growth at year-end is well within my estimate of 5-10% capital appreciation from EPS growth (see How the SP 500 could get to 2400 this year). A tweet from Urban Carmel indicated that revenues ex-energy reached a new high. As commodity prices have recovered some of their losses, a “less bad” result can easily translate to EPS and sales gains for the overall index.
Tack on another 5-15% in the form of P/E multiple expansion from a dovish Fed and the growth surprise projected by Chadha, the SPX target of 2400-2500 is well within reach this year.
An equity friendly Fed
Binyamin Appelbaum of the NY Times recently conducted a long and revealing interview with New York Fed President Bill Dudley (see the full interview here). Dudley is an important member of the Yellen-Fischer-Dudley triumvirate at the Fed and therefore his remarks are well worth considering. Here is a summary, which I made in conjunction with Gavyn Davies’ interpretation:
- Dudley thinks that the benchmark GDP growth rate is 2%. Anything above that is inflationary, but the Fed is willing to allow the economy to run a little “hot” in order to get to full employment.
- The economy will get “hot” as GDP growth rises above 2%, which should drive down the unemployment rate and push the economy closer to full employment.
- He is reassured by the fact that core inflation has remained about 1.6% while the dollar and oil have been operating to reduce inflation in recent quarters.
- Dudley is not worried about the downward drift in inflationary expectations. He is more concerned about declining inflationary expectations in the Eurozone and Japan, where he believes that monetary policy has been less successful than it has been in the US.
- There is no sign of concern that the US may be dragged into secular stagnation by events abroad. For him, the main signal of this happening would be a rising dollar.
- Recession risks are low because the Fed does not have to be pre-emptive and because he cannot see any major shocks at home or abroad. Moreover, there doesn’t seem to be the kinds of excesses that get unwound during typical recessions.
Reading between the lines, the Fed is unlikely to raise rates in June. They will likely wait until September to make a decision. At that time, if they see GDP growth at 2% or more and unemployment ticking down, then it may be time to tap on the brakes.
Stalling employment growth
The employment picture may not improve as the FOMC expects, however. We are starting to see signs of weakness in employment growth. First, the Labor Market Conditions Index, which is a leading indicator of employment growth, is stalling. YoY growth went negative in January, which appears to be worrisome on the surface, but it recently rebounded to a “less bad” reading.

In addition, temporary hiring, which is another leading indicator of employment growth, is also decelerating. While we only have two full cycles of this data series, past instances of negative growth have preceded recessions. Current conditions are showing that temporary employment growth is starting to sputter, but readings are nowhere near the danger zone.

When I put these indicators together, it may be difficult for the Fed will find compelling reasons to raise rates based on jobs market conditions at the September meeting. Moreover, the FOMC is likely to be extra cautious as a rate hike just ahead of a presidential election could be seen as a political act. A move at the December meeting is far more likely.
So let’s recap the fundamental and macro picture. Equity earnings are recovering and likely to continue to rise (therefore the E in the P/E ratio will be growing). The Fed will probably to stay on hold, possibly until the December meeting and beyond, which is supportive of an expanding P/E ratio.
So stock investors have little to worry about.
The storm from abroad
For traders, it’s a totally different story altogether. I detailed in my last post my concerns about the market signals of slowing Chinese growth (see Tactically taking profits in the commodity and reflation trade). The Chinese economy is showing signs of slowing growth (via Reuters):
China’s investment, factory output and retail sales all grew more slowly than expected in April, adding to doubts about whether the world’s second-largest economy is stabilizing.
Growth in factory output cooled to 6 percent in April, the National Bureau of Statistics (NBS) said on Saturday, disappointing analysts who expected it to rise 6.5 percent on an annual basis after an increase of 6.8 percent the prior month.
China’s fixed-asset investment growth eased to 10.5 percent year-on-year in the January-April period, missing market expectations of 10.9 percent, and down from the first quarter’s 10.7 percent.
Fixed investment by private firms continued to slow, indicating private businesses remain skeptical of economic prospects. Investment by private firms rose 5.2 percent year-on-year in January-April, down from 5.7 percent growth in the first quarter.
“It appears that all the engines suddenly lost momentum, and growth outlook has turned soft as well,” Zhou Hao, economist at Commerzbank in Singapore, said in a research note.
“At the end of the day, we have acknowledge that China is still struggling.”
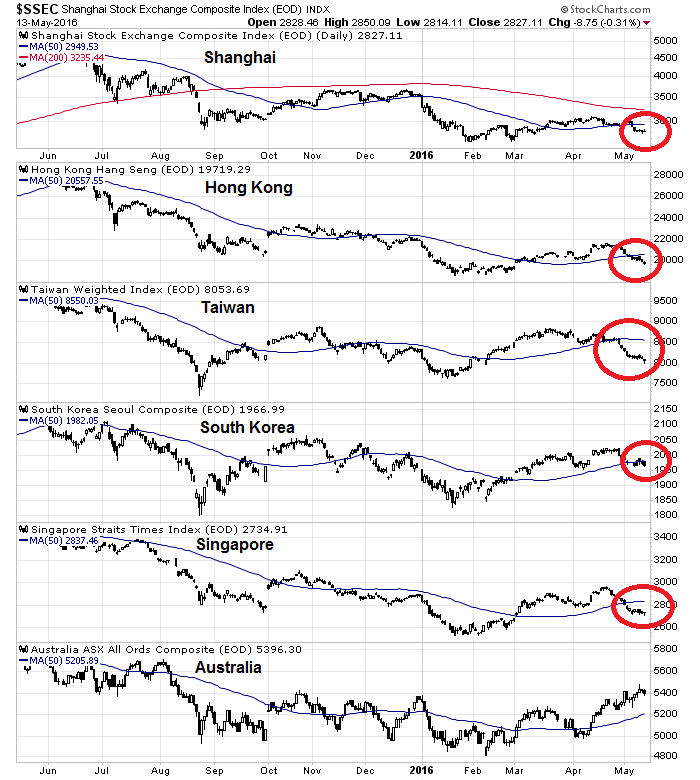
In response, the stock indices of China’s major Asian partners have all weakened below their 50 day moving averages (dma), except for Australia.
More importantly, industrial metal prices are breaking down, as they have fallen below both their 50 and 200 dma lines.

Crude oil prices are a bit firmer, as they may have been buoyed by supply disruptions from the Alberta wildfires, but how long can that last?
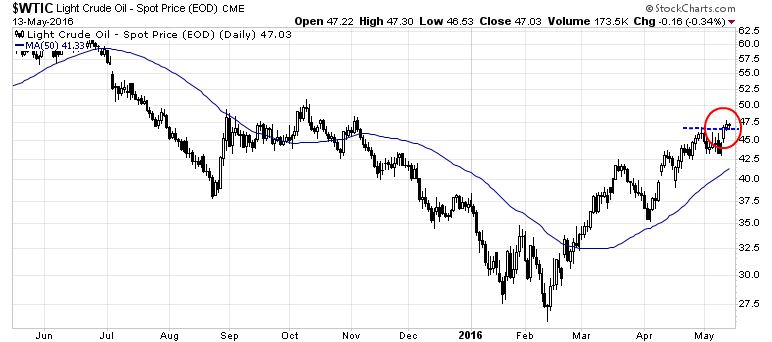
Nautilus Research found that the history of past oil rallies without the participation of copper has not been kind for crude prices,

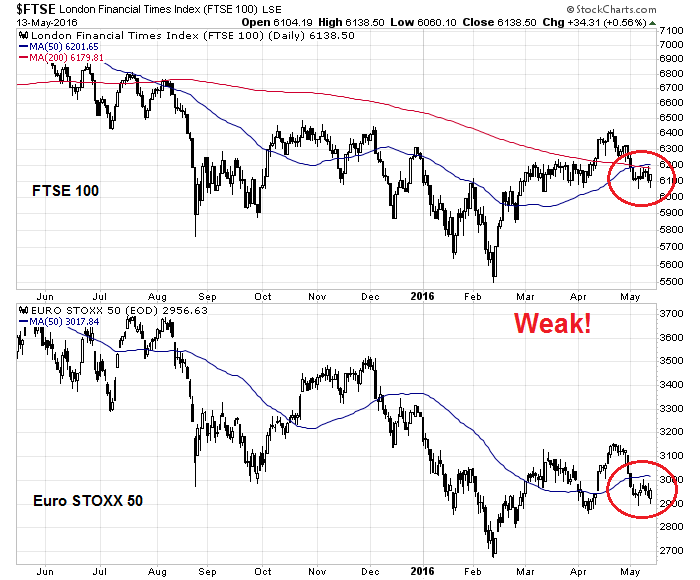
European stock prices have also misbehaved, as both the FTSE 100 and Euro STOXX 50 have violated key moving average support levels.
A shallow correction
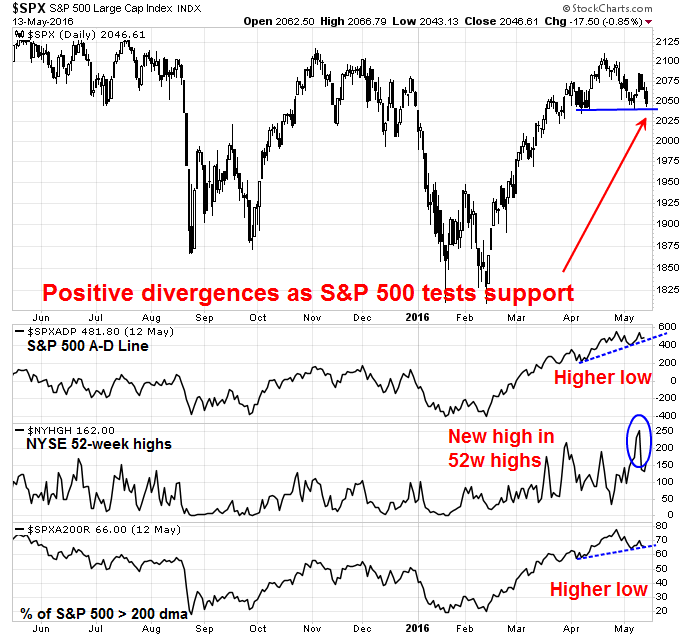
Despite these negative signals from cross-asset and inter-market analysis, I am expecting only a shallow correction. Breadth indicators remain supportive of the bull case and that is likely to put a floor on stock prices.
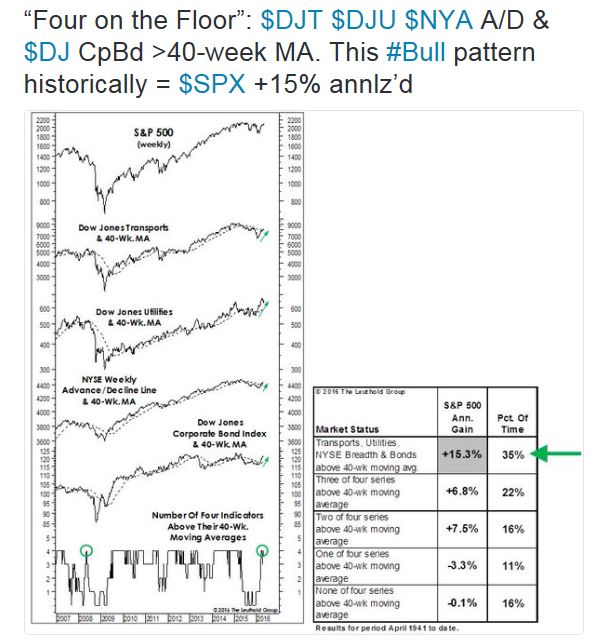
In addition, Leuthold Group highlighted their “Four on the Floor” breadth signal, where the DJ Transports, DJ Utilities, NYSE A-D Line and the DJ Corporate Bond Index are all above their 40-week moving averages. The historical experience after such signals have been equity bullish.
Sentiment models never got to a crowded long reading. Current sentiment conditions are best described as neutral and getting more bearish. The lack of a crowded long position at the start of the current market downdraft point to limited downside risk.

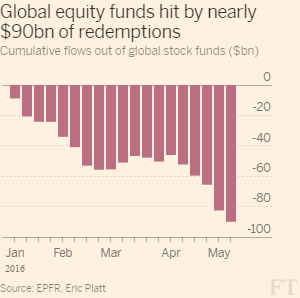
As well, an FT report indicated that outflows from equity funds are about $90b this year. This put equities “firmly” on track for their biggest year of redemptions since 2011, according to data provider EPFR.
Bear markets simply do not start with sentiment at such high levels of skepticism.
The “tell” from sector leadership
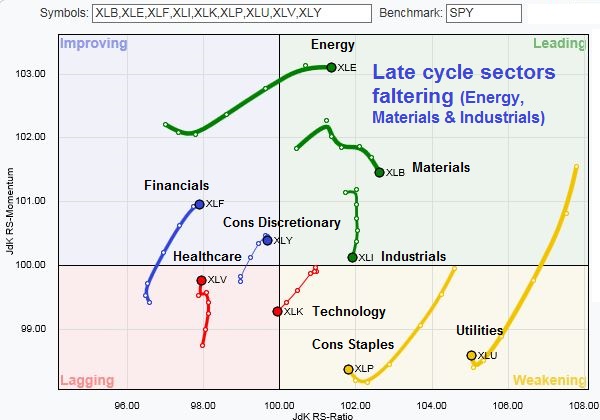
If the bulls were to make their stand at or about the current levels, then we need to see some signs of a healthy internal sector rotation. If resource extraction sectors such as Energy and Materials were to falter in their market leadership, then some other sectors need to step up and display superior relative strength, other than the defensive ones like Consumer Staples and Utilities.
I have been watching the Relative Rotation Graphs (RRG) for some clues of how sector leadership might change. RRG™ charts show you the relative strength and momentum for a group of stocks. Stocks with strong relative strength and momentum appear in the green Leading quadrant. As relative momentum fades, they typically move in a clockwise direction into the yellow Weakening quadrant. If relative strength then fades, they move clockwise into the red Lagging quadrant. Finally, when momentum starts to pick up again, they shift clockwise into the blue Improving quadrant.
As the RRG chart below shows, late cycle sector leadership (Energy, Materials and Industrials) is starting to falter. Possible up and coming sectors are the Financial and Consumer Discretionary stocks.
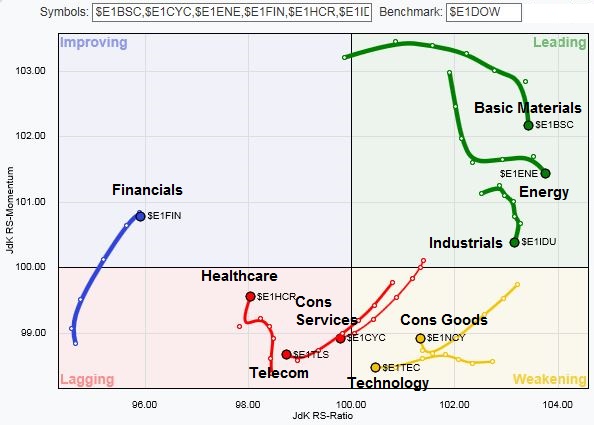
As a check on my RRG analysis of the US equity market, I looked at the RRG for European stocks, which shows a similar pattern. The same late cycle sectors are weakening. Financial stocks are improving, but Consumer Services and Consumer Goods remain weak.
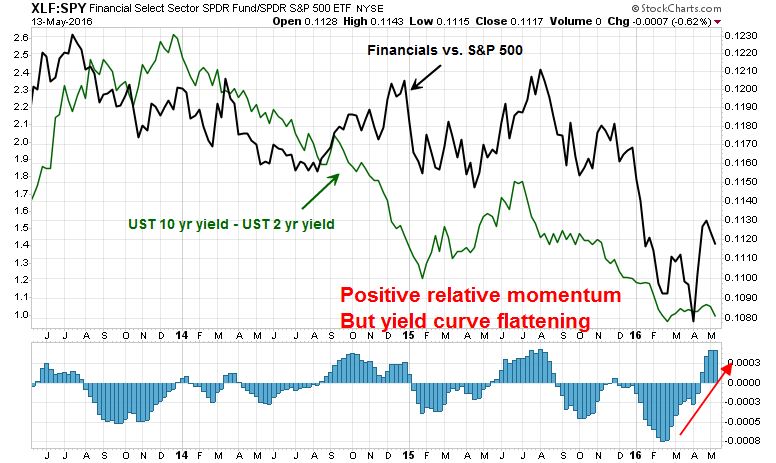
The relative performance of Financial stocks is not encouraging. True, the sector is showing signs of recent positive relative momentum, but the relative returns of these stocks have been correlated with the shape of the yield curve. Unfortunately, the yield curve is flattening, which suggests limited relative upside for these stocks.
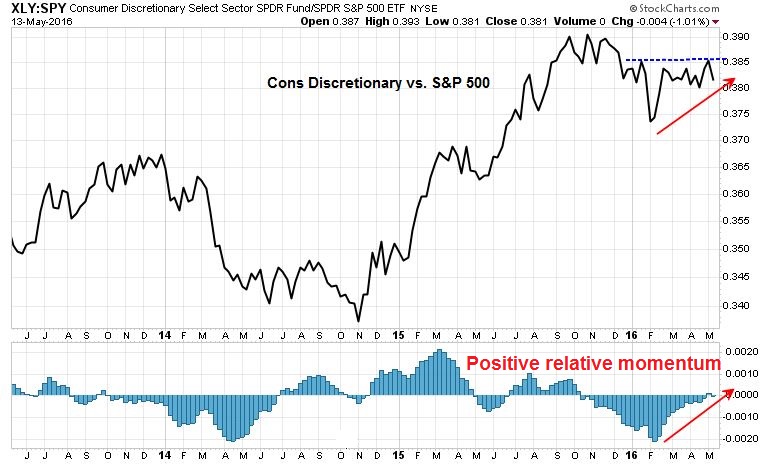
Here is the relative performance chart of Consumer Discretionary stocks. While the chart pattern appears to be constructive and the sector is showing positive relative momentum, it does face nearby overhead resistance. In addition, the nascent relative strength of the US Consumer Discretionary sector has not been confirmed in Europe. If a newly resurgent Consumer Discretionary sector is the best hope for the bulls, then it appears to be a slim hope.
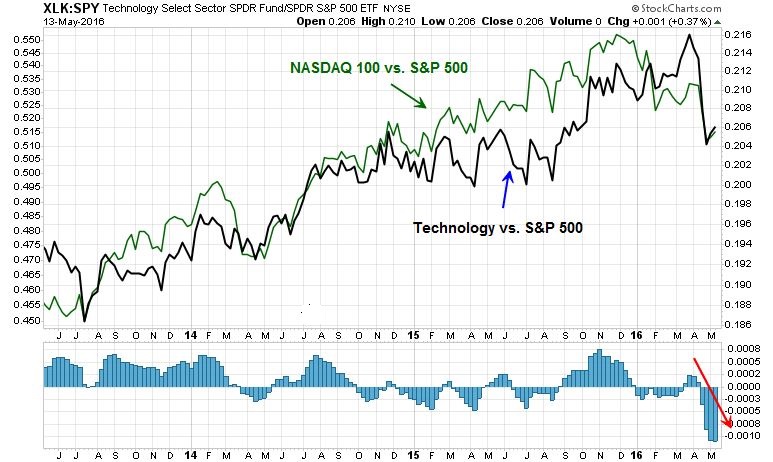
For completeness, I have shown the relative performance of Technology stocks and the NASDAQ 100, the trader’s favorite group. While these stocks seem oversold could recover and turn upwards, my inner bull isn’t overly enthused about making a big bet on that outcome.
Waiting for a bottom to develop
My base case scenario calls for a correction within an intermediate uptrend for US stocks. The combination of positive fundamentals, breadth and supportive sentiment readings are all likely to put a floor on stock prices. However, market animal spirits are acting up and the near-term path of least resistance is down.
I am watching for some combination of the following to see that a market bottom has been reached:
- Some signs of stabilization and improvement in:
- European equity markets
- Asian equity markets
- Commodity prices
- Oversold extremes in US equities
- Signs of a crowded short from sentiment models
None of those indications are in place today. As an example, the 10 day exponential moving average of the CBOE equity put/call ratio has spiked above 0.8. However, history shows (N=5) that 80% of the first occasion when the ema10 spiked above 0.8 (red vertical lines), the market has fallen further before finding a bottom in about 3-5 weeks.

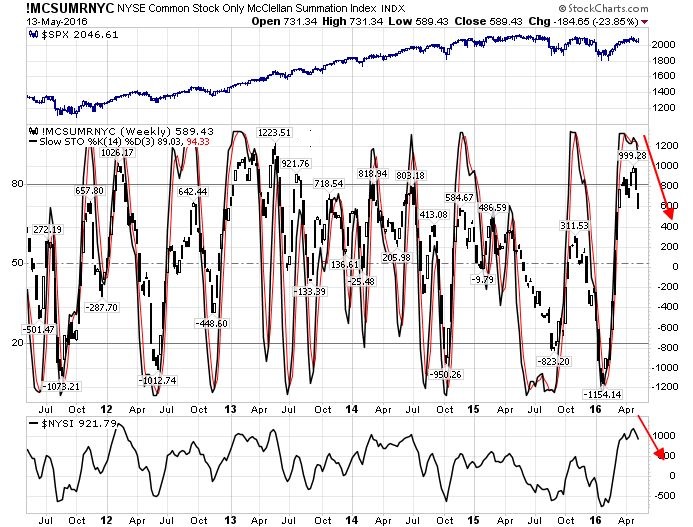
The McClellan Summation Index (mid panel: common stock only, bottom panel: all stocks) tells a similar story. Momentum is starting to roll over and such episodes have tended to bottom out in about four weeks.
A 3-5 week period of market weakness is the most likely outcome. We will probably see some sort of retreat to technical support, followed by a rally and one or more re-tests of the lows before this correction is over.
The week ahead
Looking to the week ahead, the SPX is currently testing a head and shoulders neckline support line at about 2040. Should it break, the measured target is 1970-1980. However, there are also support areas at the 200 dma (2010) and a Fibonacci retracement level at 1997. I am also watching for a bottoming signal from the VIX Index. Past instances of VIX spikes above its Bollinger Band has marked oversold conditions where downside risk has been limited.

In addition, I am also monitoring my Trifecta Bottom Spotting Model, which is nowhere near to flashing a buy signal. Recall that this has been a terrific bottom spotting indicator with an 88% success rate.
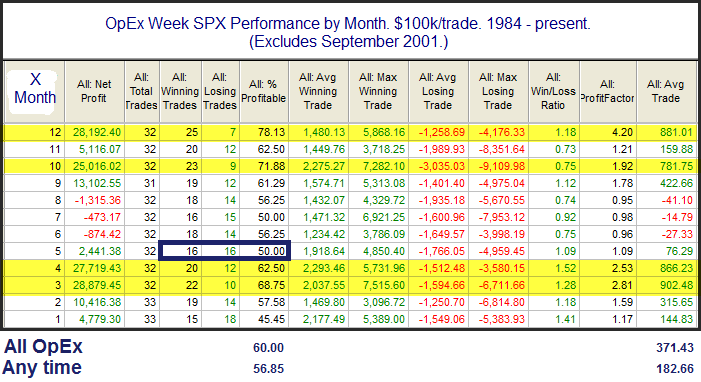
Next week is option expiry week (OpEx), which has historically seen an upward bias in stock prices. However, analysis from Rob Hanna shows that May OpEx is one of the weaker periods, with gains and losses dead even at 50-50. The bulls should therefore expect no help from May OpEx (table annotations and the calculated summaries at the bottom are mine).
My inner investor remains long stocks, as he is unconcerned about minor corrections. The upside SPX potential of 17-22% (2400-2500) against downside risk of 2-4% (1970-2000) is a bet that he thinks is well worth taking.
By contrast, my inner trader is more focused on catching the smaller moves. He went short the market last week and he is waiting for the corrective storm to pass.
Disclosure: Long SPXU
Comments are closed.