Further to my last post (see Three steps and a stumble?), I would like to clear up some misconceptions about how I interpret the yield curve and its investment implications. Much of the confusion revolves around the idea of correlation vs. causation. Yield curve inversions don’t cause anything. Yield curve inversions are a signal (correlation) of certain effects that have important investment implications.
In this post, I will address the following topics:
- Yield curve and recessions
- Yield curve and credit conditions
- Yield curve and equity bear markets
The yield curve and recessions
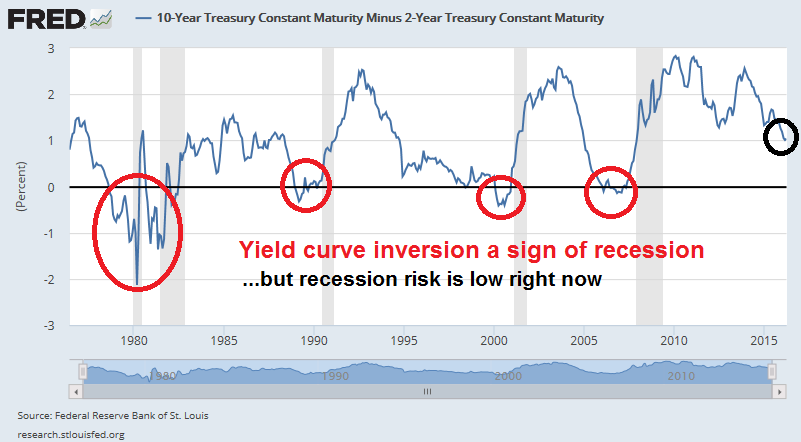
First of all, I do agree with New Deal Democrat that the yield curve is not signaling recession right now. As the chart of the 10-2 year Treasury yield shows, this spread has inverted (gone negative) before every one of the last five recessions, with no false positives. But the spread has been bouncing around 0.9-1.0% and therefore it is not forecasting a recession.
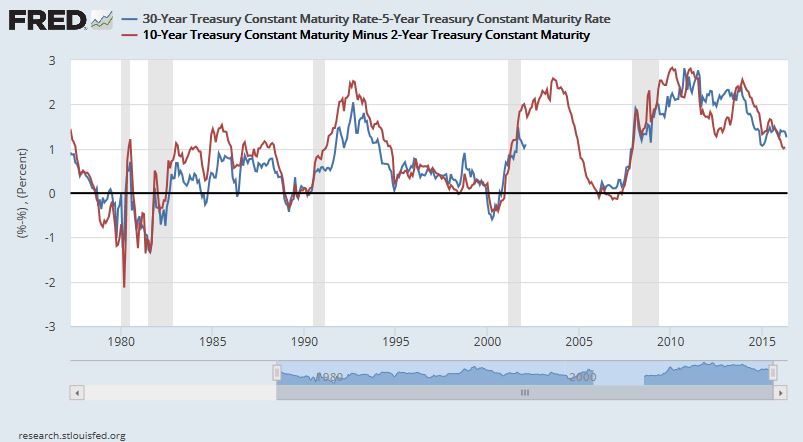
Incidentally, the choice of 30-5 (blue line) or 10-2 (red line) year spreads make little difference to our conclusions:
When will the yield curve actually invert and signal recession? I have no idea. Tim Duy thinks that the yield curve will continue to flatten because the Fed is in a tightening cycle:
So why is the curve flattening? My story is this: The yield curve flattens whenever the Fed is in a tightening cycle. And the Fed most assuredly remains in a tightening cycle. They have not backed off their fundamental story that rates are headed higher. They see normalized interest rates on the short end as well above the current yield on the long-end. This seems entirely inconsistent with signals from the bond market and the global zero interest rate environment. In my opinion, the Fed continues to send signal that they intend to error on the side of excessively tight monetary policy.
For the yield curve to steepen, the Fed needs to signal that it is more “relaxed” about rising inflation:
To expect the curve to steepen at this juncture, I think at a minimum you need the Fed to more aggressively commit to approaching the inflation target from above. You need to overshoot. That I think would be essentially an easing at this point. Chicago Federal Reserve President Charles Evans is already there. I think that Federal Reserve Chair Janet Yellen is getting there, but can’t say it.
And even then, I don’t know that approaching the target from above is enough. The dominance of the dollar in international finance means the Fed has a preeminent role in fostering global financial stability. A 2 percent US inflation target may not be consistent with global financial stability. And if not consistent with global financial stability, then not with US financial stability and thus not solid US economic performance. Which means if the Fed is the world’s central bank, they need to adopt an inflation target consistent with maintaining global growth. That might be higher than 2 percent. And they aren’t going down that road without a long and nasty fight.
Remember, an inverted yield curve doesn’t cause recessions. Inverted yield curves are market signals of tight monetary policy that causes recessions.
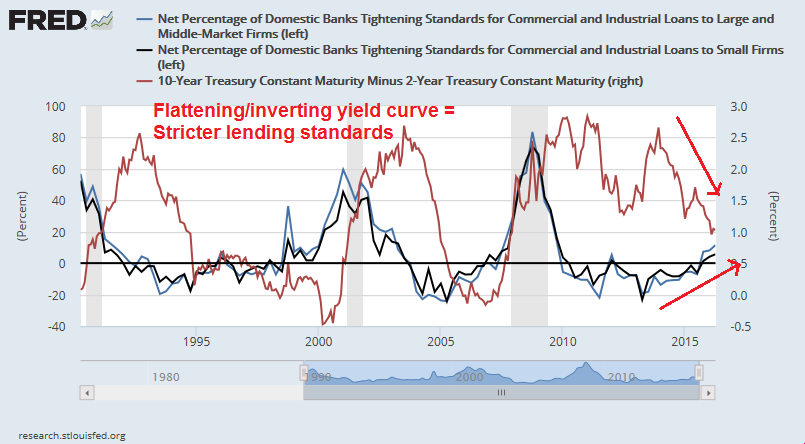
The yield curve and credit conditions
Additionally, I did not mean to imply in my last post that a flattening yield curves causes credit availability to dry up. A flattening yield curve an indicator of monetary policy, which the financial system interprets to become more prudent in its lending standards.
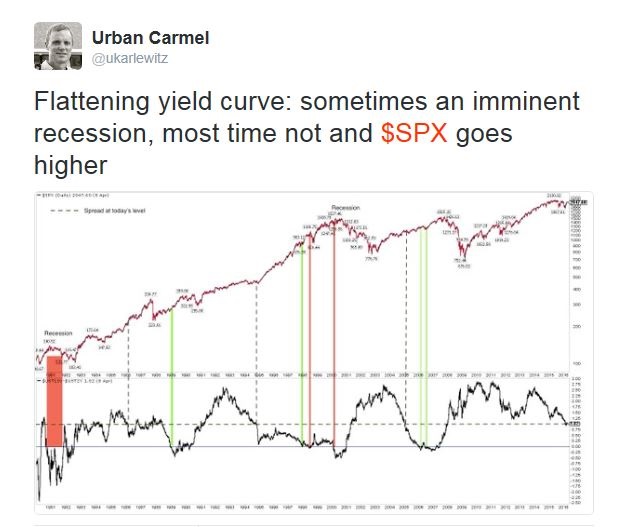
The yield curve and bear markets
Finally, some readers pointed to the analysis from Urban Carmel, which showed a loose connection between flattening yield curves and equity bear markets.
For a slightly different perspective, here is the 10-2 yield spread (blue line) against the Russell 1000 (red line). Yield curve inversions (blue circles) have signaled recessions in the past. The stock market has experienced bear markets in anticipation of recessions (red circles). Arguably, the NASDAQ top of 2000 and its subsequent crash had sufficient economic impact that it caused a recession.
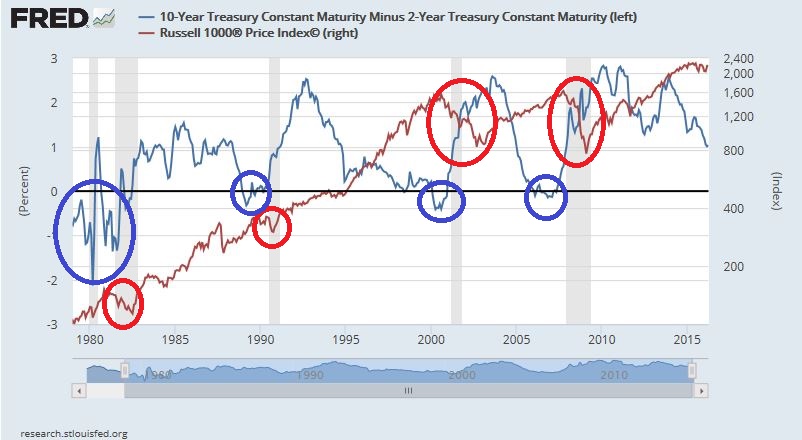
The two are related but inverted yield curves don’t cause bear markets, stocks go down in anticipation of recessions.In general, the macro-economic sequence goes something like this. The Fed tightens monetary policy, which causes the yield curve to flatten and eventually invert. The inversion is an indicator that monetary policy is so tight that a recession is more or less inevitable. The stock market reacts to the prospect of a slowing economy and recession and falls.
Got that? The shape of the yield curve is only a market indicator. It doesn’t “cause” anything to happen. Correlation does not equal causation.
Two things. First you can’t get an inverted yield curve under ZIRP, although you can still get high real interest rates under deflation. But there is no since in waiting for an inversion for the next recession as long as ZIRP is in place, because you’ll never get it. Since Japan went to ZIRP, strong trends toward flattening yield curves have preceded recessions, whereas inversions did prior to ZIRP in Japan. We’ve had some pretty substantial flattening already – and it is worth considering that inversions may not be possible and strong flattening could be reflecting the same kind of credit tightening that has preceded recessions in other countries that implemented ZIRP. The past yield curve inversions don’t apply anymore.
Second, while it is true that a yield curve inversion or substantial flattening is usually a symptom reflecting tightening lending standards, actual inversion also becomes a secondary cause in that it creates negative incentives for banks and financial intermediaries to borrow short and lend long – so credit dries up even faster the flatter or more inverted the curve gets. Essentially once a yield curve gets flat enough or inverted enough it leads to a self reinforcing feedback loop that dries up credit more and more until recession develops. The erosion or destruction of incentives to lend by borrowing short is part of that loop.
This is another case of using investment indicators that used to work before the GFC. We are in a Moonless world (the Central Bankers being the moon that drove past business and stock market cycles). And we are in a world of persistent downward pressure on prices from globalization and the digital revolution. So the key is to examine events through that lens.
So we come to the yield curve which used to predict recessions when the Moon drove tides. Economic cycles would perk up and the Central Bankers would raise short rates to head off an inflationary blow-off. The economy would keep picking up momentum and higher rates would eventually snuff out the recovery and a bear market and recession would start.
What is happening right now DOES NOT EVEN REMOTELY RESEMBLE THAT. The Fed raised rates in December and EVERYBODY (me included) who knew a shred of economic history expected short rates to ramp up (4 times in 2016 and then back to ‘normal’). We were sure that all interest rates were artificially held down and when the lid was lifted, UP we would go. But SURPRISE, SURPRISE, bond yields FELL. That is a shock that is ringing around the investment world right now. We are re-calibrating the interest rate outlook one investor at a time. Don’t be the last. The yield curve is flattening because the long rate has plunged, not because short rates are rising. When this happens, the above charts look the same but it tells a COMPLETELY different story. The story is that the yield curve is flattening because the long term inflation and economic outlook are looking tamer. That is the opposite of the pre-GFC cases of flattening yield curves when the economy was starting to overheat.
Note also the charts are misleading from the standpoint of quantity. If the interest rate in the 1980s flattens with both rates at 8%, its a helluva lot different than than the 2-10 flattening at 1.75% on the 10 year bond. If the short rate got up to 1.75%, that is not a economy killer. On the other hand, 8% on a car or house loan, is a compounding retail spending stopper.
I am as well versed in macroeconomic and stock market history as anybody but I choose to look at the reality of what is happening rather than try to fit statistics to an historical context that no longer exists.
We are NOT, repeat NOT, in the seventh year of a bull market and economic cycle where late cycle things will happen like rates ramping up and commodity prices booming due to overheating economies. We are seeing brand new bull markets in many sectors after full fledged bear markets have ended.
We are in a world where economies are growing slowly and technology is increasing supply while demand is rising along with employment. This keeps inflation lower than expected. It’s a healthy general economy but one that will keep Central Bankers (the Moon) effectively out of the picture as far as the eye can see.
In this Moonless environment, industry sectors have their own business and stock market cycles (although general sentiment influences within the trend). Looking only at the S&P 500 hides the bull and bear markets that are happening everywhere. We had bear markets in EVERY major index in the world except the S&P 500 and DJIA. In the U.S. the NASDAQ and Russell 2000 went below the 20% bear market threshold. Sectors like energy and materials fell 50% or more from their highs. To say these are all in ‘late cycle’ is ridiculous. The truth is that they have finished bear markets and have started new bull markets. They are in ‘early cycle’ mode. The truth is also the the S&P 500 and DJIA had a very much higher weighting than other major indexes in recession-proof industries like healthcare, consumer and utilities. Without a recession, these sectors simply continued their own bull markets. To really see what’s happening, one must stop looking at the S&P 500 and start looking at cycles in sectors.
So if we are starting a 3-5 year bull market, how do we get the normal 50-75% move up in a portfolio that should happen over the timespan? Doesn’t the anemic profit picture say that gains will be muted? No, the focus is shifting to DIVIDENDS from profits now that the long term interest rate outlook is changing. Warren Buffett said last year that if rates were to stay low for ten years, stocks were EXTREMELY cheap. Rates staying low seemed a foolish dream but with rates falling after the December Fed rate increase, it has more and more investors rethinking the picture.
A MOST AMAZING thing has happened in the last four months. Dividend ETFs have outperformed the S&P 500 index by TEN FULL PERCENT! That is likely unprecedented. Usually one might see them outperform by a couple percent over a year but 10% over four months???? Something new is happening. I bet you haven’t heard about this incredible feat. There has been some rumblings about how defensive sectors are out of step with the seven year ‘late-cycle’ forecasts.
Here’s a statistic that will blow your mind. It did mine. In 1998 when the 10 year bond was at 7%, the dividend yield on the S&P 500 was 2%. We now have a 1.75% rate on the 10 year with dividend yield at 2.1%. Seem to me that the stock market is very cheap compared to yesteryear. Plus we get dividend growth of 5-8% a year. There is no reason, the market should be priced to yield two thirds of the 10 year bond. At the current 10 year yield that gives the market an 80% upward boost. That is likely too much to expect but if the 10 year rose to 2.5% and the market yielded two thirds of that (1.67%), the market would be 26% higher then add the dividend growth and we have a Merry Christmas.
Note that none of this thinking involves whether profits go up or down a few percent. This is to the dismay of all the CFA graduates analyzing the stock market and individual companies. Their focus is on earnings not dividends. Investors will take the reins and seek dividends in companies that are benefiting from the technology revolution (confirmed with positive relative stock price momentum).
This is the dividend oriented strategy I am using to benefit my clients along with the new bull markets in commodity industries that Cam so cleverly pick the bottom of their bear markets in mid-January. I hope you enjoy these new bull markets.
I appreciate your theories about the moonless market, but unless you can back it up with sound theory, it sounds like another variant of “this time is different”.
We know how often the “this time is different” stories have worked out in the past.
I don’t think this time it’s different. Every bear market and every recession has been preceded by significant Central Bank tightening in the face of an economy overheating. That is the theory and the fact that has always been true and one I believe in now and in the future.
I am just observing that conditions haven’t been there or will be in the foreseeable future for them to tighten the degree necessary to tip us into a general recession and a synchronized bear market in all sectors like we used to get. This slow growing economy with low inflation pressure allows that. We will have a Moonless economy and Moonless stock market until conditions change.
I see other observers arguing that somehow the time that has past since the S&P 500 index has not had a 20% decline must mean that it is overdue for a bear market. That there hasn’t been a recession for seven years, so the time must be near for one too. I say to those people, you are wrong, this time it’s not different, the recession and bear market will come as it always does when the Central Bankers tighten in the face of an overheating economy, not because of the calendar.
The are saying “This time it’s different.” not me.
As per the yield curve, at some point in future when the yield curve flattens or goes negative because short rates are ramping up substantially in the face of an overheating economy, I will be using that as a key indicator to grow more cautious. I’ve done that in that past when appropriate. That is how I will use it. When it is flattening now because long term rates are declining and short rates are stuck at a low due to a slow growth economy, I will not use the yield curve. That is not a new theory. That’s just common sense.
Dear Ken,
you are not true = every bear market and every recession has been preceded by significant Central Bank tightening. FED was established in 1913, Bank of Englad – 1694. And to be honest they were recession / depression before that.
I think that most of the recessions were caused by oversupply and due to the inefficiency of investments – like railroads in the US in 19 century.
Thanks Ken for taking the time….I, for one, really appreciate the effort and for sharing that thought-provoking analysis.
Very true Petr. I should have said ‘in the modern era’.
But your observation about railways before the U.S. Federal Reserve Board was very telling. They had their own industry bear market base on over supply without being caused by Central Banks. This is exactly what happened to the resource industry over the last five years. Back in the 1800s the bear markets in rail stocks would end when the shares hit rock bottom and the industry resized itself.
If general economic conditions post-GFC make tightening aggressively unnecessary for a very long time (7 years and counting), then individual industries will rise and fall in their own rythm, not the general Fed-induced tides. I choose to view this as a Moonless world. That explains what’s happening. Witness another industry, the biotechs going through a whole bull to bubble and crash without the S&P 500 having a bear market.
But we must stay vigilant for signs, such as the yield curve that the Moon (the Fed) is back. When it flattens because short AND long rates are rising but short rates faster than long then we will have a logical signal. When it flattens like now due to long rates falling it just confirms that the Moon is still nowhere to be found.