Preface: Explaining our market timing models
We maintain several market timing models, each with differing time horizons. The “Ultimate Market Timing Model” is a long-term market timing model based on the research outlined in our post, Building the ultimate market timing model. This model tends to generate only a handful of signals each decade.
The Trend Model is an asset allocation model which applies trend following principles based on the inputs of global stock and commodity price. This model has a shorter time horizon and tends to turn over about 4-6 times a year. In essence, it seeks to answer the question, “Is the trend in the global economy expansion (bullish) or contraction (bearish)?”
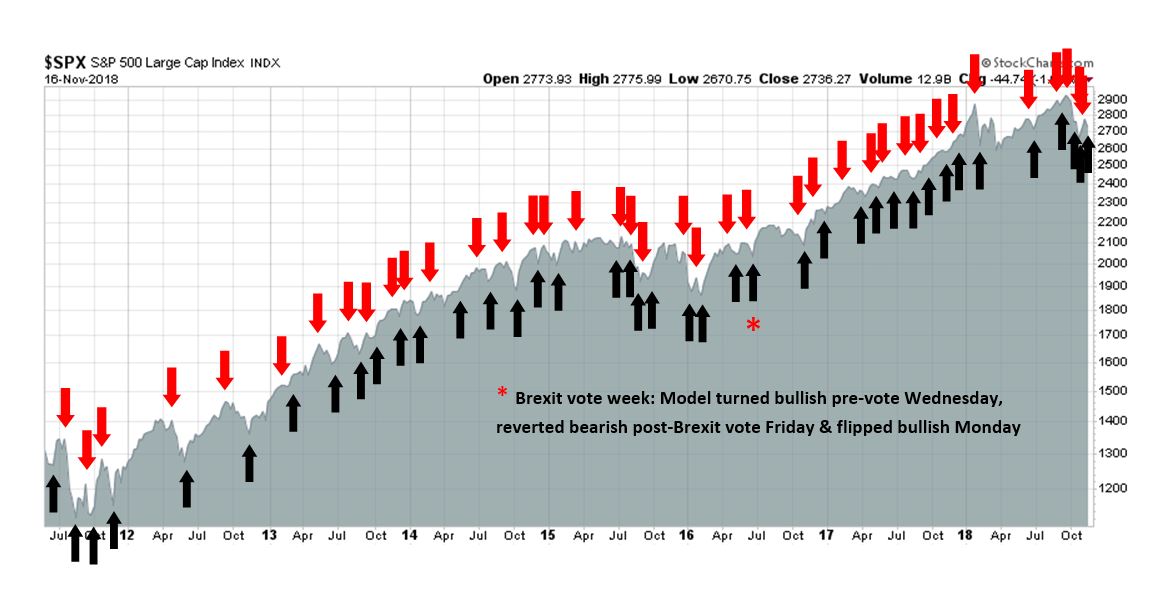
My inner trader uses the trading component of the Trend Model to look for changes in the direction of the main Trend Model signal. A bullish Trend Model signal that gets less bullish is a trading “sell” signal. Conversely, a bearish Trend Model signal that gets less bearish is a trading “buy” signal. The history of actual out-of-sample (not backtested) signals of the trading model are shown by the arrows in the chart below. The turnover rate of the trading model is high, and it has varied between 150% to 200% per month.
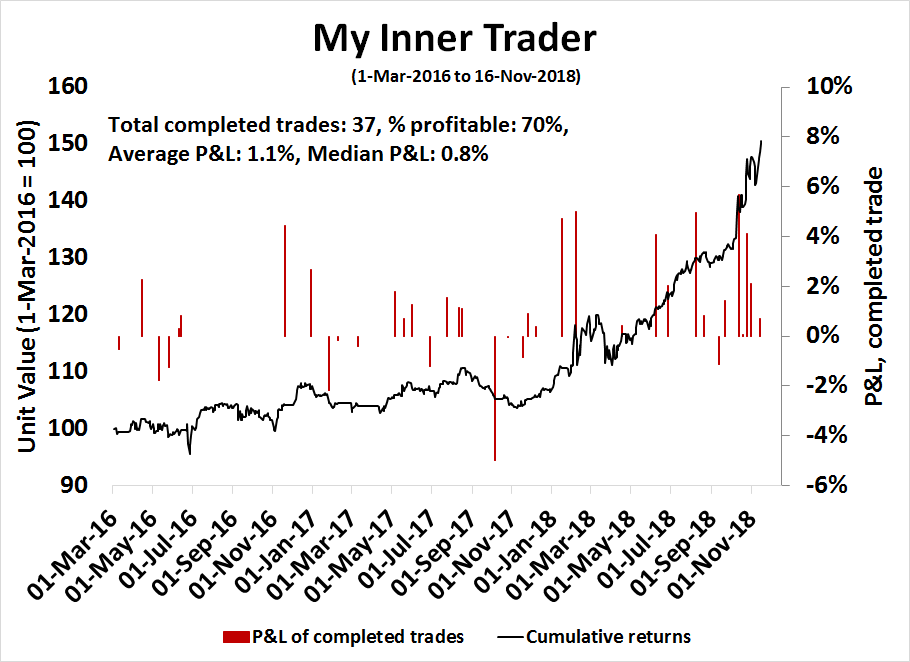
Subscribers receive real-time alerts of model changes, and a hypothetical trading record of the those email alerts are updated weekly here. The hypothetical trading record of the trading model of the real-time alerts that began in March 2016 is shown below.
The latest signals of each model are as follows:
- Ultimate market timing model: Buy equities
- Trend Model signal: Bearish
- Trading model: Bullish
Update schedule: I generally update model readings on my site on weekends and tweet mid-week observations at @humblestudent. Subscribers receive real-time alerts of trading model changes, and a hypothetical trading record of the those email alerts is shown here.
Global slowdown?
In a speech last week, Fed chair Jay Powell stated that while the American economy was performing well, he raised concerns about the effects of a global slowdown. His remarks highlights the importance of non-US markets, and it would be useful to take a brief tour around the world to see what Mr. Market thinks of the “global slowdown”.
A comparison of global equity market (top panel) and US equities (middle panel) shows some differences and similarities.

We can make a number of observations from this chart:
- Both global and US equities are in downtrends, defined as each index trading below its 200 day moving average (dma), but US stocks are stronger as the SPX is only just below its 200 dma.
- Both indices are forming possible inverse head and shoulders formations which may resolve bullishly. As good technicians know, these patterns are not confirmed until the neckline breaks.
- One key difference stands out if upside breakouts were to occur. The measured upside target for global stocks is below the January all-time highs, while the measured target for the SPX is over 3000, which would represent a fresh high for that index.
- Market leadership may be pausing and waiting for direction. The bottom panel shows that for much of this year, US stocks have been outperforming global stocks, as measured by the MSCI All-Country World Index (ACWI), but relative performance of US, EAFE, and EM equities have flattened out since September.
What follows is a more detailed review of global markets as we take a quick tour around the world.
Inverse head and shoulders everywhere
Let’s begin in Europe. The chart of the Euro STOXX 50 and key core European markets are all in downtrends but displaying similar possible inverse head and shoulders patterns. There are some exceptions, such as Italy and Greece, which are not recovering as strongly , reflecting the special situations that these countries face within the eurozone.

Across the English Channel, the chart below of UK stocks, as measured by the FTSE 100 and smaller cap FTSE 250 tell the story of the special situation in that country. The FTSE 100, which is composed of large cap companies with global reach, is exhibiting a possible inverse head and shoulders pattern typical of other global indices. However, the FTSE 250, which is composed of smaller companies more sensitive to the UK economy, broke down below its February lows, which is reflective of the market angst over the uncertainties of Brexit.

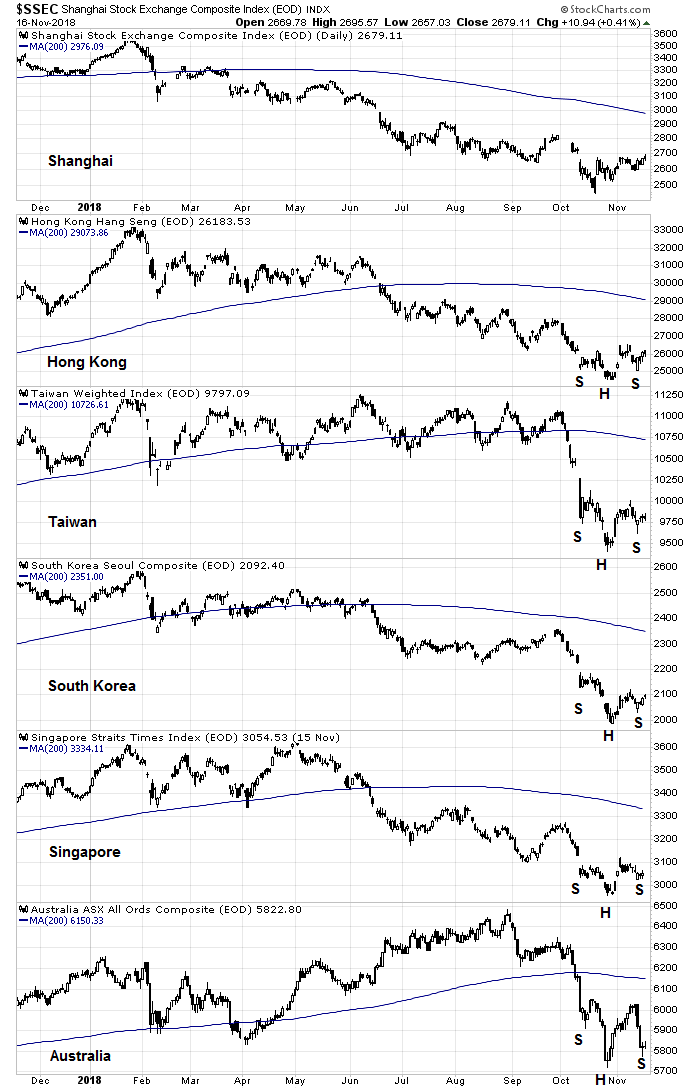
Over in Asia, the stock indices of China’s major Asian trading partners reveal similar downtrends but patterns of nascent inverse head and shoulders formations. The Hong Kong, Taiwan, Singapore, and Australian markets are all exhibiting these patterns in some form. The Shanghai market is an exception, but it seems to be trying to stabilize.
Signs of China weakness
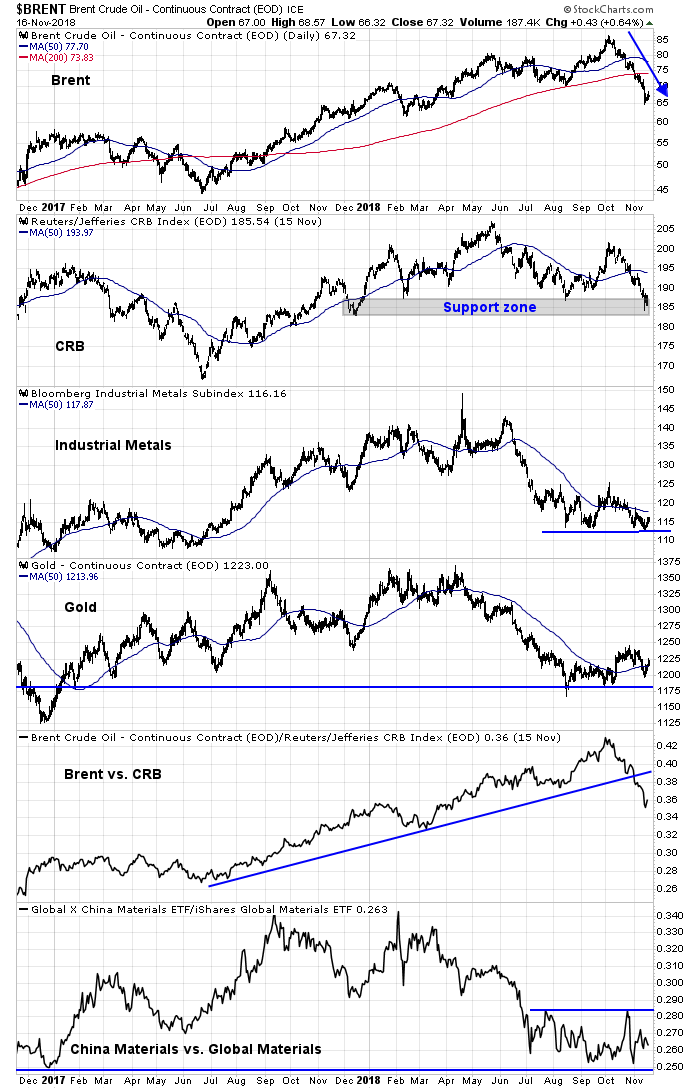
What about oil prices, which have recently cratered? A glance at the price of oil and commodity prices tell a different story.
We can make the following observations from the above chart:
- Oil prices were only playing catch-up to commodity price weakness. Non-oil commodities are all resting at key support levels, while oil prices have been on a tear since the summer of 2017. The commodity complex (CRB, second panel), the cyclically sensitive industrial metals (third panel), and gold (fourth panel) have been weak for over a year.
- The oil to commodity ratio recently broke a relative uptrend (fifth panel), but the ratio remains well above the levels from which it began its bull run.
- Commodity weakness is attributable to weakness in China. The bottom panel shows the relative performance of the China Materials ETF (CHIM) against the Global Materials ETF (MXI). The ratio has been range bound after weakening from early 2018 until July, and it is testing a key relative support level that stretches back to December 2016. This is indicative of a lack of enthusiasm for Chinese raw material stocks, which is a signal of weak Chinese commodity demand.
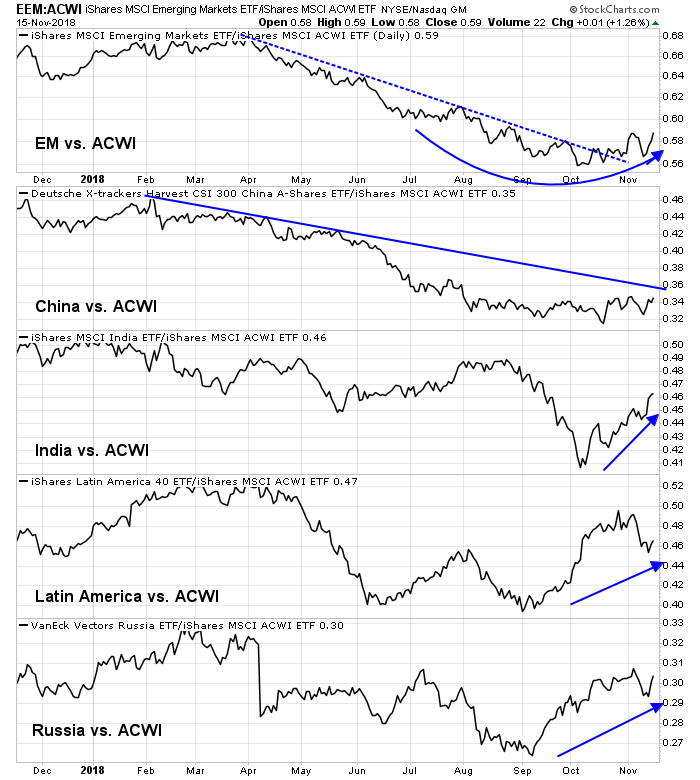
Chinese weakness can also be observed from the relative performance of EM stocks against ACWI. As the chart below shows, EM equities have broken out of a downtrend against ACWI (top panel). However, positive relative strength can be found everywhere except for China. While Chinese stocks are roughly flat against ACWI (second panel), relative strength is evident in the other EM regions, including the oil price sensitive Russia (bottom panel).
I suggested in a recent publication (see Was the market swoon made in China?) that much of the future market direction depends on China. This brief tour around the world indicates that may still be the case. Under those circumstances, expect further volatility based on newsflow on US-China trade negotiations.
A tactical rally ahead?
That said, the widespread appearance of the possible but incomplete inverse head and shoulders pattern in many global indices suggests that stock prices may be in for a year-end rally (see Time to position for a year-end rally?).
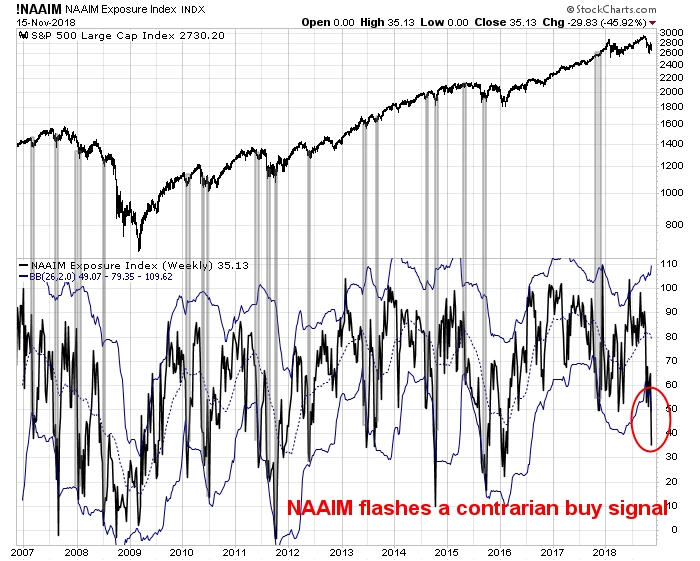
In addition to the sentiment indicators I cited in that post, the NAAIM Exposure Index, which measures the equity sentiment of RIAs, has fallen below its 26-week Bollinger Band indicating excessive bearishness. Historically, such episodes have seen equity prices rise shortly afterwards.
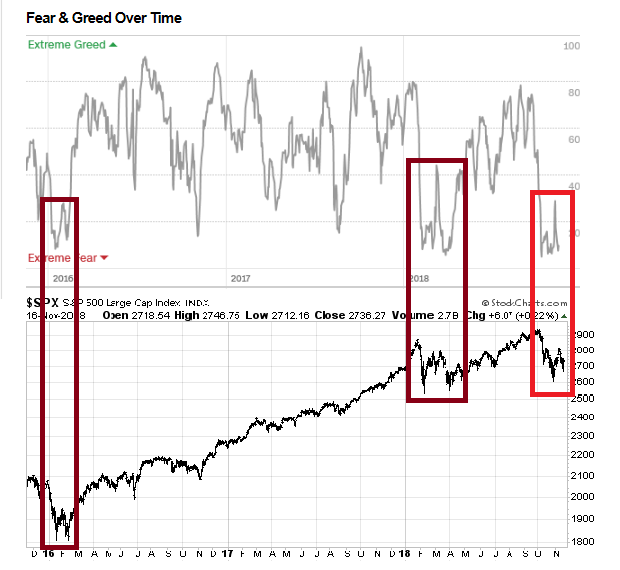
The Fear and Greed Index stands at 10, and these levels are consistent with readings seen at previous complex W-shaped bottoms.
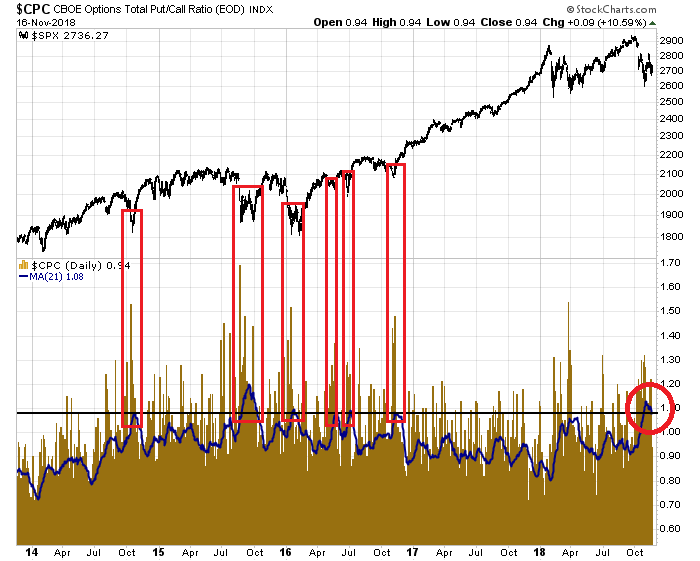
The 21 dma of the CBOE put/call ratio is at levels consistent with past tradable bottoms.
These are all strongly indicative of a stock market rebound lasting until year-end and possibly into January. However, I would not overstay the party. Global markets are all in downtrends, defined as trading below their 200 dma, and the DJ Global Index saw a MACD sell signal on the monthly chart in July. I would therefore expect lower prices after a brief relief rally.

The week ahead
Looking to the holiday shortened week ahead, the SPX is poised to begin its year-end rally. The initial objective will be the neckline of the potential inverse head and shoulders formation at about 2820. Momentum is favorable as the index has exhibited a positive RSI divergence. However, if the market were to surge to test 2820 resistance next week, the rally is likely to fail as the VIX Index would probably fall below its lower BB, which would be the sign of an overbought market.

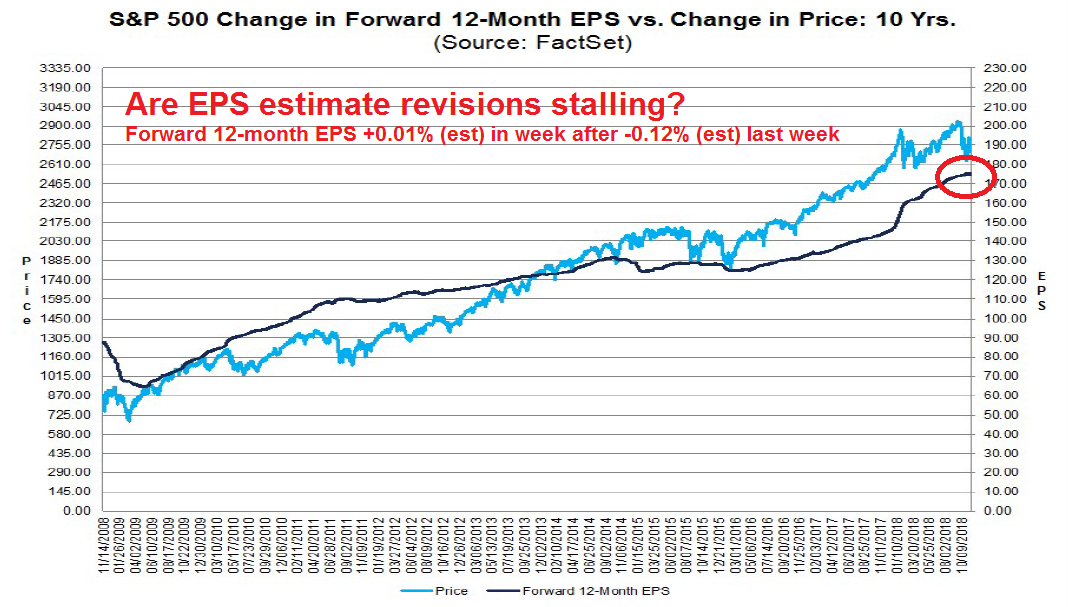
I would warn that the year-end rally may face some fundamental headwinds. The latest update from FactSet shows that EPS estimate revisions may be stalling. Forward 12-month EPS edged up an estimated 0.01% in the latest week after -0.12% the previous week, which may be a sign that of flagging fundamental momentum. On the other hand, the lack of upward EPS revisions may be a residual effect of the recent stock market weakness, as forward EPS has shown itself to be coincident with stock prices, and its weakness only serves as a fundamental signal of market strength or weakness.
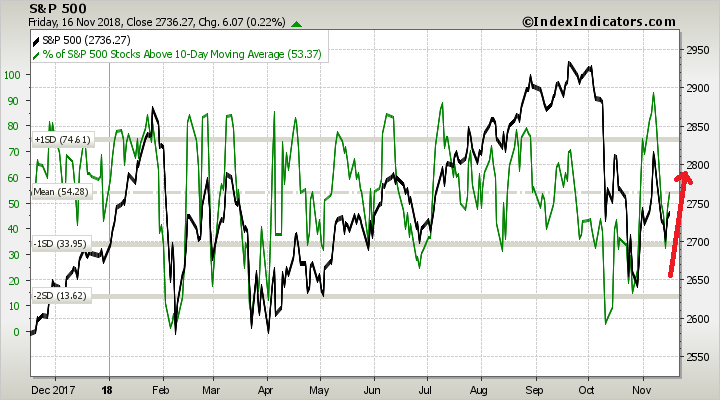
Short-term breadth indicators are coming off an oversold reading and exhibiting positive momentum, which is bullish. I will be watching this next week to see if it reaches an overbought level.
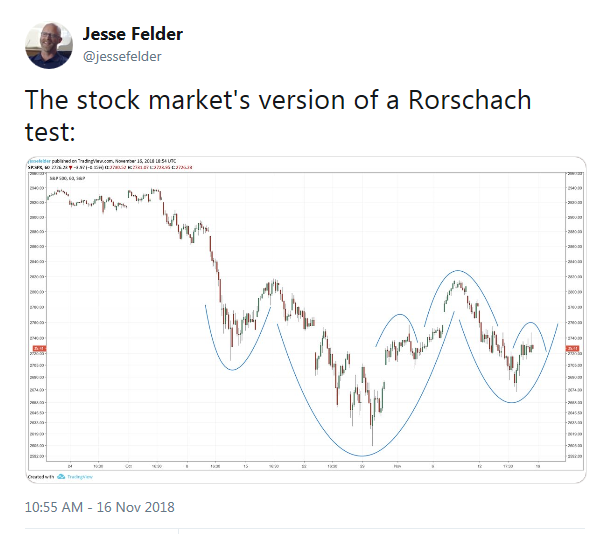
For the last word, I refer you to Jesse Felder. Felder found not one, but two possible head and shoulders formations in the hourly SPX chart. One breaks upwards, and the other breaks downwards. While he characterized it as a Rorschbach test for traders, it also represents an important lesson for technicians. These patterns are not complete until the neckline breaks, so be prepared.
My inner investor remains cautious, and his equity weight is near his minimum risk level. My inner trader covered his shorts last Thursday and went long in anticipation of the start of a seasonal rally.
Disclosure: Long SPXL
I keep track of a variety of options p/c related indicators and while the “dumb money” indicators are showing showing extreme bearish readings (contrarian bullish), the “smart money” indicators are failing to show bullishness. This fits well with your analysis that the market fundamental backdrop is not supportive of equities (hence smart money not enthusiastic about buying), but short-term dumb money trader sentiment has overreacted setting the stage for a snap-back rally.
How do you distinguish between the dumb and smart money sentiment indicators?
Based on my historical backtesting index options p/c ratios are not contrarian indicators. So I look at ratio of (smart money) index options p/c relative to equity options (dumb money). If index options traders more bearish relatively speaking than equity options traders then that is bearish indicator and vice versa for bullish. Right now equity options traders (dumb money) are still relatively more bullish than index traders (smart money). Market performs best when the situation is reversed.
Does anyone have a view on USD over the next few months?
USD technical action appears exhaustive. Best guess is it pulls back, though rate spreads argue for USD strength.
Thank you.
November 15th was the last day for hedge fund redemption – market bottomed same day last year!
Big positive development. Fed Funds futures for the end of 2019 have fallen sharply. In other words, futures traders are saying rates will not be as high.
https://product.datastream.com/dscharting/gateway.aspx?guid=b7ec9234-f31b-4931-89e1-1040262ad80a&action=REFRESH
also, the emerging world is benefiting from Trump’s giving a pass to the 8 largest buyers of Iranian oil. That is 80% of their exports. That quick, surprising flip flop has meant the extra Saudi oil produced in anticipation of much harsher terms has killed oil prices. That’s good for emerging countries that are net importers.
I suspect after the December hike the Fed will take a pass on March and then final hike in June 2019 to end this tightening cycle. Question is whether they can pull off a soft landing or whether a recession is already invetable. I suspect that will depend on how much further the trade war within China spirals out of control.
History of Fed pulling off a “soft landing” is poor.
2. Junk bonds are selling and US treasuries are rallying. WIth oil down big time, we may be looking at “credit events” in the oil patch.
3. With the headline Dow Industrials down most days, since October, we may be in for a dour Christmas sale season, as consumer confidence is sapped. Today, Target is down 9% pre market!!
4. Dour Christmas sales mean huge inventory sales to follow = bad for profits.
5. The February bottom was 2603 on the S&P. We have a little ways to get there yet! -10% from the top is still below us at 2650. What can I say? Things are not exactly pretty out there.
Cam, excellent summary of the Global Markets.
Very helpful for tactical managing. Much appreciate your factor, sector, and global reviews.
Thank you!
Breadth is awful. Have we invalidated the inverse head and shoulder pattern yet?