Mid-week market update: Even as stock prices weakened this week, the market appears to be setting up for a year-end rally. The SPX is exhibiting a number of positive divergences. Both the NYSE and NASDAQ new lows are not spiking even as stock prices have fallen. In addition, the percentage of stocks above their 50 day moving averages (dma) are making a series of higher lows, which are all bullish.

What are the risks and opportunities in positioning for a year-end rally?
The bull case
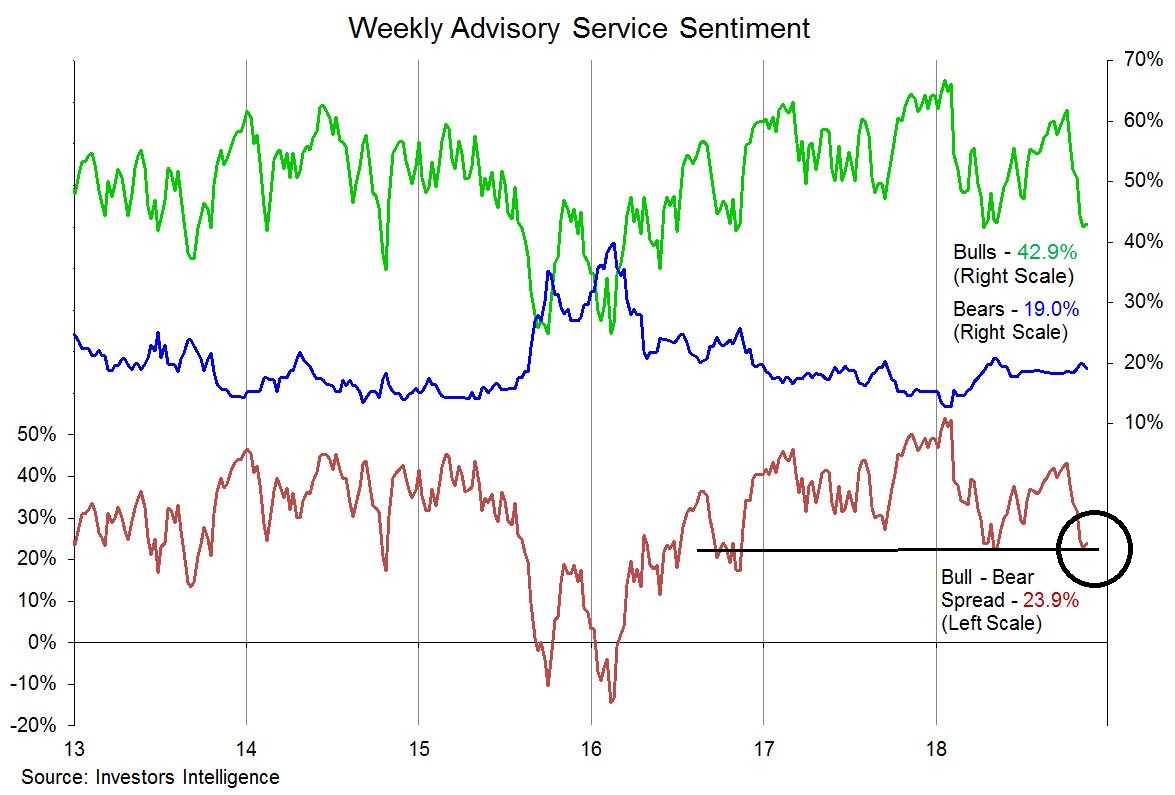
The tactical bull case is relatively easy to make. Sentiment is becoming washed-out. The latest Investors Intelligence bull-bear spread is at levels seen in recent intermediate bottoms.
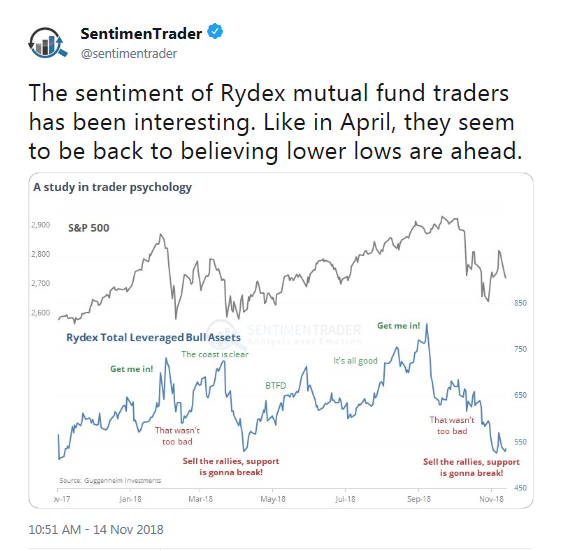
SentimenTrader also observed that Rydex traders are panicking, which is contrarian bullish.
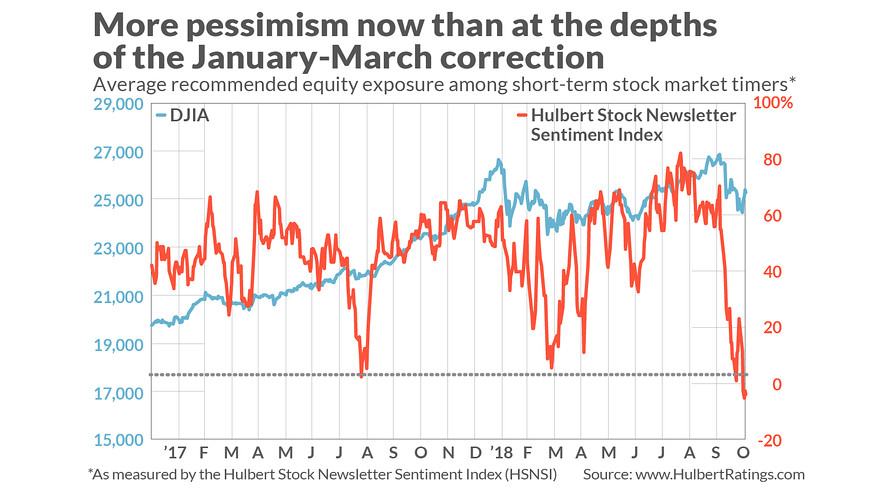
I recently highlighted analysis from Mark Hulbert which indicated that market timers have become excessively bearish, which is contrarian bullish. Hulbert wrote that these readings create an equity bullish environment for the next couple of months, which is consistent with the year-end rally theme.
Contrarian analysis isn’t always right, and even when it is it only applies to the short term — no more than the next month or two. So today’s encouraging sentiment picture tells us nothing about where the market might be six months to year from now.
But, for now at least, contrarians are betting that the stock market will higher over the next couple of months.
I also pointed out that we have seen a cluster of corporate insider buying. Even if you are bearish longer term, which I am, such signals resolved themselves with short-term rallies during the period after the 2007 market peak.

Don`t get too bullish
Should a rally into year-end materialize, I would refrain from becoming overly bullish for a number of reasons. First, investors have to contend with the long-term sell signal flashed by the combination of negative monthly RSI divergence and MACD sell signal.

In addition, the market has been reacting to news from China (see Assessing the odds of a US-China agreement). Despite the encouraging signals, it is difficult to believe that any substantive agreement can come out of the Trump-Xi meeting in Argentina at the sidelines of the G20 summit November 30 – December 1. Be prepared for disappointment.
Two tests for the bulls
Nevertheless, the stock market is poised for a relief rally from a technical and sentiment perspective. There is an inverse head and shoulders formation that is forming in the SPX. Good technicians know that these formations are not confirmed until the neckline breaks. If the index were to break through neckline resistance, the measured target would be about 3035, and such an event would likely spark an initial but brief FOMO rally.
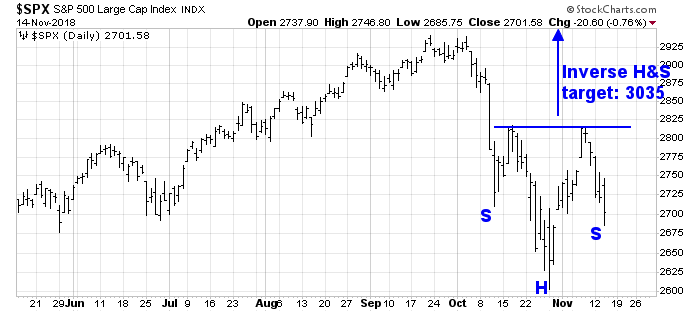
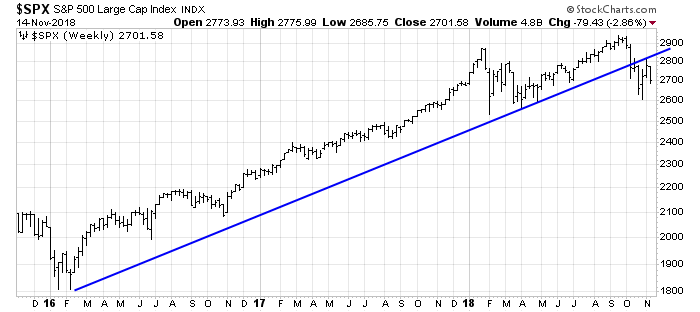
Hold your enthusiasm. Here are some challenges for the bulls. First, the longer term weekly chart shows that the SPX broke down through an uptrend. While the market kissed the underside of the trend line last week, it did not break through on a closing basis. One of the key tasks for the bulls will be to break up through the trend line, otherwise any year-end rally would be interpreted as a failed backtest and likely fizzle out with a lower high.
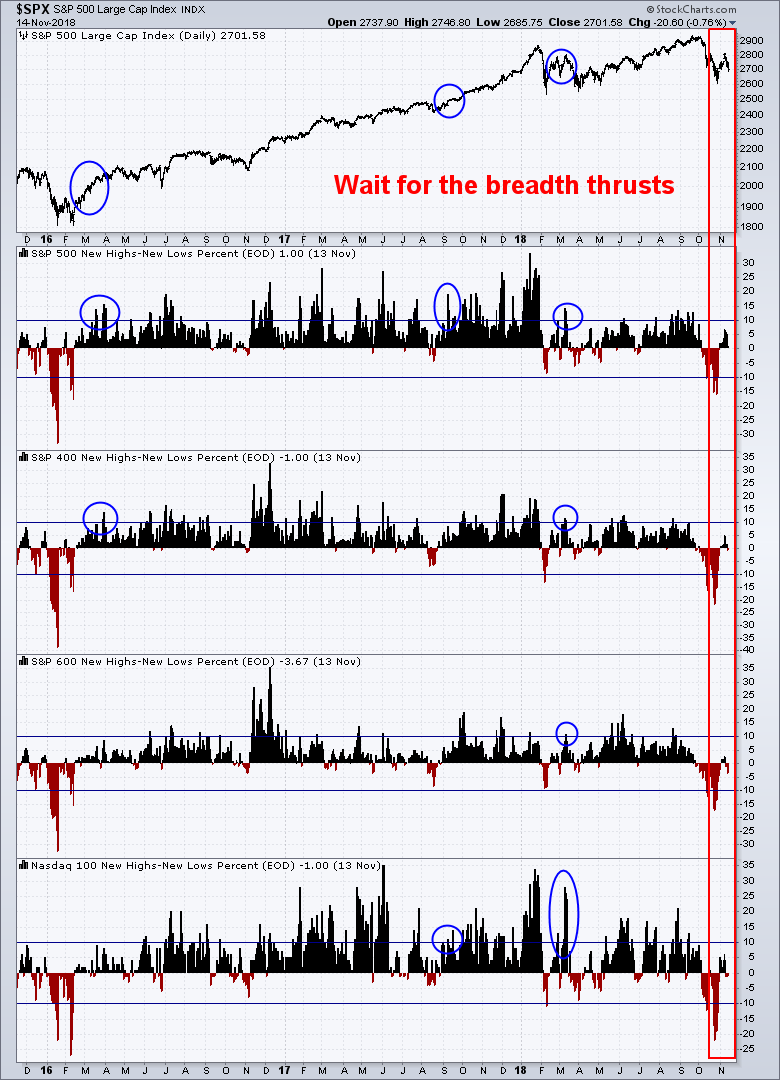
In addition, watch for breadth thrusts. Past rallies have seen breadth thrusts (circled), as measured by the new high-new low % indicators, in one or more of large caps, midcaps, small caps, or NASDAQ stocks.
If the bulls cannot pass these two simple tests, then any upside breakout of the inverse head and shoulders is likely to be disappointing. Rallies will either be weak, abbreviated, or both.
Subscribers received an email alert today that my inner trader had covered his short positions and flipped to long.
Disclosure: Long SPXL
So one scenario to look for is a false breakout of the H&S, that would get close to the underside of the trend line. Since these patterns are supposed to have symmetry we might get a sharp move up to that neckline. After that either it keeps moving up after working through the resistance or falls back down. Somewhere around the neckline might be a good place to take some profits if this sharp rally occurs.
What target are we looking for this rally? below 2820 or above that?
If you read the full article, it depends on how much momentum the bulls can manage. I am not going to give a target, because there are too many moving parts.
In the previous article, Cam outlines the Fibonacci retracement levels. 2800 was first and 2850 next (read the article). The recent countertrend rally failed around 2820 give or take (my memory fails me here; sorry).
Let us pencil in 2800 for a retracement rally and watch if there is further rally to 2850 thereafter.
The only near term catalyst here is China trade talks. President Xi and Trump need something to appease their base, and it would be foolish for President Xi to waste this opportunity. President Xi is waging a 100 year war, so he may loose a battle but win the war in the end. Let us see whether he chooses to loose a battle and which one.
The Fed is on the throat of the market and against all odds, the ten year treasury rallied this week. A tightening cycle is at hand, and history is witness to steep losses in the stock market once the Fed starts the tightening cycle. Ken, has been pounding the table and lately Cam also, to batten the hatches.
For now let us enjoy the short term bottom that Cam’s fine work has signaled.
Time here may be measured in quarters. Let us pencil in this quarter and see if Santa Claus has any goodies still left, before tariffs start to bite next year earnings.
And after a Thanksgiving to Christmas bullish episode? Brexit mess got worse. If you are correct that there will be no significant Trump/Xi breakthrough What is there to support the market? The Fed could (I do not say they will) not raise rates in December. A bit of deflation in the air?
Robert
December rate hike is baked in the cake. However, probability of 2019 rate hikes is diminishing as I write this. Fed is data dependent. The Fed does not have to raise rates especially if CPI remains tame.
Cam – I’m sure this is on your website, but what would make your ultimate market timing model go to “sell equities” from “buy equities?” Your trend model is bearish and you made comments that you are long-term bearish due to the RSI divergence and monthly MACD.
Does your current bearish view of the market probably making a broad-based top mean that you believe we are on the verge of a bear market? If so, how does that reconcile with your “buy equities” of the ultimate market timing model?
Thanks!
Andrew
Cam’s long term equity model is already at much lower equity exposure, with equities sold and cash returned to the cash side of the ledger. Headline indices are not exactly flashing a picture of health, beneath the surface. On the price action we are within ten percent of the all time high. Understand, that a bear market in equities may be close, though the economy may not tank. For now, economy seems chugging along fine except, US housing has taken it on the chin and oil is rolling over, both quite bearish signals.
Cam’s model is pretty clear. A short term rally may be at hand, that one can trade on the long side of the ledger, but short term cash must be returned to the cash side of the ledger. Long term investment capital is already in cash. If not, presuming there is a countertrend rally, next quarter is a good time to get out of long term capital commitment and long term cash returned to the cash side of the ledger.
Andrew
What you call “sell equities” would mean shorting. The Cam model prefers cash, instead of a true short position in the ledger.
Cash position in the ledger is a kind of short in the market. This is where the market is today.
DV – Thank you for that. Is there a spot on the website that shows the long-term model’s low equity exposure you mentioned? I searched but could not find that.
Cam’s long term model cut exposure circa August 2018. He has tried and explained why such signals, apply to individual portfolios based on their time horizons (or risk appetite). An equity portfolio that is decades away from retirement could ignore such signals. However those with retirement say within 10 years of retirement, could use the signal to cut equity exposure. Ask yourself the question where you are in your portfolio building? are you close to the land of net worth for retirement or are you years away? Here is a reference that I found useful;
Men Faber’s book titled Global asset allocation.
Even if one is decades away from retirement, one could use such signals to actively manage long term portfolios and deploy cash generated at a decent pull back. The goal is not to loose capital gains.
Black Swan event: A black swan event is a rare event with high probability of loss (or gain). Such events are not on people’s mind until after. One such event is the Mueller probe. If the Mueller probe delivers something that incriminates the White House, we have a fork in the road. The White House will be mired in distractions, something that is generally a bearish development.
Carnage in techland today. Are we going to break Oct lows to start cascading action or is this final flush before year end rally is the question
BAML put out a call to sell FAANG and buy BRICs Monday so weakness was therefore not a big surprise.
Cam, what’s the “arrow” saying now? Does it hold tight and see, or does it reverse?
Arrow still pointing up. More details in a full post after the close today.