Mid-week market update: Having reviewed sector rotation last week (see More evidence of an emerging reflationary rebound), it is time to apply the same analysis to countries and regions.
First, let’s start with a primer of our analytic tool. Relative Rotation Graphs, or RRG charts, are a way of depicting the changes in leadership in different groups, such as sectors, countries or regions, or market factors. The charts are organized into four quadrants. The typical group rotation pattern occurs in a clockwise fashion. Leading groups (top right) deteriorate to weakening groups (bottom right), which then rotates to lagging groups (bottom left), which changes to improving groups (top left), and finally completes the cycle by improving to leading groups (top right) again.
Here is the RRG chart of the major countries and regions of the world. All ETFs are priced in USD and therefore all currency effects are already part of the returns. The rotation analysis was performed relative to MSCI All-Country World Index (ACWI).

My interpretation of the RRG chart indicates that US stocks are poised to take the leadership position again, after a brief hiatus. Emerging leadership can also be found in the resource producing countries of the world, such as Australia, Canada, Latin America, and Russia. European and Asian stocks, which had been the leaders, are starting to consolidate and they are likely to begin to weaken on a relative basis. These patterns are consistent with my thesis of a developing reflationary blow-off equity market top.
Eurozone: A Merkel and Macron acid test
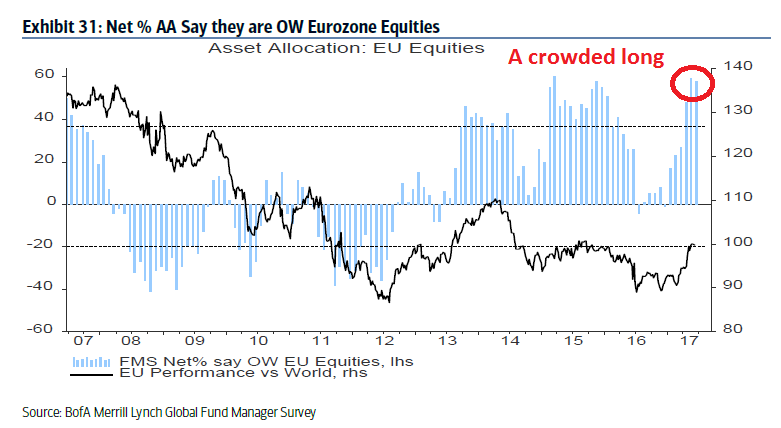
Let’s review each region, one by one, starting with the Eurozone. Eurozone equities, as represented by the Euro STOXX 50 (FEZ), has shown a history of “false dawns”. The chart below shows the relative performance of FEZ against ACWI for the past 10 years. While FEZ has been in a long-term relative downtrend against ACWI during that period, it has exhibited a pattern of rallying out of a relative downtrend, consolidate, and the resume its underperformance again. Each time, the market has been seduced by the false promise that the European authorities have finally gotten their act together, only to be disappointed.

Will the promise of a Merkel/Macron led Europe prove to be another mirage? The market is starting to show some signs of disappointment, despite the series of better than expected economic growth statistics emerging out of the euro area.
Investor sentiment is at crowded long levels, so expectations are high. The June 2017 BAML Fund Manager Survey shows institutions at a crowded long in eurozone equities.
Tony Welsh at Ned Davis Research also pointed out that funds flows into Europe have switched from net outflows last year to inflows. Europe is becoming the consensus long.

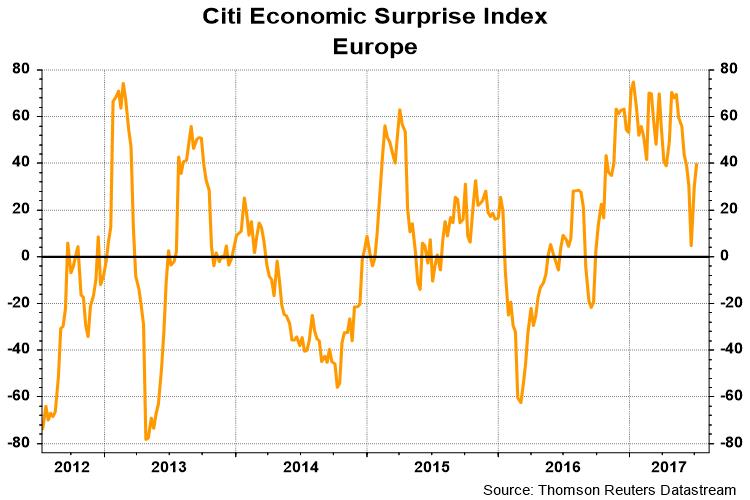
From an economic news perspective, the Citigroup Eurozone Economic Surprise Index is already at elevated levels. With bullish sentiment already elevated, the risk/reward ratio of upside to downside surprises is not favorable.
U-S-A!
By contrast, US ESI is bottoming and starting to turn up. As ESI is designed to be a mean reverting index that naturally adjusts to market expectations over time, the scope for American economic surprises is far higher than it is in Europe.

The relative performance of US stocks relative to ACWI is also starting to show some promise. SPY has rallied out of a relative downtrend against ACWI and it is now exhibiting a consolidation pattern.
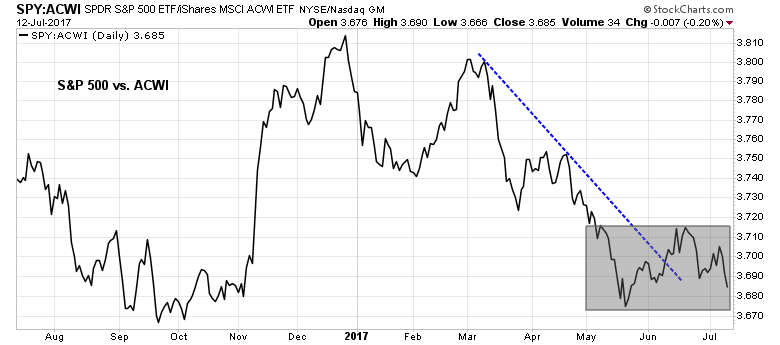
If the standard RRG rotation pattern holds, then expect SPY to begin outperforming ACWI in the weeks ahead.
Chinese Asia rolling over?
Over in Asia, the stock indices of China’s major trading partners are starting to roll over in relative strength. The relative strength patterns of Asian indices reveal a mixed bag. China remains range-bound compared to ACWI, while Hong Kong and Singapore have violated their relative uptrends, and Taiwan and South Korea remain in relative uptrends.
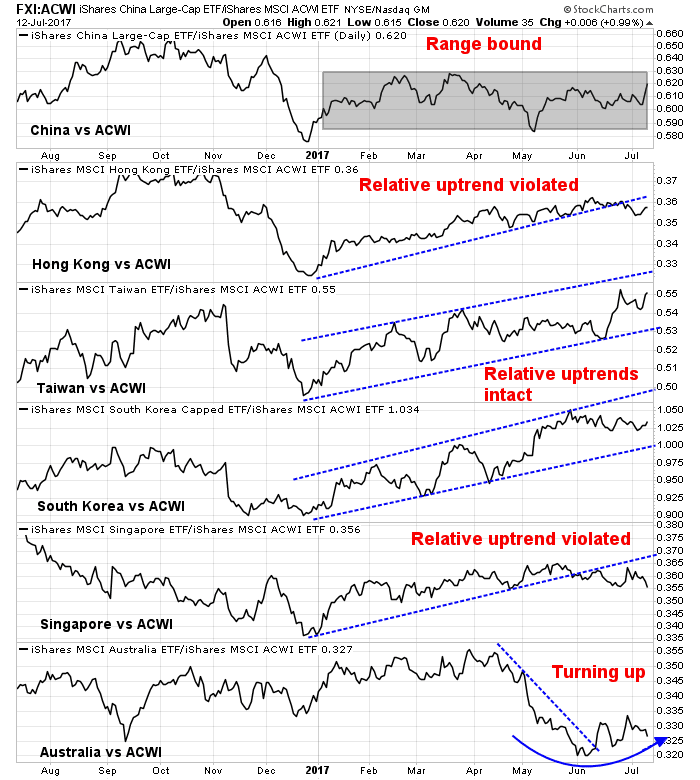
The one anomalous pattern is Australia, which has rallied out of a relative downtrend and its relative strength is staring to turn up.
Late cycle leadership
The relative turnaround in Australia is consistent with a pattern shown by the stock indices of other resource based economies. The chart below shows the relative returns of Canada, Latin America, Russia, and South Africa. All are showing similar patterns of making relative bottoms and possible upturns.
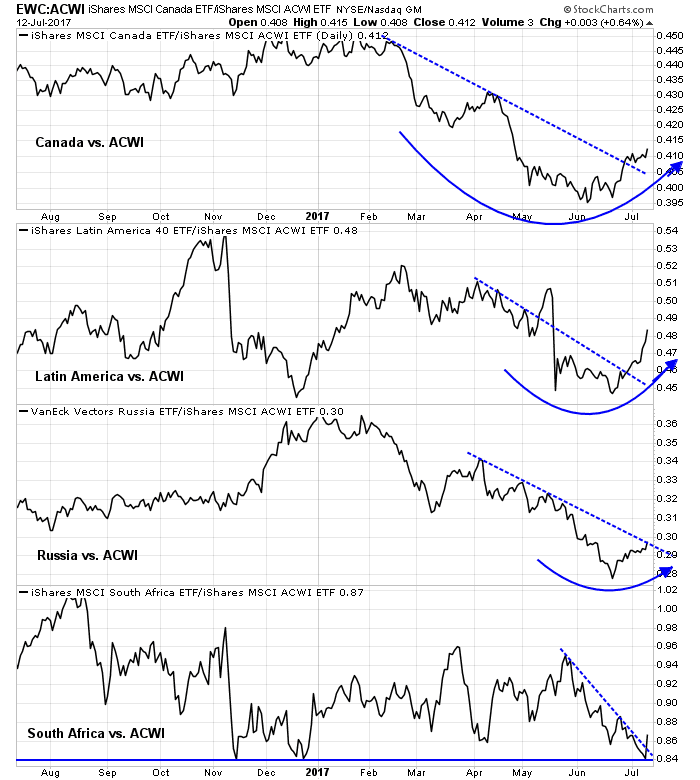
These patterns are consistent with my thesis of a reflationary blow-off in global stocks (see Nearing the terminal phase of this equity bull and More evidence of an emerging reflationary rebound). In all likelihood, the direction of the next major move in stock prices is up, rather than down.
Disclosure: Long SPXL, XIU.TO (TSX 60 ETF)
Hi Cam,
European stocks will underperform and USA’s will outperform, really? Maybe NASDAQ 100 but S&P 500?… check this out:
https://www.tradingview.com/x/r94ELTZn/
and this 4, european indexes in comparison to SPX500:
https://www.tradingview.com/x/cKyTbod9/
The disagreement is one about time horizon. The RRG analysis was based on weekly prices, while your analysis is based on daily prices. While I would allow that Europe could outperform US equities in the next few days, I would be cautious about staying long that trade for the summer.