Mid-week market update: Further to my last post (see Nearing the terminal phase of this equity bull), There are numerous signs that the market’s animal spirits are getting set for a reflationary stock market rally. First of all, the BAML Fund Manager Survey shows that a predominant majority of institutional managers believe that we are in the late cycle phase of an expansion.

Poised for a reflationary rebound
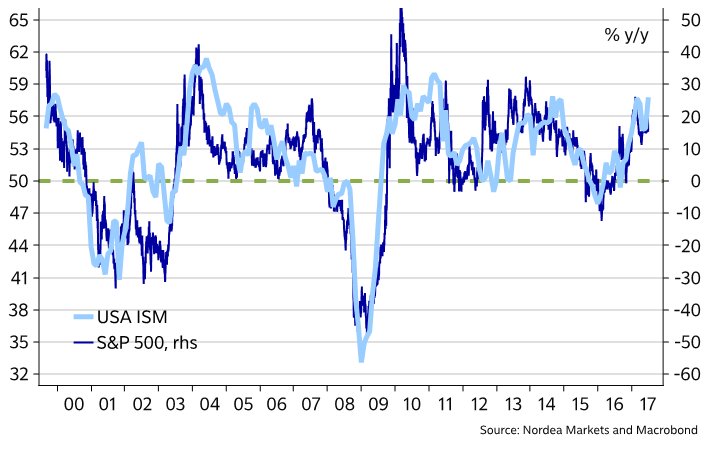
Monday`s print of ISM blew past market expectations. Nordea Markets pointed out that an ISM reading of 57.8 has historically corresponded with a YoY SPX return of 26%, compared to a current YoY return of 14%.
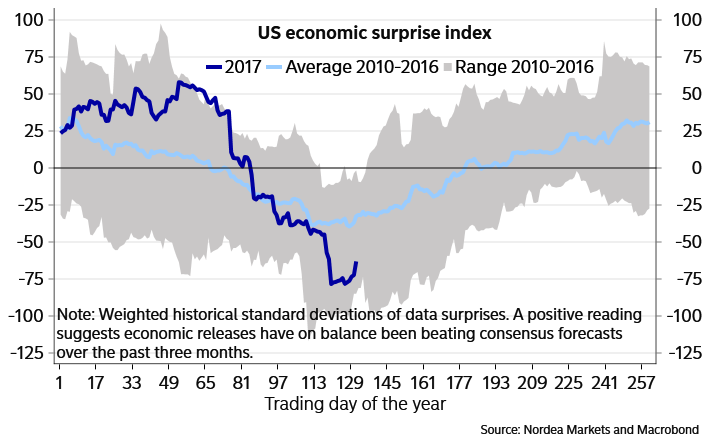
Johnny Bo Jakobsen at Nordea Markets also observed that the Citigroup Economic Surprise Index, which measures whether economic releases are beating or missing expectations, follows a seasonal pattern of Spring weakness, following by a recovery that begins about now.
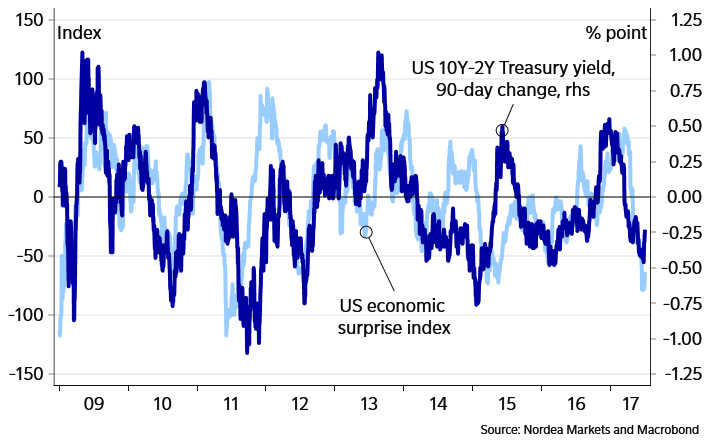
Should ESI start to rise, the yield curve has significant room to steepen.
Sector rotation = More growth
A review of equity sector leadership shows that the stock market is also setting up for the return of more growth and inflation.
First, let’s start with a primer of our analytic tool. Relative Rotation Graphs, or RRG charts, are a way of depicting the changes in leadership in different groups, such as sectors, countries or regions, or market factors. The charts are organized into four quadrants. The typical group rotation pattern occurs in a clockwise fashion. Leading groups (top right) deteriorate to weakening groups (bottom right), which then rotates to lagging groups (bottom left), which changes to improving groups (top left), and finally completes the cycle by improving to leading groups (top right) again.
Here is the RRG chart for US sectors.

There are a number of observations to make. We can see that Technology leadership has rolled over. Sectors such as Consumer Discretionary, Utilities, and Consumer Staples are also losing relative strength, and therefore should be avoided or tactically underweight in portfolios.
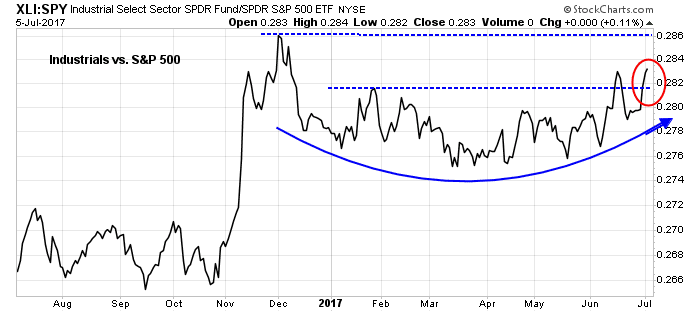
Emerging leadership can be see in the capital-goods heavy Industrial stocks, which I discussed in Nearing the terminal phase of this equity bull. The chart below shows that this sector has staged a relative upside breakout through initial resistance, though further overhead relative resistance is ahead. The macro backdrop for capital goods appears to be international in scope, as Bloomberg reported that “Euro Area faces capital bottlenecks as recovery gathers pace”.
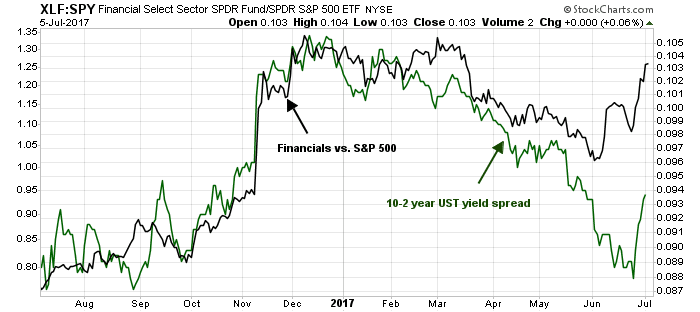
The relative performance of Financial stocks have been correlated with the shape of the yield curve. A steepening yield curve, which is the bond market’s signal of better growth expectations, should be positive for this sector.
Mining stocks appear to have bottomed out against the market and they are poised to turn up. This as another sign of a nascent reflationary bias in sector leadership.

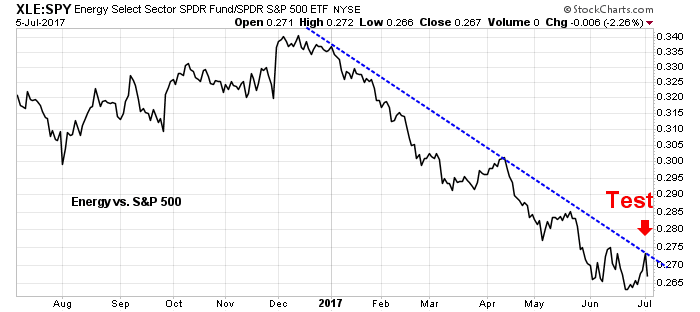
Equally intriguing for the inflation trade are the Energy stocks. Energy is in the process of testing a key relative downtrend line.
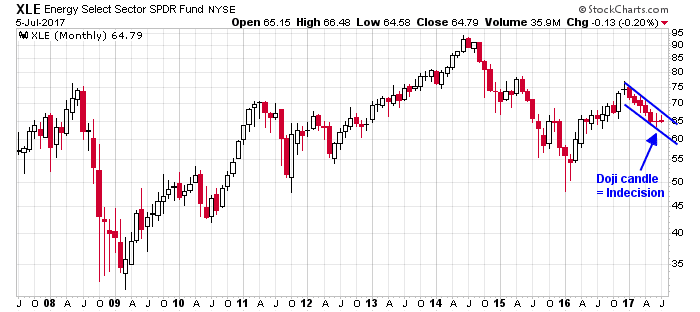
The monthly chart of the Energy stock ETF (XLE) is also displaying a constructive pattern of a doji candle in June, which indicates indecision, with a possible turnaround in the first few days of July.
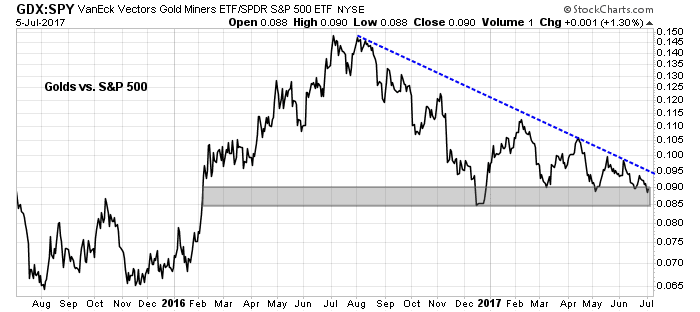
Gold stocks are currently testing a relative support within the context of a relative downtrend. For a full surge of inflationary expectations to occur, the relative performance of gold stocks need to turn up, which hasn’t happened yet.
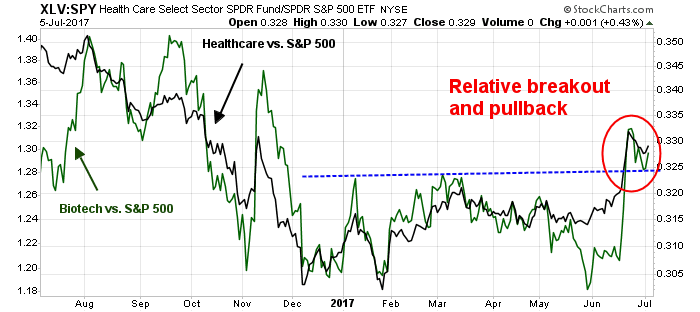
Finally, I would like to add a word about the Healthcare sector. The relative strength turnaround in Biotech and Healthcare is a function of the Obamacare repeal (and possible replacement) that is winding its way through Congress. While these stocks have bottomed and rallied, their future performance is dependent on legislation. Your guess is as good as mine as to the fate of that legislation.
Setup for a blow-off top
In addition, Ryan Detrick at LPL Research pointed out that July tends to be seasonally bullish.

As well, the market tends to perform better when returns in the first six months exceed 8%, which it has.

In short, the stars are lining up for a reflationary rally and blow-off top. Fasten your seat belts!
Disclosure: Long SPXL
The industrial sector is being given a big push by subindexes airlines and aerospace & defense. If the GOP can pass the healthcare in the Senate next week, then they will be on to tax reform which will be a big boost to industrial profits.