Trend Model signal summary
Trend Model signal: Neutral
Trading model: Bearish (downgrade)
The Trend Model is an asset allocation model which applies trend following principles based on the inputs of global stock and commodity price. In essence, it seeks to answer the question, “Is the trend in the global economy expansion (bullish) or contraction (bearish)?”
My inner trader uses the trading model component of the Trend Model seeks to answer the question, “Is the trend getting better (bullish) or worse (bearish)?” The history of actual out-of-sample (not backtested) signals of the trading model are shown by the arrows in the chart below.

Update schedule: I generally update Trend Model readings on my blog on weekends and tweet any changes during the week at @humblestudent.
I am not bearish!
First of all, I want to set the record straight. Despite the headline about a possible US stock market top in 2016, I am not intermediate term bearish on stocks right now.
There is an adage amongst technical analysts that while bottoms are events, tops are processes. The purpose of this post to outline the process of how the US equity market is likely to top out in 2016. I don’t mean to convey the impression that I believe that equities go down right away. In fact, there is likely some upside left before the market makes its ultimate top before turning down. Let me explain.
Historically, US equity bear markets have begun for two reasons:
- A recession
- An overly aggressive Federal Reserve tightening the economy into a recession
My base case scenario calls for the equity market to top out in either Q2 or Q3, but that projected timing is at best a wild-eyed guess. There are too many moving parts and too much uncertainty for my scenario to be a definitive forecast.
The anatomy of a late cycle top
In the past few weeks, I have repeatedly made the case that the US economy is undergoing a late cycle expansion. This post is really a way of putting all pieces of the puzzle together and to show how a late cycle expansion transitions into an economic slowdown.I wrote about Jim Paulsen’s analysis of how market sector leadership changes to reflect rising inflationary expectations once the unemployment rate falls to 5.0%, which is where it stands today (see The 2016 macro surprise that no one talks about). This approach has spotted five of the last six market downturns since 1968.

I have also highlighted analysis from Scott Grannis about how the market is underpricing inflation risk (see Markets may be underestimating inflation).
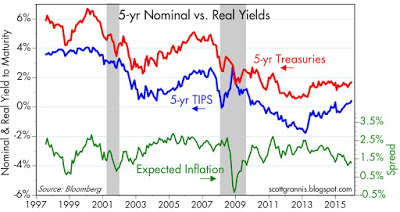
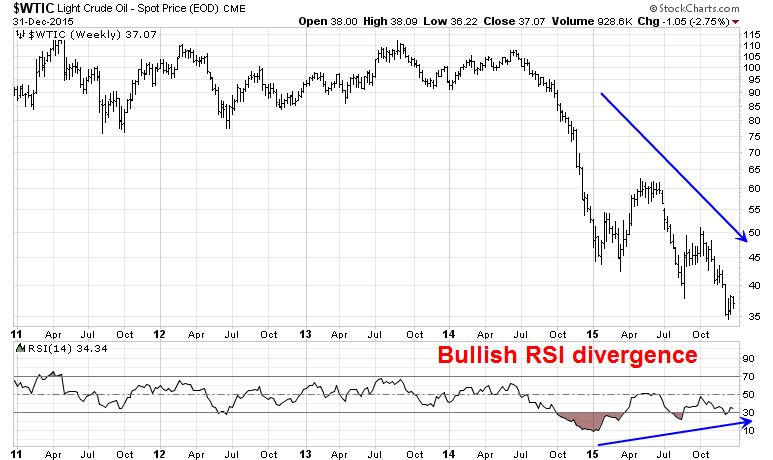
With core CPI running at about 2%, current inflationary expectations of 1.25% is in effect discounting further declines in oil prices, which seems to be an unrealistic assumption. From a technical perspective, oil prices are falling but it is experiencing a bullish RSI divergence. If the credit market is extrapolating further oil weakness, it may be in for a rude surprise in the near future.
I also documented how the current economy and market environment are evolving into a late cycle expansion, where inflationary pressure start to rise (see Profiting from a late cycle market and How the market can rise (and commodities rally)). However, market expectations indicate that the current trend of USD strength and falling commodity prices will continue. A recent post detailed the latest BoAML Fund Manager Survey indicating that global institutional fund managers are in a correlated and crowded disinflationary macro trade, consisting of long USD, short commodity stocks and short emerging market equities (see Do you believe in Santa Claus).

Indeed, the latest analysis from Dana Lyons confirms the crowded trade and shows that gold speculators have all but given up on the precious metal.

When I put it all together, it suggests that the market and the economy is in for an unexpected inflationary shock. As the market adjusts to the new reality in 2016, the big question is how the markets and the Fed react to these developments.
The Fed wildcard
The Fed is what I am most worried about. The risk of policy error is high. Tim Duy recently penned a post about uncertainty over the Fed`s reaction function to the shape of the yield curve, which reflects market expectations of monetary policy and expected inflation. Duy indicated that the Fed`s reaction function to backward looking economic statistics such as employment and inflation are fairly well known, but he was unsure of how it is likely to react to changes in market expectations:
While much attention is placed on the Fed’s failure to respond more aggressively to slowing activity and deteriorating financial conditions in 2008, I lean toward thinking the more grievous policy error was in the first half of 2006 when the Federal Reserve kept raising short rates after the yield curve first inverted in February of that year:

and despite clear evidence of slowing economic activity and increasing financial stress.
If inflationary pressures tick up, what will the Fed do?
The China wildcard
There is another major wildcard: how will currency markets will react to global developments. Bloomberg featured a terrific interview with David Woo, the chief currency strategist at BoAML (starts at about the 4 minute mark). I summarize the points that Woo made as follows:
- The US deleveraging episode after the Great Financial Crisis (GFC) was the result of its export of deflation to the rest of the world. It delevered by forcing the rest of the world to take on more debt. In the next downturn, the global economy will still have to deal with the debt overhang created by the export of US leverage.
- The inclusion of the RMB in the SDR basket now gives China the cover to engage in monetary stimulus and therefore devaluation. Before the IMF’s decision to include the yuan in the SDR basket, Beijing felt pressure to “behave” and maintain currency stability. The story has changed in the aftermath of the IMF SDR decision. The chart below showing the spread between the onshore yuan (CNY) and the offshore yuan (CNH) has been widening, which is a market signal of further yuan weakness. In the face of weakening Chinese growth, Woo believes that the PBoC has lots of ways it can stimulate the economy. (Cam: Depending on how it`s implemented, PBoC stimulus could be either be seen as highly reflationary for commodity prices and represent a positive surprise for the markets, or the markets could freak out and undergo a major risk-off episode on the prospect of a CNY devaluation and possible currency war.)

- Past experience has shown that the USD and US equities weaken after an initial rate hike. (Cam: If the USD weakens, it would be a boost for commodity prices as the two are inversely correlated. I am fairly agnostic on the issue of what happens to stocks after a rate hike, though).
Whither the USD?
David Woo’s highlights another important unknown: What will the USD do in the next few months? The USD is also an important driver of stock prices. Many US companies have cited USD strength as a headwind in their earnings calls in the last year. As the chart below of the Trade Weight Dollar shows, those headwinds should significantly diminish in Q1. Should the USD begin weaken, currency effects would turn into a tailwind for earnings and therefore be bullish stock prices.

I have also been closely monitoring the following chart as an important indicator of market direction. The USD (top panel, inverted scale) and the relative performance of Materials stocks (bottom panel) are range-bound, while the relative performance of energy stocks (middle panel) is still in a downtrend. I am watching carefully for signs of upside breakout in each of these charts before making a serious commitment to a trade.

A roadmap, not a forecast
To summarize, what I have sketched out is the process of a market top. This not a forecast, but a roadmap as there are too many moving parts and the timing of each element is too uncertain.Here is how I think 2016 will play out. Cost-push inflationary pressures tick up in the form of higher wages, which feeds into higher commodity prices, This reflationary development is positive for stock prices as it would alleviate some of the anxiety over the poor performance of junk bonds, especially if the USD declines and boosts the earnings of US exporters. Over time, rising inflationary expectations spooks the bond market and the Fed reacts. The Fed perceives that monetary policy is behind the curve and tightens aggressively, perhaps to the point of a yield curve inversion, which results in a recession.Should the economy roll over into recession, I highlighted in past posts that possible landmines planted in the current cycle. The next recession could be very ugly (see Why the next recession will be very ugly and Cheap or expensive? The one thing about equity valuation that few talk about).
The big unknowns are timing and amplitude. My base case scenario calls for a stock market top in Q2 or Q3, but that’s nothing more than a guess at this point. Ambrose Evans-Pritchard laid out a similar case of reflationary pressures, but portrayed 2016 as the “sweet spot” for growth and postulated the ugliness won’t happen until 2017. His scenario is also well within the realm of possibility.
The biggest question to be answered is the reaction of the USD to market and economic developments. If greenback strength continues, then it could dampen the volatility and stretch out the length of the topping process. Commodity inflationary pressures would be more muted and the Fed’s response will be as well (because a strong USD would be a form of monetary tightness). On the other hand, if my base case scenario of a USD pullback, commodity inflation comes true, then rising inflationary expectations will become far more evident and it will create pressures for a stronger response from the Fed.
What happens next? I have no idea. My crystal ball is out at the shop for repairs. All I can do is to watch for signs of a change in the character of the markets, in the form of market leadership (late cycle sectors, value vs. growth, etc.) and monitor how the bond and currency markets evolve over time.
The week ahead


I think you may be too quick to dismiss a recession as being the cause of a new bear market. As befits a “New Deal Democrat” as he calls himself, the fellow who put together your recession watch indicators is presumably a Keynesian, which, if so, means he doesn’t have much of a clue about how the economy actually works.
At least six of the seven long leading indicators he follows, and maybe all seven, might be reasonably useful were they honest reports of how the economy is going. But with the heavy hand of the Fed on the economy since the housing collapse, and an indirect impact from other clueless central banks, all except “real retail sales” are greatly affected by central bank action to manipulate interest rates from wherever they would be in a free market. It is as if a doctor showed you the thermometer, telling you he cured the patient’s fever, and you ignore the fact that you saw the doc put an ice cube on it first.
Quite a few economic indicators of late have shown we are already on the edge of a recession, or barely treading water just above that line, such as the latest “GDP Now” figure from the Atlanta Fed showing 1.3% growth. Figures on new industrial orders are weak, inventories are rising, and there are many other traditional “edge of recession” signs. In these conditions, all it takes something random to pop up and cause consumers to hold up purchases, and that triggers the recession. Could this current Saudi-Iran tiff escalate and be the random triggering event this time? Maybe, but if not it will probably be something else in 2016.
I don’t disagree with the rest of your argument, but I think you place more faith in your recession watch indicators than they deserve.
Note that, regardless of his politics, his approach is based on the indicators of Geoffrey Moore whose recessionary forecasting work has been very, very good over the past few decades.
No doubt. But during most of those decades, the scales he was using didn’t have the heavy thumb of the Fed all over them, distorting their readings.
I would be cautious about getting overly ideological about your market analysis. If you believe the Fed is either manipulating or ruining the market mechanism, then you need to build, test and validate a new analytical framework. Otherwise you will get into trouble.
I have my own political opinions, but I recognize that politics and investing don’t mix well.
The only indicator used by NDD that I would discount right now is the shape of the yield curve in forecasting a recession because of ZIRP.
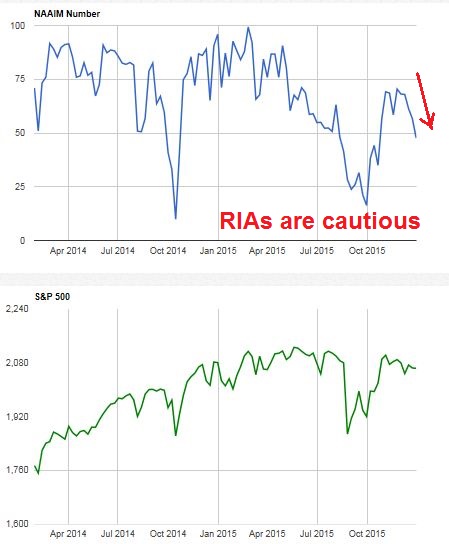
I think you are misreading the “insiders” . The Gambill Insider Ratio is 22.7. While that isn’t bearish, it’s not that bullish, either. And I think the RIA’s are flawed and have misled you before. The Rydex Ratio is high (bearish), reflecting what people are really doing with their money. (see my post on this on the previous article)
If you have a stockcharts.com subscription, take a look at this chart of Rydex fund flows:
!CCFBEARM:!CCFLALLEX
Those readings are neutral.
Another bearish indicator I have seen recently is a plot showing that total profits available to S&P 500 companies has been declining in recent quarters. It is only stock buybacks that have created the appearance of increasing profits when expressed on a per share basis. If one believes the market to be closer to a high than it is to a low it appears that the companies are practicing a ‘buy high, sell low’ strategy. They seem to be using margin (debt) to fund buybacks. Sort of like homeowners taking out home equity loans to increase the value of their asset during the housing market euphoria only to find their net asset value, accumulated over a lifetime, severely reduced in very short order.
Yardeni made this point before. With interest rates so low, it made sense to borrow and buy back stock in order to optimize capital structure and the cost of capital. It’s just when rates rise that maneuvers like this come back to haunt you.
We need to watch what happens to the yield curve as short rates rise. Will long rates rise equally or will the yield curve flatten as companies tend to borrow at the long end of the curve.
Concerns about inflation have been the biggest miss by every economist and Central Banker in recent years. It is why the Fed delayed its first move and why Europe and Japan keep their QEs going. The answer is simple, the digital revolution and globalization are putting consistent surprising downward pressure on prices. It is healthy lower prices and not ‘nasty deflation’. Corporate profit margins stay high even as sales growth is anemic in sectors outside commodities. Corporations are becoming more efficient with the new technologies. The TPP is another example of trade barriers and import duties disappearing which keeps prices down.
Everyone has erred in expecting rates to go up. The Fed ‘Dot Plots’ have been wildly off in predicting for years. With the Fed’s Dual Mandate, they must have inflation at 2%. This has proven very difficult even after flooding the economy with QE cash. I expect surprises that inflation will be lower that expected will be with us for decades. It is absurd that Central Bankers keep prices up artificially and not allow the benefits to consumers of lower prices due to technology and global job sharing in a healthy economy.
As long as they have their inflation mandate and it is undershot, they will shy from raising rates.
David Rosenberg has shot down the notion that today’s 5% unemployment rate is like history. He notes the participation rate has fallen dramatically since 2008. If we had the same participation rate, the unemployment number would be 9% today. He feels the Fed is not as happy with the 5% number as observers think. Hence they will not raise rates as much as feared.
Following on from Wes’s comment I have also been wondering about the Barron’s Insider measure. According to John Seville of AcornWealth he says that using the “raw” data under Insider in FINVIZ that most of the insiders have been selling recently. I just checked it now by clicking on “Insider/Top Insider Trading Recent Week” and it looked pretty negative to me (i.e. for the week finishing on 30th Dec.). However if you click on “Top 10% Owner Trading Recent Week” then it gives a much more bullish outlook but the list is very short compared to the previous one.
Could it be that the Barron’s list only includes a small sample of insiders as it says under the Barron chart that “An insider is any officer, director or owner of 10% or more of a class of a company’s securities” ? This seems to exclude many people with inside information who may not own 10% of the company as per the first FINVIZ list above.
This is an issue that I will need to investigate more completely. Different people analyze insider data differently.
For example, if you get exercise a stock option and sell, how is that counted? Some analysts ignore that transaction. Similarly, what do you do with someone who starts a divestment program of selling off his stock holdings on an equal basis over time.
Other analysts weight buying by directors and officers differently.
All the above issues of stock buy backs, black swan events ( Saudi Arabia and Iran going to war) I had brought up in my previous post. The only few observations I can add are the following:
1. We as investors, traders have been numbed into believing in relative performance as opposed to absolute performance. The fact of the matter is a 10% hit on a $1,000,000 portfolio is $100,000 a number that is significant and not something to sneeze at.
2. In most cases why the market is going down is always known after the fact. Few investors new about the sub-prime loan problem in 2007 till the market had gone down substantially.
3. As a trader one has to focus on the short term and intermediate term as it inevitably leads to a change in trend. I doubt anybody was clairvoyant enough to imagine that the bull market that started in 2009 would last this long or for that matter we would go this long without a 10% correction.
4. The divergence between the Dow Jones Transportation Index and the Dow Jones Index is saying something is out of kilter. Add the weak performance of the Value Line Index and the New York Composite and we have reasons to be cautious.
5. Early this year (May-June) the number of stocks in the S&P 500 trading above their 200 day moving average was close to 75-80% today it has dropped down to 48%. If that was not bad enough all indexes are trading below their 200 day moving averages with the exception of the Nasdaq which has a few stocks (Amazon, Facebook etc.) holding up the index. These stocks have extremely high multiples. The definition of downtrend is a stock or index trading below its 200 day moving average. If history is any guide they will get washed out before a final bottom is reached. The risk is it can be 5 to 10% below current prices or maybe more or the start of a bear market. Only time will tell.
6. In these days of high frequency trading and flash crashes the luxury of getting out with a small loss may not be there. 1987 and August 2015 are reminders of the fragility of the market where the market gaps open more then 10%.
All good points, the points you make are technical, not fundamental. Most of my post analyzed the market from a macro and cycles perspective. They are very different approaches.
Cam you have a point that the discussion was on technical analysis. However, the conclusion was that the market was seeing something fundamentally wrong hence it was going down i.e a drop in corporate earnings, deflation etc..
Here is another food for thought based on fundamentals. Excess liquidity injected by the various central banks has caused excessive valuations (P.E multiples) which would not have occurred in normal times. So a market that is trading at 18 times should be trading at 15 times or lower multiple. Therefore you can yet have a bear market where there is earnings (P.E.) compression with a muddle through economy which would not be defined as being in a recession as the Federal Reserve normalizes interest rates.
I agree with you 100%. When rates rise, it puts pressure on E/P to rise and therefore P/E multiples to fall. In a typical expansion, the economic environment that takes hold during the start of a rate hike cycle is that the positive effects of earnings growth overpowers the negative effects of P/E compression. We will have to see what happens this cycle as the Fed is hiking much later.
How do you reconcile your opening statement that your trading model is bearish with your last line that you are long two 3x long market ETFs? The 3x ETFs are not good to own multiple days or even overnight if you’re wrong about market direction. For example, let’s say you start with $100 and the market goes down 10% then recovers 11%. A 1x market ETF is now at $99.90. But a 3x ETF went down to $70 and recovered only to $91.
I got the bearish signal on the weekend after the market close. It was unfortunate given the Monday market action, but these things happen.
Cam, I’ve figured out the reason we’re seeing different Rydex ratios. The ratio I look at includes only the LEVERAGED funds from the Rydex family. These are much more sensitive to sentiment, and as I said are quite bullish as of the weekend. During the August decline this went from very bullish at the start of the decline to quite bearish at the bottom as the holders swung from long to short. Sorry for any confusion.
FWIW, I got a screaming buy signal from my Rydex indicator during August and September correction.
As an addendum, I’ll point out that the leveraged Rydex funds are not routinely held because of the decay issues, so the volumes and switches are much more dramatic.