Trend Model signal summary
Trend Model signal: Neutral
Trading model: Bullish
The Trend Model is an asset allocation model which applies trend following principles based on the inputs of global stock and commodity price. In essence, it seeks to answer the question, “Is the trend in the global economy expansion (bullish) or contraction (bearish)?”
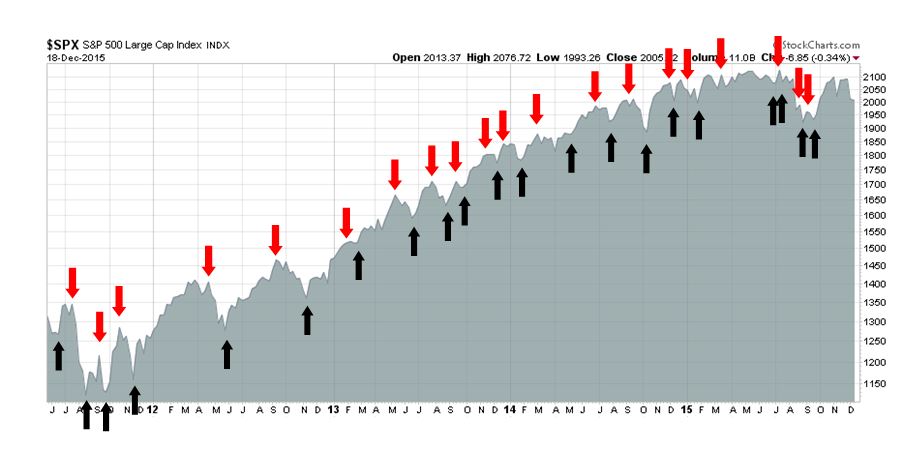
My inner trader uses the trading model component of the Trend Model seeks to answer the question, “Is the trend getting better (bullish) or worse (bearish)?” The history of actual out-of-sample (not backtested) signals of the trading model are shown by the arrows in the chart below.
Update schedule: I generally update Trend Model readings on my blog on weekends and tweet any changes during the week at @humblestudent.
Hitting the Exacta
Regular readers know that I have been bullish on stocks for a couple of months now. While I had expected a seasonal Santa Claus rally, Santa hasn’t been around and stock prices have been weakening. In one way, Old St. Nick may have left a present for the bulls under the tree as the recent sell-off has left the market oversold. As a result, two of my Trifecta Bottom Model indicators have flashed a buy signal. I call this hitting the Exacta.
My Trifecta Bottom Model (which was described in a past post Sell Rosh Hashanah?) consists of the following three conditions, which must occur closely (within a week) of each other:
- VIX term structure (VIX/VXV ratio) inversion
- NYSE TRIN more than 2
- My favorite intermediate term overbought-oversold model, which is the ratio of % of SPX stocks over their 50 day moving average (dma) / % of SPX stocks over their 150 dma less than 0.5
 |
| Trifecta Bottom Model |
Last week, the market hit the Exacta again as the VIX term structure inverted and TRIN spike to over 2 within a week of each other. The question is whether this is August 2015 all over again, or a run-of-the mill instance of a short-term bottom.
No recession on the horizon
To answer that question, let`s consider the macro and fundamental backdrop to measure the risk of a major leg down in stock prices. First and foremost, is there is any significant risk of a US recession? Recessions are triggers for major bear markets.
I use a framework used by New Deal democrat to spot recessions a year in advance. He utilizes seven long leading indicators, which you can keep track of at my Recession Monitor. Currently, I would classify the indicator this way (links are to FRED graphs and comments from New Deal democrat are shown in parenthesis):
Positive, indicating little or no recession risk:
- Housing starts (Housing starts peaked at least one year before the next recession)
- Money supply growth (In addition to the 1981 “double dip,” on only 2 other occasions have these failed to turn negative at least 1 year before a recession)
- Residential real private investment (Aside from the 1981 “double-dip,” and 1948, it has always peaked at least one year before the next recession)
- Real retail sales (It has peaked 1 year or more before the next recession about half of the time)
Cautionary: Corporate profits have peaked and proprietors income have flattened. Call this a slight negative.
- Corporate profits and Proprietors` income, which can be a more timely proxy for corporate profits (Corporate profits have peaked at least one year before the next recession 8 of the last 11 times, one of the misses being the 1981 “double-dip.”)
Negative, but this indicator is somewhat unreliable as corporate bond yields have made lows as much as four years before a recession.
- Corporate bond yields (Corporate bond yields have always made their most recent low over 1 year before the onset of the next recession)
Not relevant in the current environment
- Yield curve (The yield curve inverted more than one year before the next recession about half the time)
Forward EPS growth still positive


Insiders are buying
What are the “smart money” insiders doing? The latest report from Barron’s indicate that insiders are still buying heavily:
To summarize, there are no macro or fundamental reasons for a major bear market to be starting here. Risk levels are relatively low.
Will the USD give bulls a second wind?
I wrote last week that the US Dollar is the key to providing the bulls a second wind to the bull market (see The only market indicator that matters in 2016). So far, the jury is out and we are still waiting for the verdict in the form of an upside or downside breakout from a trading range.
Here is what I am watching. Should the USD weaken, then it provide a boost to the earnings of US companies operating overseas – hence the second wind for the bulls. So far, that hasn’t happened yet. One other benefit of a weaker USD would be stronger commodity prices, as the two are inversely correlated with each other. The top panel of the chart below shows that the greenback has strengthened a little but it has been volatile in the post-FOMC decision period, but remains in a sideways consolidation phase. The next two panels show the relative performance of energy and materials stocks against the market. While energy remains in a relative downtrend, materials stocks have been consolidating sideways on a relative basis.

One bright spot for commodity bulls comes from the strengthening AUDCAD currency cross rate. This cross rate is important as both Australia and Canada are major commodity exporters, but Australia is more exposed to China while Canada is more exposed to the US economy. Another key difference is Australian commodity exports are tilted towards bulk commodities like iron ore, while Canadian exports are higher weighted in energy. As the bottom panel of the chart above shows, AUDCAD has been rallying, which is a possible indication of renewed Chinese growth. The AUDCAD rally cannot be explained by the bulk vs. energy differential as the solid line showing the the relative performance between mining stocks and energy stocks is weakening.
I continue to believe that the USD is poised to weaken and the implications of that reversal will be bullish for stocks and commodity prices.
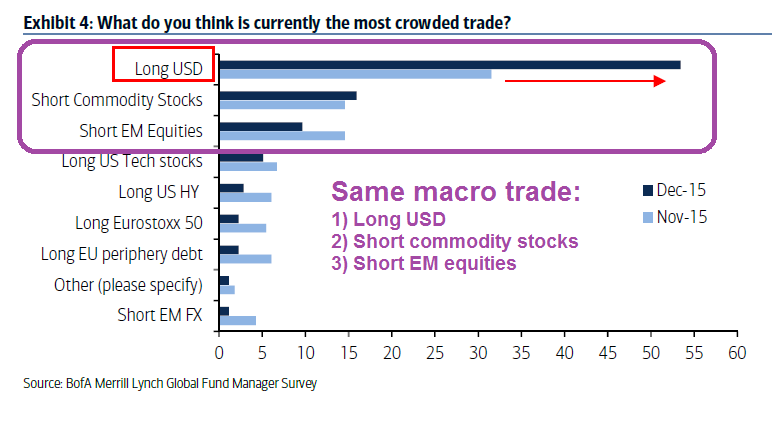
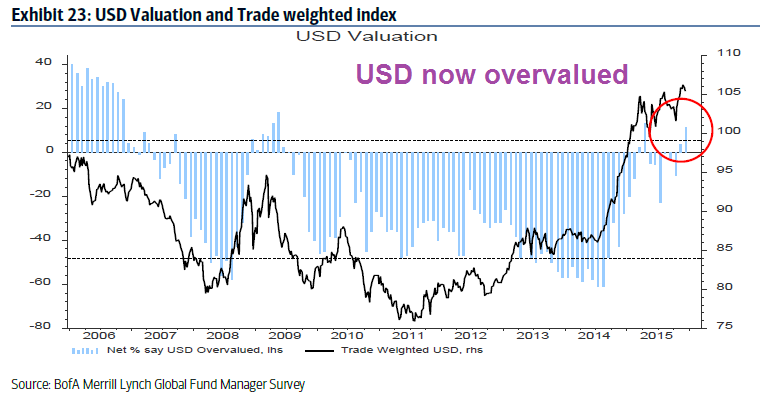
The latest results from the BoAML Fund Manager Survey of global institutional managers is revealing. When asked what they though the most crowded trade was, institutional managers cited long USD, short commodity stocks and short emerging market (EM) equities – in that order. Since those three themes all correlated to each other, the top three most crowded trades is in effect the same macro trade (annotations in purple are mine):
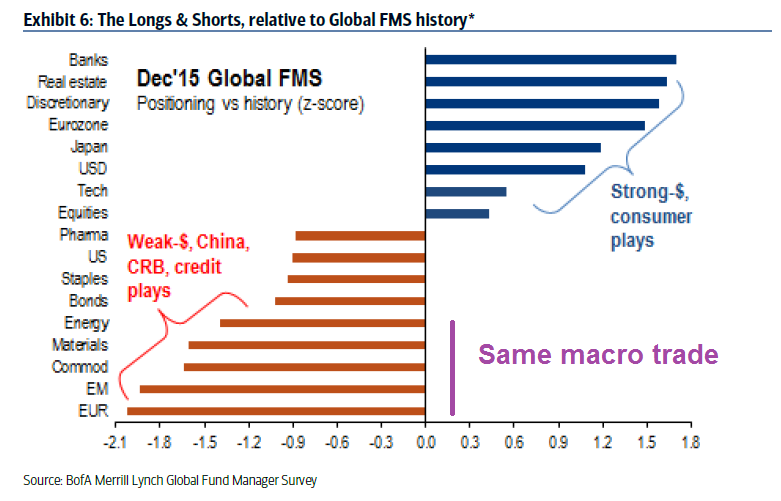
When asked what their own portfolio position was, the answer was about the same. Global managers have a crowded long in the USD:
Yet, they thought that the USD is overvalued. So why are they in a crowded long USD macro trade?
When asked what phase they thought the global economy is in, the consensus seems to be shifting from mid-cycle to late-cycle, which is the phase when inflationary pressures start to manifest themselves and commodity prices rise.

Setting up for a late cycle market
In effect, the 1H 2016 market is setting up for a late cycle expansion, when inflationary pressures start to rise. Scott Grannis believes that the market is in for an upside surprise in inflation:
The collapse of crude oil prices since mid-2014 has not only devastated the oil industry, it has also sowed confusion over the issue of inflation. Since crude prices started falling in the summer of 2014, headline inflation fell from 2% to essentially zero for most of this year. Yet if we exclude energy from the calculation, inflation has been fairly steady at 2% for a long time. This bears repeating: if not for the big decline in oil prices in the past 18 months, the underlying trend of inflation at the consumer level would have been 2% for the past 13 years.
Energy prices are not going to fall forever; once they simply stabilize, then headline inflation should bounce back to 2% fairly quickly. The Fed understands this, but—arguably—markets do not, since key measures of inflation expectations over the next 10 years range from 1.25% to 1.8%, and those expectations assume that oil prices will decline substantially further in the next year or so.
The market expectations of forward inflation is 1.25%, which is in effect discounting further declines in energy prices:

The chart above shows the nominal yield on 5-yr Treasuries, the real yield on 5-yr TIPS, and the difference between the two, which is the market’s expectation for the annualized rate of CPI inflation over the next 5 years. Currently about 1.25%, it is significantly less than the prevailing rate of ex-energy CPI inflation. Either the market is correctly anticipating more and substantial declines in energy prices, or it is seriously underestimating future inflation.
The Fed understands these dynamics, and that was made evident in a recent speech by Janet Yellen:
Regarding U.S. inflation, I anticipate that the drag from the large declines in prices for crude oil and imports over the past year and a half will diminish next year. With less downward pressure on inflation from these factors and some upward pressure from a further tightening in U.S. labor and product markets, I expect inflation to move up to the FOMC’s 2 percent objective over the next few years.
On the other hand, I would not be overly concerned about an overly aggressive Fed in 2016. In the latest round of post-meeting Fedspeak, Reuters reported that San Francisco Fed president John Williams indicated that the Fed plans on running a higher pressure economy for a while (translation: tolerant of higher inflation):
Though much more optimistic about the economy than in prior years, Williams said that at the end of this week’s meeting, there was no round of high-fives among the 17 policymakers at the table.
“We are not done: we still have inflation unquestionably running stubbornly low due to mostly, I think, global factors,” he said.
To keep job creation strong, rates will need to stay low, rising only modestly next year, he said, adding: “We are going to run a higher-pressure economy for a while.”
The scenario that I envisage for 2016 involves a transition to a late cycle market. Inflationary pressures rise, the USD falls and interest rates rise. For the stock market, this translates to a topping process with the following characteristics:
- A change in leadership to late cycle resource and capital goods plays
- A short-term boost to earnings and therefore stock prices because of the falling Dollar
- Followed by a faster than expected pace of Fed tightening, which will eventually unsettle markets (as per Grannis)
Readers might gasp at my use of the term “topping process”, as I have been relatively bullish recently. I would qualify that term by stating that it would be overly premature to be selling out now, as investors will miss the last boost to the market from the tailwind of the effects a falling USD in boosting EPS growth. The key is to watch for downside risk by monitoring signs of impending recession with my Recession Monitor.
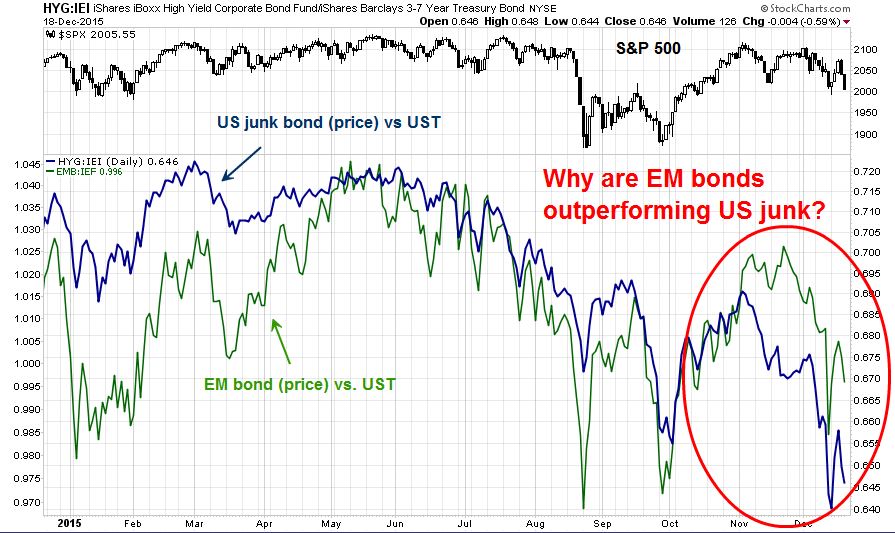
Even the recent carnage in the US junk bond market is nothing to freak out about. It is a source of concern, not a cause for alarm. While I am well aware of the bearish conclusions drawn by other analysts from the sell-off seen in junk bonds, there hasn`t been an adequate explanation as to why EM bonds are outperforming US junk. The chart below shows the relative price performance of US junk to their duration equivalent Treasuries (UST) compared to the relative price performance of EM bonds to their duration equivalent UST paper. If the stress in US junk market is so high, shouldn’t they be even be higher in emerging markets?
The week ahead: Waiting for Santa Claus


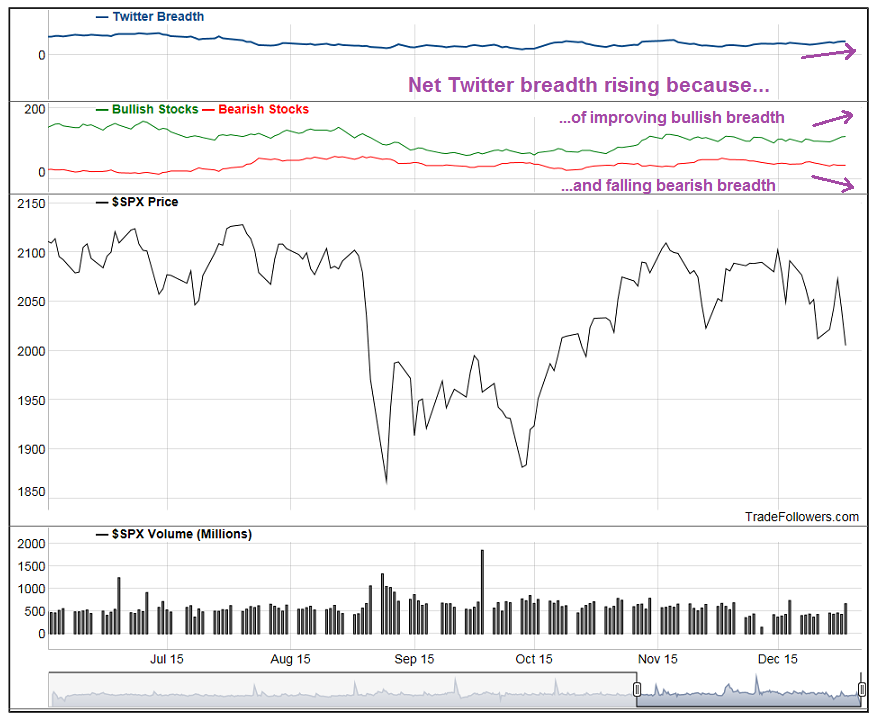
In addition, analysis of Twitter breadth activity from TradeFollowers is also supportive of the bull case. Even as the market declined, bullish Twitter breadth remained strong while bearish Twitter breadth weakened, which is indicative of bullish market internals (purple annotations are mine):
Cam, Wasn’t the exacta signal also valid going into Friday (12/18) ? Not such a good result there. Is there any data on how long one must wait ? If the answer is the next trading session, it would seem that the signal has already failed. Your comment ?
One thing I noticed about Friday is the advance decline issues and up down volume were not as bad as the overall indexes?
Wes,
The Trifecta Bottom Model is intended to spot an extreme oversold condition. Just because a signal is triggered, it doesn’t necessarily mean that the market has to go up right away. Oversold markets can get more oversold.
That said, the bottom tends to occur within 2-3 days after the signal.
Thanks, good to know.
Hi Cam….great to see some comments on this, the new site.
Your trifecta model gets a huge thumbs up from me….I was most impressed with it’s guidance on both Aug 25th and Sept 28th this year.
As someone once said, technical analysis is not a crystal ball, it’s more a wind-sock: indicating direction and intensity….I like the concepts behind the trifecta model.
There is also the good possibility that we have low or marginal growth and high inflation (rise in commodity prices including oil) causing stagflation similar to the 1970s.
I noticed that the OBOS was > 1.25 from early Oct to early Dec ’15, which hasn’t been at those levels in the 3 year period your chart covers. In which case, I wonder if the “level” (as you’ve suggested of 0.5) trigger might be replaced with a “rate of change” trigger. I bet in that case this could be a trifecta signal?
Furthermore, do you have additional history of this 3-way signal that covers “late cycle markets”? Maybe 2005 to 2009 or 1997 to 2001? It makes me wonder if we’re comparing apples and oranges when looking at clues about our current transition into a toppping/late-cycle market from a early/mid cycle market over the last 3 years.
We really didn’t have a VIX term structure until 2008 so the history of this indicator doesn’t go that far back. However, I can say that this is an OS indicator (doesn’t work well as an OB indicator). Oversold markets can get very oversold in bear markets and that’s why I qualified the signal by analyzing the probability of a major bear market.
Cam tweeted about the work of JLyonsFundMgmt. Dana Lyons also likes to look at the Value Line Geometric Composite (VLG) and Value Line Arithmetic index (VLA). The long term up trendline from 3/2009 seems to be broken on the VLG (weekly chart) on 8/21/15 and the VLA is barely hanging on, having closed this past week at 4265, slightly below the up trendline from 2009.
What’s your reasoning behind the yield curve not being relevant in the current environment? There’s been a bit of buzz lately about the breakdown when looking at 10s minus 2s and the 1.2 area holding.
You are correct about the 2/10s, but it’s pretty hard for the yield curve to fully invert when T-Bill rates are so close to zero.
Also see this discussion from Tim Duy about the Fed possibly oblivious to the shape of the yield curve: http://economistsview.typepad.com/timduy/2015/12/what-is-the-feds-expectation-for-financial-markets.html
Need to keep an eye on this. If true it would be highly disconcerting.
although this year is a bit weird due to fed and high yield market, end of dec to Jan tends to work in favor of crowded trades b/c managers need to re-position for new year. rest of the year, crowded non-performing trades are very dangerous.
In a normal world, the U.S. dollar would peak and resources and non-U.S. markets would outperform. Experience investors would shift to a medium term ‘late-cycle’ investing mode. But we have never been in a world like today where European and Japanese QE is in full force with negative rates in Europe, 23 Central Banks dropping rates in 2015 while the Fed is boosting rates and their Dot Plots show a ramping up of rates for the next two years.
Cam, I expect short term movement along the paths you mention as experienced investors invest along seasonal lines and take advantage of tax-loss selling pressures coming off those sectors that have been beaten up the most in 2015. But I expect this will be short lived, surprising seasoned investors. As we have discussed privately, it is my belief that one’s experience works against us today since the digital revolution, globalization and unorthodox monetary policies have changed the investing landscape incredibly. I will use momentum as a guide. That means owning outperforming sectors almost always and only buying a small weighting in underperforming sectors when they are in a panic, puke phase like commodities now. But I will sell them at the first sign of weakness, much sooner than I used to.
Has the world ever been normal?
Lol! Do you want the geek answer to that question?
No way! I want to believe in Santa Claus!
Hi Cam, do you have an imagination how long will Santa C. rally last (price/time)? Thanks and Merry Christmass.
Petr