Preface: Explaining our market timing models
We maintain several market timing models, each with differing time horizons. The “Ultimate Market Timing Model” is a long-term market timing model based on the research outlined in our post, Building the ultimate market timing model. This model tends to generate only a handful of signals each decade.
The Trend Model is an asset allocation model which applies trend following principles based on the inputs of global stock and commodity price. This model has a shorter time horizon and tends to turn over about 4-6 times a year. In essence, it seeks to answer the question, “Is the trend in the global economy expansion (bullish) or contraction (bearish)?”
My inner trader uses the trading component of the Trend Model to look for changes in the direction of the main Trend Model signal. A bullish Trend Model signal that gets less bullish is a trading “sell” signal. Conversely, a bearish Trend Model signal that gets less bearish is a trading “buy” signal. The history of actual out-of-sample (not backtested) signals of the trading model are shown by the arrows in the chart below. Past trading of the trading model has shown turnover rates of about 200% per month.
The latest signals of each model are as follows:
- Ultimate market timing model: Buy equities
- Trend Model signal: Risk-on
- Trading model: Bullish
Update schedule: I generally update model readings on my site on weekends and tweet mid-week observations at @humblestudent. Subscribers will also receive email notices of any changes in my trading portfolio.
What’s the contrarian asset class?
Being a contrarian is a lonely life. You don’t hang out with the popular kids. You are probably the nerd in the class. You get picked last in team sports. You don’t get invited to any of the parties. And even if you do, everyone laughs at you.
Over at Macro Man, he put us in a contrarian state of mind by asking, “What’s the unloved asset class?”
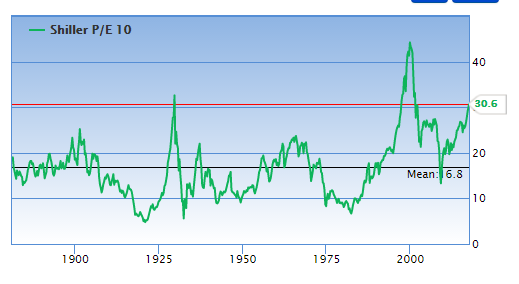
The question was not in the context of a trade, such as short FAANG, but an asset class that you buy and hold for the next few years. Going down the list, he rejected US equities for the reasons of high valuation.
He also rejected developed market fixed income, as well as all forms of credit. The cap rates on commercial real estate isn’t offering great value either.
Private equity? Just look at the cash on the sidelines waiting for deals.
At the end, he concluded, “Hmm, cash and gold seem to check a lot of boxes.” No wonder contrarians don’t get invited to parties.
Cash? Gold? While I believe that it’s still a little early to get overly bearish on equities, but here is how a scenario that favors cash, gold and other commodities may develop.
Sentiment extremes
Cash makes sense if an investor is looking over the next couple of years. As I have demonstrated in my series “Things you don’t see at market bottoms”, sentiment is getting a little frothy.
- Things you don’t see at market bottoms, 23-Jun-2017
- Things you don’t see at market bottoms, 29-Jun-2017
- Things you don’t see at market bottoms, bullish bandwagon edition
- Things you don’t see at market bottoms, Retailphoria edition
- Things you don’t see at market bottoms: Wild claims edition
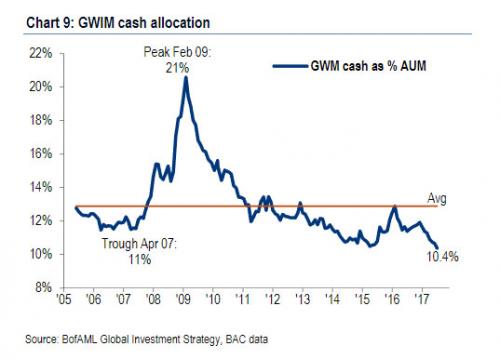
Consistent with the frothy theme, Callum Thomas pointed out that BAML private client (GWIM = Global Wealth and Investment Management) cash levels are extraordinarily low levels.
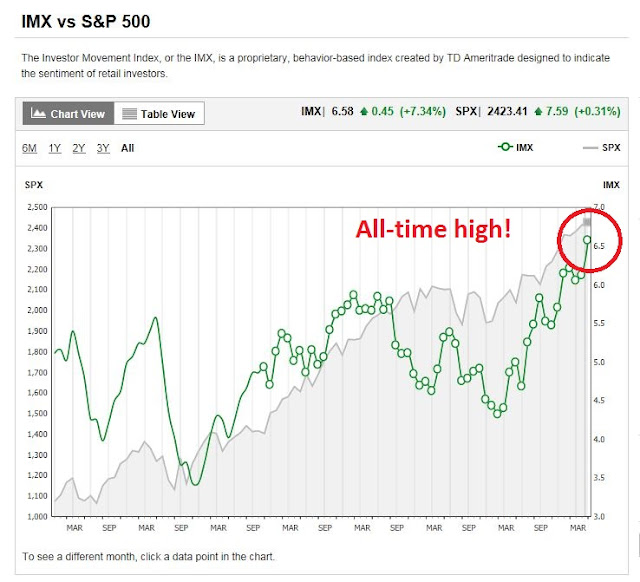
Those readings are consistent with my past observation that the T-D Ameritrade Investor Movement Index at an all-time highs, indicating a crowded long in equities. TD-Ameritrade CEO Tim Hockey confirmed the bullishness in his Q2 2017 earnings call:
We are seeing this quarter very broad-based engagement in the market, so everyone from brand-new customers opening their first account to very active traders seem to be engaged in the market. We saw a good activity across pretty much all of our products, futures were down a little bit year-over-year, because we had such a strong comparable. In terms of holdings, we are still seeing the trend where the ETF’s are increasing a bit as a percentage of assets. We continue to see good holdings in mutual funds and really across all of the products that we typically see.
As for the claim of gold as the contrarian asset class, I would generalize that category to commodities. Marketwatch recently highlighted analysis from Incrementum AG indicating that the equity/commodity ratio is hitting an extreme.
An opportunity in commodities?
From a technical viewpoint, a glance at the two major headline commodities, oil and gold, shows that both are bottoming. Crude oil seems to be a bit further ahead in that process when compared to gold. The chart below of energy equities relative to the market shows that these stocks are tracing out a broad based bottom. Energy stocks have tested the relative downtrend, but have not been able to rally through the downtrend yet.
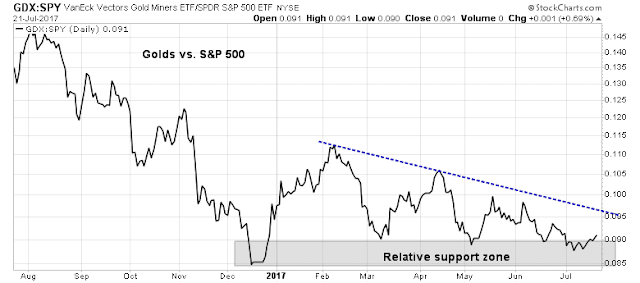
Gold stocks remain in a relative downtrend as well, though the pattern is not as well developed as energy stocks.
By contrast, metals and mining stocks, which represent the base metals, have managed to rally through the relative downtrend and they are now showing signs of a nascent market leadership role.
These chart patterns are constructive for the commodity complex as a whole, though it is still a little early for traders to aggressively take long positions in this sector.
The bull case for oil
Tactically, oil prices have been strengthening for the last two weeks on the news of falling production and better than expected inventory declines. Knowledge Leaders Capital (formerly known as GaveKal) summarized the intermediate term bull case for oil prices well in their quarterly presentation.
First, global demand is rising.
Low oil prices have provoked a supply response. Investment in new production has fallen dramatically.
In the meantime, old fields are getting depleted. Annual depletion rates are equivalent to projected OPEC cutbacks.
Could US shale and tight oil save the day? Well…the productivity of shale formations have either peaked or plateaued. While producers can easily ramp up production quickly in the short-run, it doesn’t solve the longer supply problem unless exploration budgets rise accordingly.
In the interim, where will the oil come from? The rate of discoveries have fallen dramatically, largely because of reduced exploration budgets.
Putting it all together, the Renaissance Macro oil demand model price forecast is $90 per barrel.
By contrast, a more conservative inventory model calls for oil prices to rise to the $60-65 level in the next 6-18 months.
Setting up for an inflation surprise
Should oil and gold prices start to rise, it would have important implications for monetary policy. I have pointed out before that the bond market’s inflationary expectations (blue line) are correlated with changes in gold and oil prices (black line).
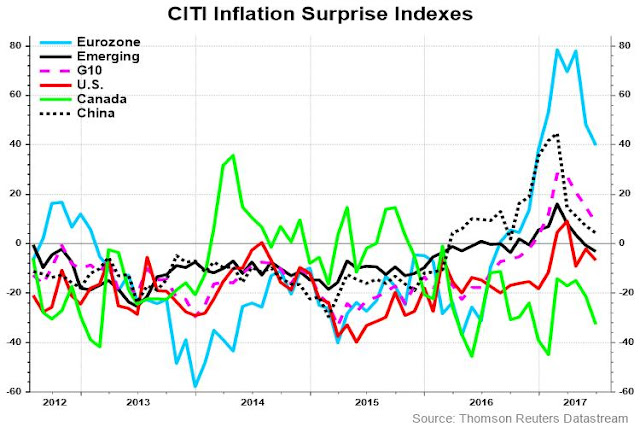
Today, the inflation outlook looks very benign. In fact, there is a long of hand wringing over how the lack of inflation is affecting monetary policy, not just at the Fed, but at the ECB as well.
Instead, I would argue that a turnaround in commodity prices would put upward pressure on inflationary expectations. In turn, that would also put upward pressure on central bankers to continue their course of monetary policy normalization.
That will the surprise of the 2nd half of 2017. Such a development will also be negative for equity prices. It is said that no one rings a bell at the top. Watch oil and gold prices for signs that someone is ascending the tower to ring the bell.
The near-term market outlook
Looking out the next few weeks, the outlook is a little mixed. On one hand, it’s hard to argue with price momentum and all-time highs in the major averages. What’s more, the fresh highs were achieved with no signs of negative divergences. The SPX Advance-Decline Line is behaving well and it has confirmed the fresh highs in SPX.
As well, signals from the high yield (HY) bond market is showing signs of rising risk appetite.
On the other hand, FactSet reported that while Q2 Earnings Seasons earnings and sales beat rates were well above their historical averages, forward 12-month EPS fell. This surprising development will have to be monitored to see if it represents just a blip in the data, or the start of something more serious.
Indeed, the latest BAML Fund Manager Survey shows that global growth expectations are starting to roll over. The downward EPS revisions may be reflective of that change in trend.
As well, Jeroen Blokland pointed out that falling estimate revisions is a global trend. Estimate revisions in June were considerably lower than they were during the January to May period.
The chart below confirms the trend of falling revisions observed by Blokland. It shows the history of weekly forward 12-month US EPS revisions from FactSet since early May. As the chart shows, the pace of forward revisions has been decelerating, even if the last data point, which showed a negative revision, is excluded.
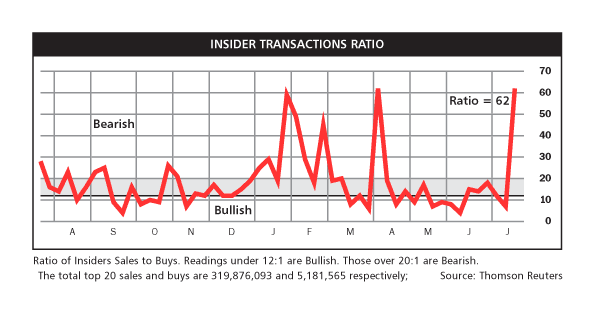
Another disturbing sign for the bull camp comes from the Barron’s report of insider transactions, which saw a spike in sales by this group of “smart investors”. This is a noisy data series and there was a similar spike about three months ago, which could have been caused by a “quiet period” during earnings season when insiders could not trade. Nevertheless, the appearance of twin data blips from both EPS estimate revisions and insider activity is worrisome.
Possible consolidation next week
Looking to the week ahead, my base case scenario calls for a period of consolidation. The SPX hourly chart shows that RSI-5 reached an overbought reading of 90 twice last week. Historically, such episodes have been resolved with brief periods of consolidation before a major directional move.
Jeff Hirsch of Almanac Trader observed that the historical pattern of the next few days in July tends to have a weak bias.
My inner investor continues to be constructive and bullish on stocks. My inner trader is giving the bull case the benefit of the doubt and remains long the market. He is inclined to lighten up his long positions as a way of managing risk as we approach the FOMC meeting next week.
Disclosure: Long SPXL










The richness of data with accompanying commentary in this well constructed presentation is impressive. Thanks
Margin loans fell slightly. If this is the beginning of a decline, this would be a negative.
Healthcare reform is virtually dead. That puts the Trump tax cuts in jeopardy and the whole Trump rally is fizzling.
Sentimentrader.com says forex volatility often proceeds stock volatility and the American dollar has been very weak. VIX is low. A surge in it could foretell market problems.
Commodities appear to be a 20 year cycle per graph from incrementum above. If one were to create a commodity basket portfolio, would a combination of xle, gld/gdx, xme cover the entire spectrum? What about softs? Is there a basket that represents soft commodities? Does xlb a good substitute for the above combination?
Some of your clients may have bought xle after your missive on a “Generational bottom in oil” and may want to balance a commodity portfolio by inclusion of non-oil commodities.
A contrarian… might feel inspired by Meb Faber’s strategy of buying down-in-the-dumps (hi-yield) sovereign debt.
DB Agriculture Fund ETF covers the softs.
http://etfdb.com/etf/DBA/
Thanks, Ken.