Preface: Explaining our market timing models
We maintain several market timing models, each with differing time horizons. The “Ultimate Market Timing Model” is a long-term market timing model based on the research outlined in our post, Building the ultimate market timing model. This model tends to generate only a handful of signals each decade.
The Trend Asset Allocation Model is an asset allocation model which applies trend following principles based on the inputs of global stock and commodity price. This model has a shorter time horizon and tends to turn over about 4-6 times a year. In essence, it seeks to answer the question, “Is the trend in the global economy expansion (bullish) or contraction (bearish)?”
My inner trader uses a trading model, which is a blend of price momentum (is the Trend Model becoming more bullish, or bearish?) and overbought/oversold extremes (don’t buy if the trend is overbought, and vice versa). Subscribers receive real-time alerts of model changes, and a hypothetical trading record of the those email alerts are updated weekly here. The hypothetical trading record of the trading model of the real-time alerts that began in March 2016 is shown below.
The latest signals of each model are as follows:
- Ultimate market timing model: Sell equities
- Trend Model signal: Neutral
- Trading model: Bearish
Update schedule: I generally update model readings on my site on weekends and tweet mid-week observations at @humblestudent. Subscribers receive real-time alerts of trading model changes, and a hypothetical trading record of the those email alerts is shown here.
Subscribers can access the latest signal in real-time here.
Still range-bound
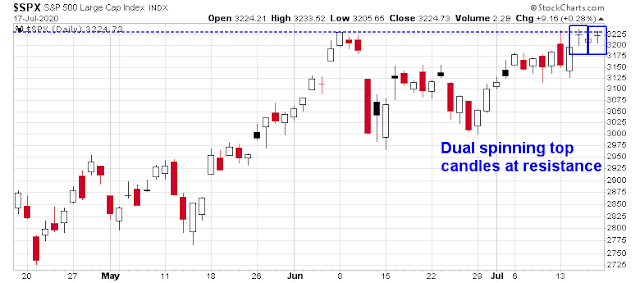
The market ended the week at the top of a tight range between 3000 and 3240. For the bulls, they can point to:
- The market shrugging off bad news about the rising US infection rate and death rate.
- Hopeful news on vaccine development, despite some of my doubts (see A Covid recovery?).
- Constructive signs from breadth indicators and cyclical stocks.
The bears can point to:
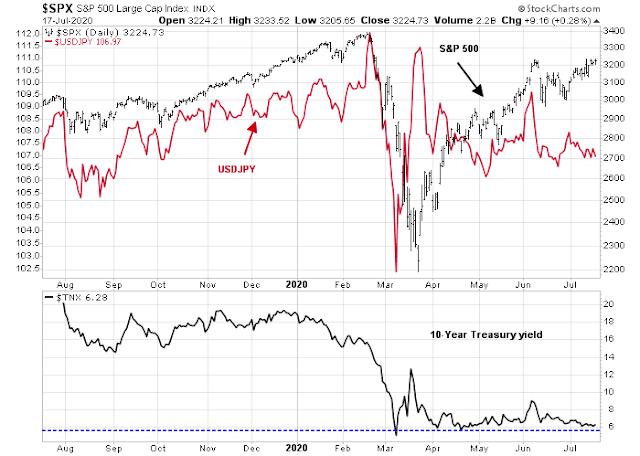
- Nagging cautionary flags from inter-market, or cross-asset, analysis, such as the persistent downward pressure shown by the 10-year Treasury yield, which continues to test the 0.60% support level even as stocks test upside resistance.
- Faltering momentum from Chinese stocks (see Double bubble, double trouble?).
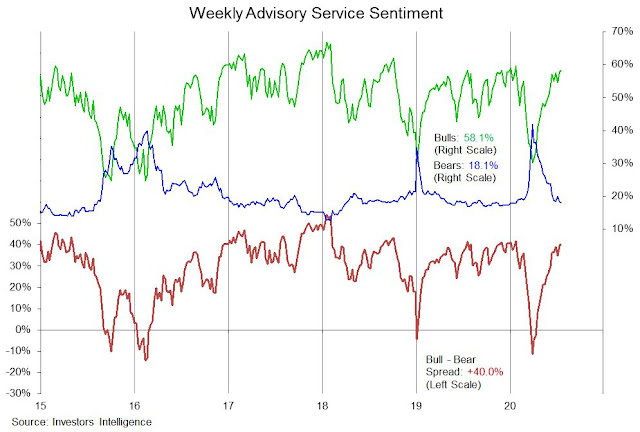
- Elevated bullishness on sentiment models, which is contrarian bearish.
There is no point in wringing my hands about the range-bound market. The market will gives us some clue on direction once it stages a breakout, either on the upside or downside. Instead, I outline some of the pockets of opportunity, and other corners of the market to avoid.
The bull case
Let’s briefly summarize the bull case. You can tell a lot about a market by the way it responds to news. The market seems to be ignoring the bad news about the deteriorating COVID-19 in the US. (Caution: The figures may be understated because of the new HHS guidelines for data.)
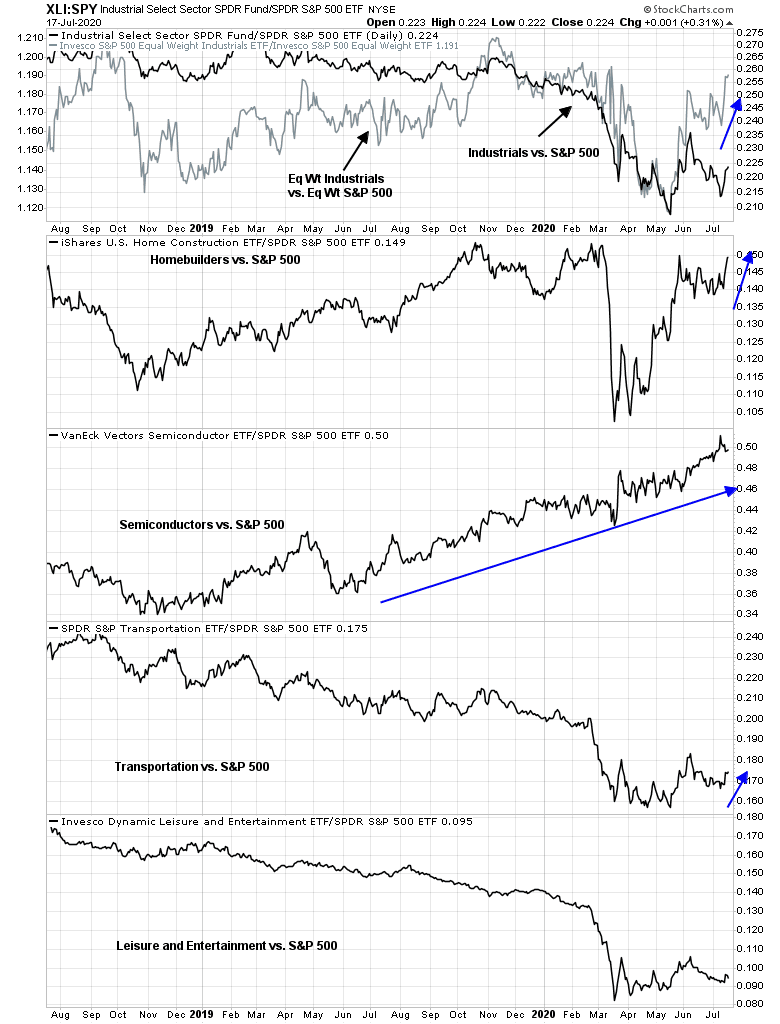
Market leadership rotated from the high flying technology names to cyclical stocks. Virtually all of the cyclical industries except for leisure and entertainment caught bids. Semiconductor stocks remain in a well-defined relative uptrend.
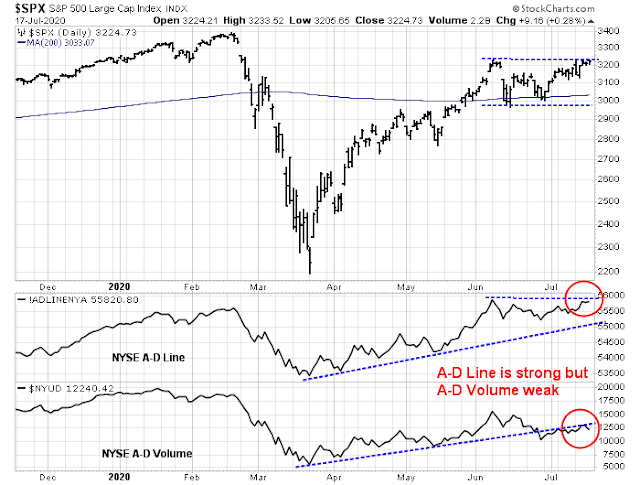
The S&P 500 Advance-Decline Line made a fresh all-time high.
The bear case
On the other hand, inter-market, or cross-asset, analysis is raising some doubts about the bull run. The Japanese Yen, which is a classic risk appetite indicator, is not buying the equity advance. In addition, the 10-year Treasury yield keeps trying to test support even as the stock market tests resistance. A significant downside breach of the 0.60% level would be a risk-off signal. Which is right, the stock market, or the currency and bond markets?
The Advance-Decline Line is also flashing a negative divergence. The strength of the NYSE A-D Line is offset by the weakness in A-D Volume. Even as stocks advanced broadly, there was more selling volume than buying volume. This is a sign of distribution that should be watched.
Lastly, bullish sentiment appears to be elevated. The II sentiment bull-bear spread has normalized to 40%, which is the roughly the level when the market peaked this year and in 2019. However, the spread was higher in early 2018 when it rose about the 50% mark.
,/p>
Energy: The contrarian play
In the short run, it is difficult to know where the market will go. However, there are pockets of opportunity for superior performance for long-only accounts. Bear in mind that these are investment themes, not trading themes. There are no immediate triggers that cry out for an immediate commitment to any of these ideas.
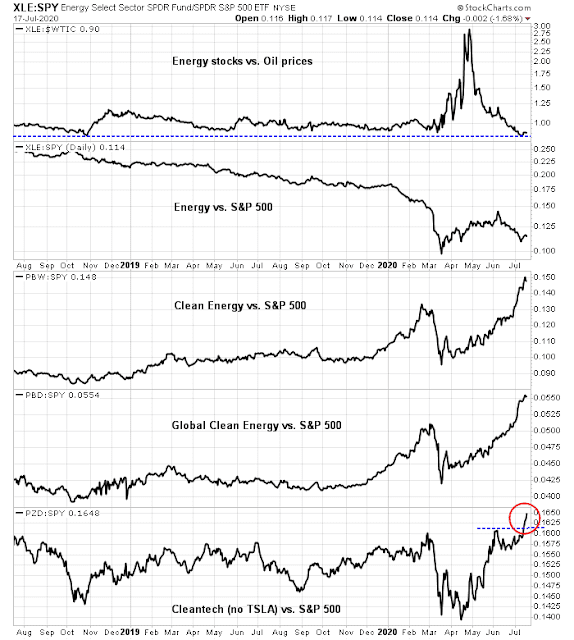
A washed-out and unloved sector to consider is energy. The BoA Global Fund Manager Survey shows that positioning in this sector is sufficiently underweight and for a long enough duration to warrant a tactical contrarian bullish position.
From a technical perspective, the relative performance of US and European energy stocks have tracked each other. These stocks are exhibiting a constructive higher low after an initial panic low in March. There is little to choose between the different industry groups within the sector, though oil services may appear slightly better technically.
For investors who believe the energy sector may represent a value trap, they may consider ESG clean energy as the momentum play. One word of warning, though. Most of the clean energy ETFs hold a large weighting in Tesla (TSLA), which has been on a tear. However, the Cleantech ETF (PZD), which has no TSLA, managed to stage an upside relative breakout without help from Elon Musk.
Is WFH theme peaking?
The second investment theme that I would highlight is the “work from home” (WFH) theme, which may be nearing a peak. A recent WSJ interview with staffing company Adecco’s CEO Alain Dehaze raised some doubt as to how far companies can take the WFH trend.
“Remote work is unfortunately creating a social distance that we should not have,” said Mr. Dehaze, though he sees no return to workplace normalcy until a vaccine is widely available.
Dehaze explained:
There are very positive aspects regarding remote work. You don’t have to commute, so you save time and money. For some, it is very convenient to work from home. But for many others, it’s a nightmare. There is the question of the quality of broadband infrastructure, computer screens and separation between private life and work.
Then there is the question, Who will pay for all the digital infrastructure work needed? Who will take the benefit of time and money saved not commuting—the employee or employer? And there is the third part, which, for me, is very important: What about the culture—the social proximity—you have in a company?
Much depends on the model of work. Are employees considered to be individual widgets, interchangeable, and expected to perform limited tasks? In cases like a call center, a WFH model is very viable given the state of current technology. But if employees are expected to be creative and collaborate, then corporate culture matters.
The question is physical distance versus social proximity. By being with colleagues, you align, you share a lot of things. You cultivate your values, you cultivate your purpose. If you are permanently alone, I don’t know how you can cultivate this.
It’s like friendship and love. You cannot cultivate friendship and love only from souvenirs, from memory. You need presence, you need to nurture. And with culture, it’s also about nurturing through experience. This social proximity will remain important.
I agree. One of the questions that I used to ask when interviewing with a company as a way of understanding the corporate culture was, “Do you socialize together after work?” Without the personal relationships, it’s far more difficult to collaborate, be creative, and add value.
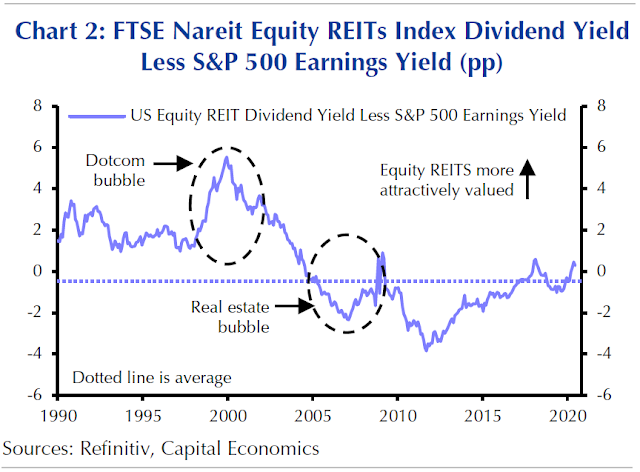
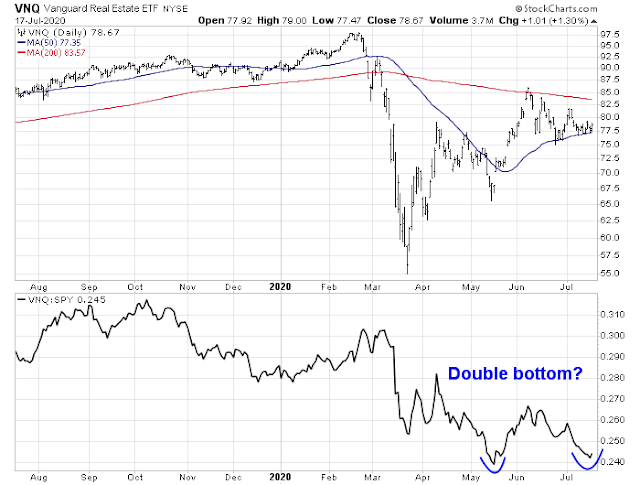
This brings into question the longevity of the WFH investment theme, and the bearishness towards REITs, and office REITs in particular. From a fundamental perspective, REITs are starting to look cheap again.
From a technical perspective, the relative performance of REITs appear to be attempting a double bottom.
Gold: Too far, too fast
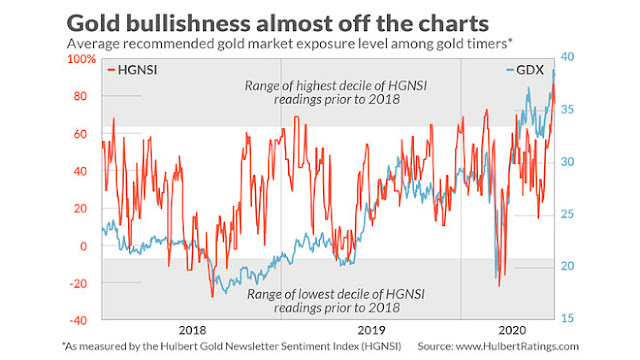
Lastly, gold prices have been on a tear as they staged a convincing upside breakout through the $1800 level. However, both the gold price and the inflation expectations ETF (RINF) are testing key resistance zones, and some breathers are probably in order.
Mark Hulbert pointed out that his Hulbert Gold Newsletter Sentiment Index is at an off-the-charts bullish reading, which is contrarian bearish. If history is any guide, gold prices and gold stocks are due for a correction and pullback.
While I am long-term bullish on gold. The Fed is embarking on a program of financial repression, which will depress real rates and should bullish for bullion (see Can a bull market begin without the banks?). BoA pointed out that global government bond yields are nearing Japanese yields, and the process of Japanese style financial repression is upon us.
However, gold prices have risen too far too fast. This is not the time to be all-in bullish on the metal.
The week ahead
From a tactical perspective, the market begins the week overbought, with short-term breadth indicators rolling over.
As well, the S&P 500 exhibited two spinning top candlesticks while testing resistance, which are signals of indecision. These are signals that the near-term outlook is down, but the bears have not been able to make much of such opportunities in recent weeks.
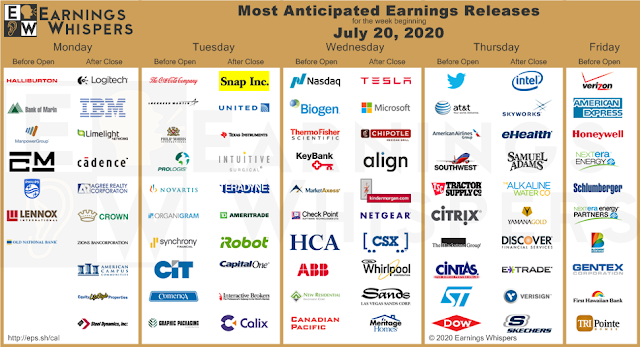
Traders also need to be aware that Q2 earnings season is in full swing. Important large cap companies are reporting, and it could mean volatility in the market.
My inner trader remains short, but only during daytime hours (see My inner trader returns to the drawing board).
Disclosure: Long SPXU







Cam
Thanks for a well written piece highlighting what is working and what is not, and what is overbought (gold) and what is washed out (energy).
That said, the stark underperformance of the banking index shown in your previous article is a “tell” that the market is peaking out. The prior two instances (circa Y2K and 2007) suggests such underperformance leads a market decline. The NASDAQ to Banking pair is an interesting combination. This is starting to “feel” like a year 2000 style market top.
Ken’s reference of Jim Stack’s Gorilla Index is also a warning. Though he says that the Gorilla Index is something to watch, he has also indicated that this could happen sooner than later (AMZN for instance has already pulled back from 3400 to 2990 give or take).
Covid pandemic steam rolls as expected. With a vulnerable global population, this vector is not backing off and will not back off! The development time frame of vaccines may also be highly uncertain, as is true historically.
Without the support of the Fed, and now fiscal policy, all of this may be toast.
The Fed has taken the necessary steps, and the question is what next. Unless the US Fed starts buying equities with both hands, I have my doubts about this rally in the market from 23rd March. I have floated this idea in the past and it appears that in knowledgable circles, this is being talked about.
https://www.schwab.com/resource-center/insights/content/market-perspective
From Liz Ann Saunders, verbatim:
“Purchasing equity stakes in companies of all sizes—as an alternative to more loans to smaller businesses that may weigh on their ability to grow, or bailouts to a few large companies—is not a far-fetched idea. The Bank of Japan has been buying equity exchange-traded funds (ETFs) since 2010, and stepped up its purchases this year—they’re now equivalent to more than 5% of Japan’s stock market capitalization. China’s government appears to have stepped in to buy stocks during periods of crisis (including this year), and the European emergency business loans made in the first round of the crisis have the option to be converted to equity. The equity investment idea seems to be gaining some traction with the Bank of England, the European Commission and finance leaders in Germany and France, as they discuss the merits of various proposals”.
So, one were to speculate, what would spur the US Fed to buy equities? A steep 30-40% decline in the stock market retesting the March low of 2200 may be a trigger.
Let us watch equity purchases by Congress members. Is there a place where this can be tracked?
I have, never seen historically, a more manipulated market than what we have seen in the last two decades. Global central banks have become experts in opening the financial levers at every pull back in asset markets.
Energy and gold probably remain hard assets that probably need to be accumulated (gold may be after a pull back). I would not put past central banks buying more gold to “repress” ownership but that would only cause a short squeeze in the gold markets, causing price to rise. If I had to think like the Fed, stocks would be the next asset class the Fed would buy and if that does not work, then gold (this sequence may take years to play out).
Bottom line, one should be buying, what one can sell to the US Fed, and that would be stocks. This is a highly speculative idea, no doubt about it. As an aside, I did have a house to sell circa year 2008, but Mr. Bernanke did not take a bite!!
Intermediate term bonds (10-20 years) and muni bonds may also be a good place to be (using ETFs), if the Fed is going to throw a life line to Stocks, and US municipalities. Vanguard has a High Yield tax free Muni fund that comes to mind.
Though Cam has shown trepidation in the Housing market, with renters nervous about making payments and fear about mortgage delinquencies, anecdotally, actual real estate prices are not backing off and remain at an all time high.
Cam, your insights about what I have written here are sought. This remains a very difficult market to navigate at best. No wonder Mr. Buffett is holding a lot of cash.
BoJ owns roughly 80% of all Japanese ETFs. Economy hasn’t taken off.
Housing market is interesting. Despite the financial distress, prices are holding up well, and so is the homebuilding industry.
Green energy ex Tesla seems a timely thing. The new Euro Coronavirus Bond has green investment restrictions and a Democrat win in November includes a huge green platform. This group is breaking out as seen in Cam’s chart above (called clean energy). Government infrastructure spending is going green everywhere and ESG investing is a growing force. Several ETFs are ex Tesla including ICLN. Many green energy ETFs own TSLA on a market weight basis which makes them too dependent on it when it has come so high. The green concept is one thing, Tesla another.
Let me know when green energy can compete with fossil fuels, Ken. Until it doesn’t cost more in fossil fuels to build it than the savings from the green energy, then it just cannot compete on its own. Until then it will remain a minor player and fossil fuels will stay dominant.
There have been three unacknowledged bear markets since 2008-09 – the two near -20% plunges in 2011 + the emerging markets/commodities bear in 2015-16, and the December 2018 plunge.
So the oft-cited length of the 2009->2020 bull is highly misleading. Do I really believe a new bull started in the spring of 2020? Absolutely. Of course, I’m also open to being wrong.
They are overstating the covid pandemic. Even yesterday there was an article about a motorcycle crash death being included in the covid death stats. It seems there actually is a financial benefit for reporting a death as a covid death. I believe it is way over stated and not an honest number of covid deaths nor covid patients.
That being said, there is a slight weakening in the economic numbers but is that just a blip on the way to a more robust recovery after the election? I think so. The politics being played in this last three months before the election is like nothing we have ever experienced before from democrats. Keep that in mind
Wally,
Sometimes you make me laugh. I am not laughing in a patronizing way, just that your perspective makes me laugh and realize that we are all humans.
What I am talking about is, the tendency for humans to constantly think that there are “US and Them”. And that we are the victim of other people’s stupid thinking, though we “know” that we know better and are smarter because of our experiences. ..These fools, they will see my way eventually. Almost not wishing but then again a small part of us actually hoping, that we get to see the Schadenfreude on “Them.”
What I am talking about is, your words, “…The politics being played in this last three months before the election is like nothing we have ever experienced before from democrats. Keep that in mind….”
With Republicans in charge of, The Supreme Court, 1600 Penn, and the Senate, If they feel that they are the Victims in what is going on the in country? Well, that’s what is funny. This all points to all the upheaval we are having in this country. Everyone feels they are the VICTIM. Even people with money and in charge of the country, Feel that they are the Victims. That my friend is Funny!!
Again, not patronizing you at all, just giving you another perspective about your comment.
I am not necessarily a Democrat, just to clarify, that this is not about the Politics.
Love reading your perspective.
Here’s the thing. There are an infinite number of layers to the human experience. One could spend a lifetime peeling away and probably dig no deeper than the surface.
Wally’s observations may not match another person’s perspective – but who can say with any certainty whether he’s right or wrong?
Reality is often in the eye of the beholder. And I’m pretty sure that none of us beholds an entirely truthful version of reality.
Once again, thanks for your support, RX.
Thanks, Mohit. There usually is an “us and them” and I like to think just a little (maybe a lot?) out of the box. I’ll try to keep you on your toes. LOL
Well, hospitals are starting to ship patients to LA because no beds left in Bakersfield, or so I hear. Brought extra ventilators from elsewhere in CA because supply is short.
Yes, there is a moral hazard to paying a bonus for covid cases.
We are getting crazy numbers of new cases…I guess it is post July 4 showing up. Lots of deaths, some in 20s.
It will pass, but the market reaction runs counter intuitively. This will end in tears, but when? Maybe after the S&P hits 4500…nobody knows what or when the peak will be. Maybe being in a bubble is like how in a black hole laws of physics go out the window, in a bubble, normal rational parameters like PE go out the window and there is no way of knowing when the irrational behavior will end. I’m a big chicken, mostly in cash, missing out but I sleep at night
A break-out or a break-down? Volume is anemic.
Why would it break down right here?
Testing the highs from early June on the S&P but not other indexes. Volume is very light for a break-out. This is where it should make or break the rally.
It’s been my observation that volume won’t necessarily be high on an upside breakout (as opposed to a downside breakout). In addition, the fact that no one believes in this rally would further depress expected volume.
2240 has been breached? What should we do now?
Watch the close. Cover if convincingly above 2240.
3240 (not 2240).
Will the close at 3,251.84 be considered convincingly above 3,240?
I hate to say it, but it sure didn’t feel like we closed ‘convincingly’ above 3240.
RX2, Would love to hear your thoughts further.
Taking profits on ASHR/ FXI. Rolling proceeds into XLE/ XLF.
Are you just alternating between XLK (leading performer on strong days) and XLE/XLF (lagging sectors)?
Should we buy some small US regional banks? some pays 10% dividend!
But will they survive interest rate manipulation by Fed?
The only thing that’s lifting SPY are Tech.
Banks, REIT, Energy are all down. Not sure what’s to make of this.