Preface: Explaining our market timing models
We maintain several market timing models, each with differing time horizons. The “Ultimate Market Timing Model” is a long-term market timing model based on the research outlined in our post, Building the ultimate market timing model. This model tends to generate only a handful of signals each decade.
The Trend Model is an asset allocation model which applies trend following principles based on the inputs of global stock and commodity price. This model has a shorter time horizon and tends to turn over about 4-6 times a year. In essence, it seeks to answer the question, “Is the trend in the global economy expansion (bullish) or contraction (bearish)?”
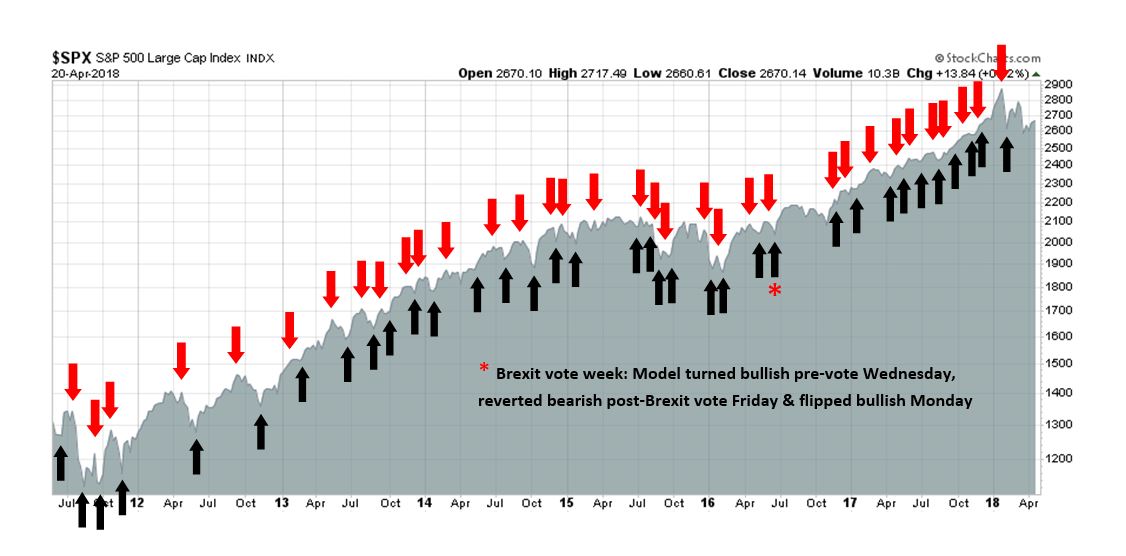
My inner trader uses the trading component of the Trend Model to look for changes in the direction of the main Trend Model signal. A bullish Trend Model signal that gets less bullish is a trading “sell” signal. Conversely, a bearish Trend Model signal that gets less bearish is a trading “buy” signal. The history of actual out-of-sample (not backtested) signals of the trading model are shown by the arrows in the chart below. The turnover rate of the trading model is high, and it has varied between 150% to 200% per month.
Subscribers receive real-time alerts of model changes, and a hypothetical trading record of the those email alerts are updated weekly here.
The latest signals of each model are as follows:
- Ultimate market timing model: Buy equities
- Trend Model signal: Bullish
- Trading model: Bullish
Update schedule: I generally update model readings on my site on weekends and tweet mid-week observations at @humblestudent. Subscribers receive real-time alerts of trading model changes, and a hypothetical trading record of the those email alerts is shown here.
Falling trade tensions = Equity bullish
I have written in these pages before that, in the absence of trade war tensions, the path of least resistance for stock prices is up (see Watch the Fed, not the trade war noise).
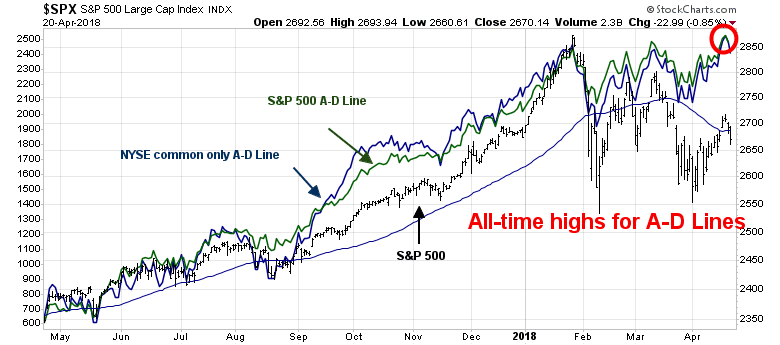
From a technical perspective, stock market is well supported by positive divergence from breadth indicators. Both the SPX Advance-Decline Line and the NYSE common stock only A-D Line made all-time highs last week.
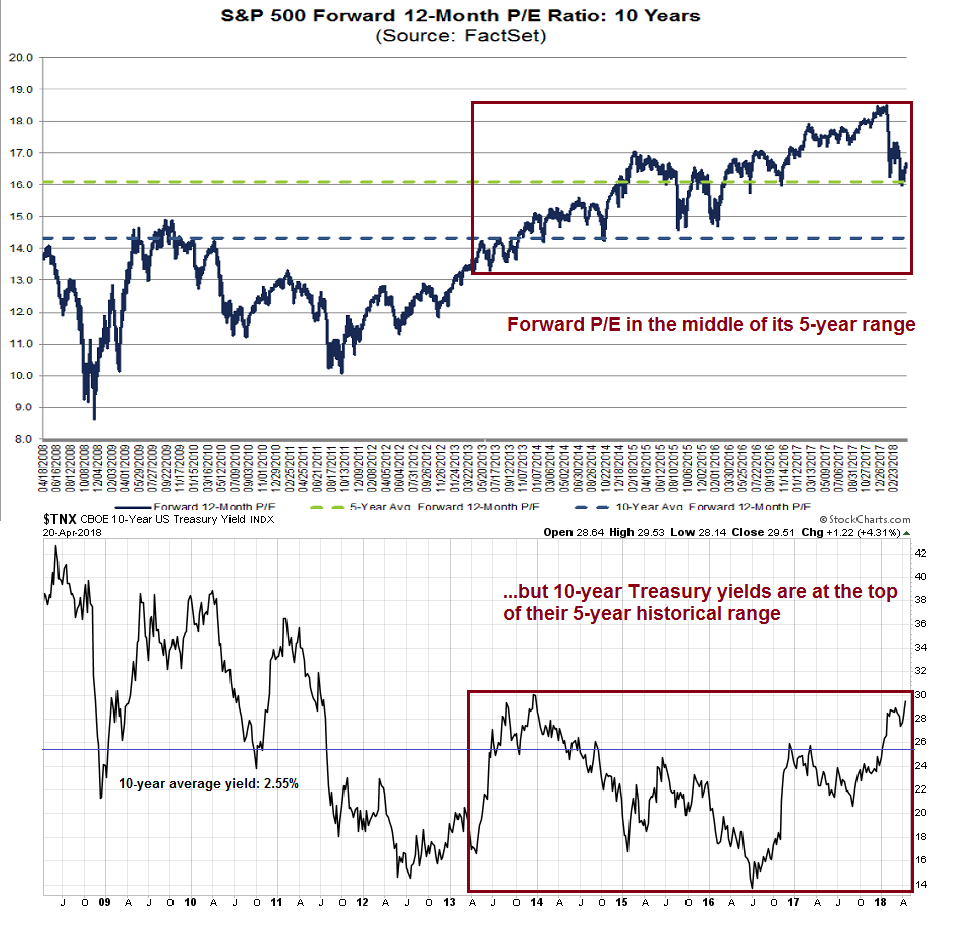
From a fundamental viewpoint, equity valuations are not especially demanding when compared to bonds. The market started to get concerned last week when the 10-year yield approached 3%, but some perspective is in order. As the following chart shows, FactSet reported that forward P/E ratio is in the middle of its 5-year range. By contrast, the 10-year yield is near the top of its 5-year range, indicating slightly equities are cheap relative to Treasuries. On a 10-year perspective, however, the forward P/E is above its historical range and so is the 10-year yield. Depending on your time horizon, valuations are either slightly cheap or slightly expensive, but levels are nothing to panic over.
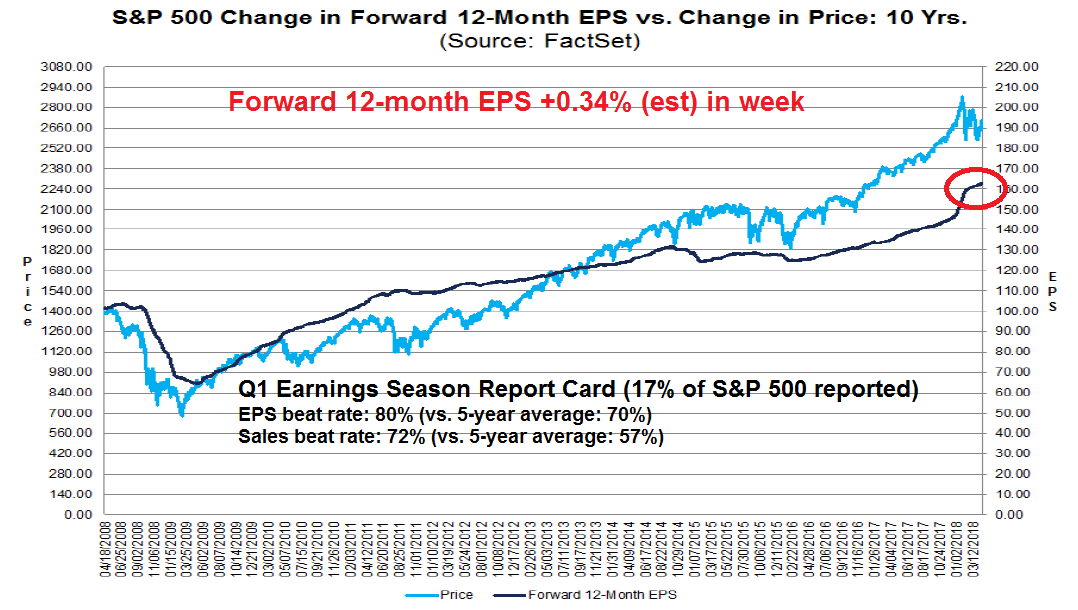
In addition, earnings are continuing to rise. Results from Q1 earnings season have been solid, with above average EPS and sales beat rates. In addition, forward 12-month EPS are rising, indicating positive fundamental momentum.
The bullishness is not just attributable earnings results. Brian Gilmartin at Fundamentalis pointed out that revenue growth and beat statistics are highly encouraging.

What could possibly go wrong?
How a trade war hurts America
How about a trade war that craters corporate earnings? For some perspective on how a full-blown trade war would hurt the American economy, we can examine the business reaction from the latest Beige Book. The latest April report contained 36 references to the words “tariff” or “tariffs”, compared to none in the previous two editions. Most of the concerns comes from rising input costs, and that`s just from the newly enacted aluminum and steel tariffs, which are minuscule compared to the next round of proposed Section 301 tariffs on $50 billion of Chinese imports.
Boston Fed [emphasis added]
Two contacts brought up the proposed China tariffs and said they represent a major risk. One was a toy manufacturer who sources 75 percent of their production from China. The second said that punitive tariffs on Chinese aluminum had already had a big effect: “Thin gauge foil” is produced only in China and tariffs raised the price three-fold; the contact argued that “these tariffs are now killing high-paying American manufacturing jobs and businesses.”
Don’t hold back, tell us how you really feel.
Philadelphia Fed
Of the 22 manufacturing firms that offered general comments, seven mentioned impacts from recent tariffs or proposed tariffs–most noted rising prices or anticipated rising prices; just one firm anticipated greater demand.
Cleveland Fed
According to contacts, recently imposed tariffs have accelerated price appreciation of steel products, in some cases at double-digit rates.
Rising freight volumes across product segments were attributed primarily to solid economic growth. There is concern about the sustainability of increasing volume because of newly enacted tariffs and potential outcomes from NAFTA negotiations.
Richmond Fed
Steel and aluminum prices rose sharply and were expected to rise further as a result of recently-imposed tariffs.
Atlanta Fed
Overall, businesses continued to report relatively benign input-cost pressures. However, some contacts noted rising prices for transportation, as well as steel as tariff rhetoric increased.
Chicago Fed
Manufacturers facing higher steel and aluminum costs because of the new tariffs expected to pass on about half of the increased costs to their customers on average.
Minneapolis Fed
Multiple contacts reported dramatic increases in the prices for steel products, partly attributable to recently announced tariffs; a manufacturer of tractor trailers said they “can’t raise prices as fast as material costs.”
Dallas Fed
Price pressures remained elevated over the past six weeks. Input cost pressures increased among energy, manufacturing, and construction firms, partly due to the announced tariffs on steel and aluminum. Upstream energy firms said the steel tariffs represent a worry, although some contacts said there shouldn’t be much of an impact on costs until 2019 when contracts roll over. Downstream energy contacts were still figuring out how much of their steel is subject to the new tariff and how that will affect their costs and investment decisions. Several manufacturers said that talk of steel tariffs immediately resulted in higher steel prices. An architecture firm noted that the increase in steel costs will impact the ability of their clients to move forward with some construction projects. Average gasoline and diesel prices were fairly stable, although transportation services contacts noted that fuel costs were up notably from a year ago.
Expectations regarding future business conditions remained optimistic, although several contacts noted that the newly enacted tariffs were creating a lot of uncertainty in their outlooks for activity and prices. Refiners and petrochemical producers specifically mentioned their views about the potential negative impact of these tariffs on construction projects.
San Francisco Fed
Contacts reported a jump in inflationary pressures for metals prices, partly due to the anticipation of tariffs and unrelated increases in raw material costs.
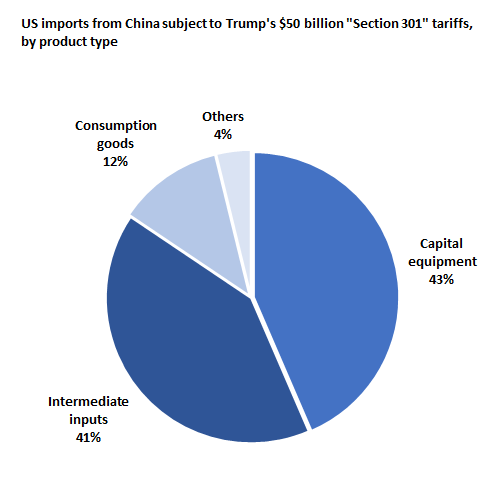
Most of the concerns over tariffs raised by businesses in the Beige Book pertain to higher input costs, which hurts American competitiveness. Chad Bown at the Peterson Institute broke down the list of items in proposed Section 301 tariffs and found that they are mostly capital equipment or intermediate goods that can’t be easily replace by US manufacturing because supply chains have become global:
One out of every five tariffs that he selected involved a product with the word “parts” in its description. Most were so technical that even trade experts had no idea what they were, except to know that businesses and workers rely on those “parts” from China to remain competitive in the global marketplace.
Most of those types of products go into something bigger and better being made by Americans. And especially for those on the list, the imports from China are nowhere near zero. I classified all 1,333 products and found that intermediate inputs and capital equipment comprise almost 85 percent of the $50 billion of imports subject to Trump’s tariffs.
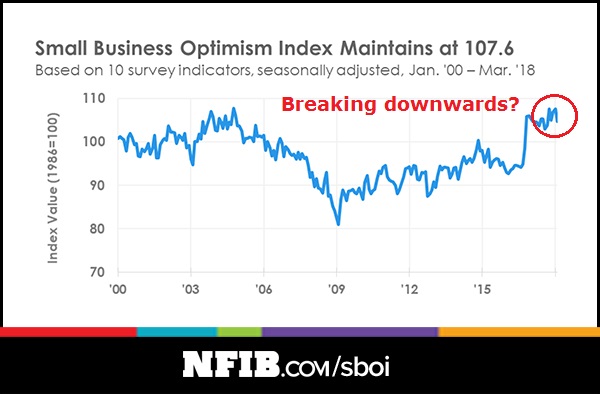
Is it any wonder why NFIB small business confidence edged down in March, albeit from a highly elevated level?
The businesses reaction so far has only been in response to the aluminum and steel tariffs. Those effects are relatively small and amount to a trade skirmish. What happens if the Sino-American trade relationship descend into a full-blown trade war? Researchers at the New York Fed recently published a study which asked, “Will new steel tariffs protect US jobs?” Here is the somewhat awkward conclusion for the Trump White House:
Although it is difficult to say exactly how many jobs will be affected, given the history of protecting industries with import tariffs, we can conclude that the 25 percent steel tariff is likely to cost more jobs than it saves.
The fastest way to reduce the trade deficit is to plunge the economy into a recession. Donald Trump appears to be unknowingly walking down that path.
How a trade war hurts China
Across the Pacific, the effects of a trade war will be very ugly for China. Even worse, a China slowdown is likely crater the global economy.
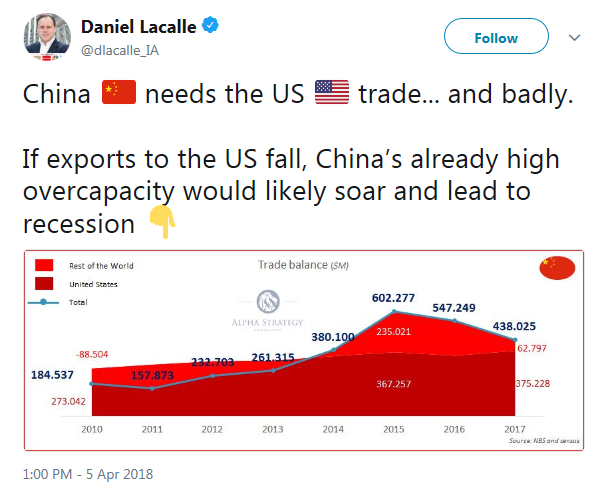
Exports account for roughly 20% of Chinese GDP. Daniel Lacalle pointed out that falling exports to the US would probably plunge China into a hard landing.
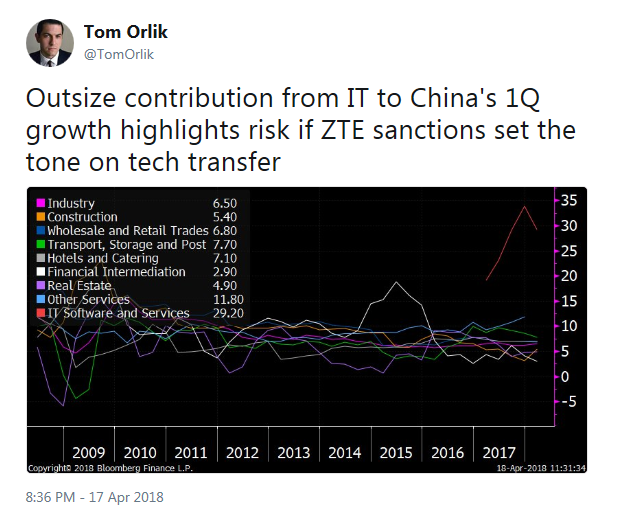
The hit to Chinese growth won’t just come from rising tariffs. Non-tariff barriers will also play a role to tank trade flows. The global nature of supply chains also makes US companies vulnerable to trade tensions. As an example, Beijing could disrupt American manufacturing by shutting down key Chinese suppliers of US companies like Apple using the pretense of failed health inspections. Tom Orlik at Bloomberg highlighted China’s vulnerability using the latest American ban on exports to Chinese phone maker ZTE as an example.
A Chinese slowdown would plunge most of Asia into recession. The sudden halt in global growth is unlikely to be firewalled in Asia. A Business Insider article pointed out that Germany would be especially vulnerable to a Chinese growth deceleration. If Germany, which has been the growth locomotive of the eurozone, were to slow, what happens to Europe?
“The German model depends on trade being as free as possible,” Dennis Snower, head of the Kiel Institute for the World Economy, an influential think tank in Germany told the Financial Times.
“If you hurt trade flows, then Germany will be hurt.”
Many German firms, particularly automakers and producers of other forms of heavy machinery have supply chains and manufacturing processes that heavily involve both China and the USA.
As an example, both BMW and Mercedes have major operations in the USA, with BMW’s plant in Spartanburg, South Carolina producing almost 2,000 cars per day. Mercedes has a major operation near Tuscaloosa, Alabama, employing upwards of 4,000 people.
In the event that China levies an import tariff on cars manufactured in the USA, it would have a major negative impact on the overall business of Daimler, the parent company of BMW and Mercedes.
According to the Financial Times, Daimler is “the largest vehicle exporter from the US by value and China is their number one market.”
In short, a Sino-American trade war will have far reaching global consequences.
Trade war fears are fading
Fortunately, the belligerent trade rhetoric is starting to fade. Xi Jinping’s speech at the Boao conference on April 10 appeared to have broken the rhetorical logjam. Even though the promises that Xi made were not very new, his conciliatory tone calmed the markets. Undoubtedly there are lots of back channel discussions about how to defuse the possible trade war.
Even though there is no “trade tension” ETF, I built a trade tension factor to measure the market’s perception of trade war risk. The blue line in the chart below shows the relative return of pure US revenue companies in the Russell 1000 (AMCA) compared to the Russell 1000. I would interpret a rising line (domestic companies outperforming) as rising trade tensions, net of currency effects. The green line is the USD Index. When the USD is rising (green line falling), multi-nationals enjoy an earnings tailwind. Even though AMCA has only had a fairly brief trading history, we can see that the blue line representing the trade tension factor has roughly tracked the green line, which represents the inverse of the USD, in 2017. Even though the USD (green line) has been range bound for much of 2018, the trade tension factor has been highly volatile, and illustrates the ups and downs of trade anxiety in the past few months.
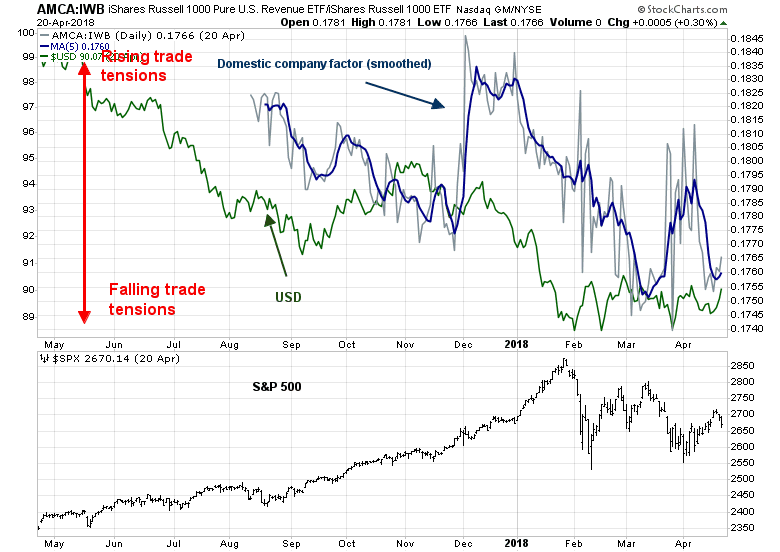
Readers who want to follow along at home can use this link for real-time updates.
Even though trade tensions have been falling recently, the market is not out of the woods. Trump’s recent broadside aimed at Rusal spiked metal prices and sent commodity markets into turmoil. Despite the market’s apparent on nonchalance on trade tension risk, the Rusal episode shows Trump’s America First policy remains in effect. Who knows what will come next?
While I am cautiously bullish on equities because of a solid technical backdrop and improving growth fundamentals, investors should keep a close eye on my trade tension factor as a way of monitoring trade tension risk.
The week ahead
Looking to the week ahead, I wrote last Tuesday that, even though I remained bullish, the market was due for a brief pause (see Time for a pause in the bulls’ charge). Stock prices subsequently topped out on Wednesday and weakened for the next two days. The market is now testing its 50 dma and a key uptrend line that began in early April. If that trend line holds, the next upside resistance is the gap at about 2750 formed on March 19. Further resistance can be found at the 2790-2800 level.
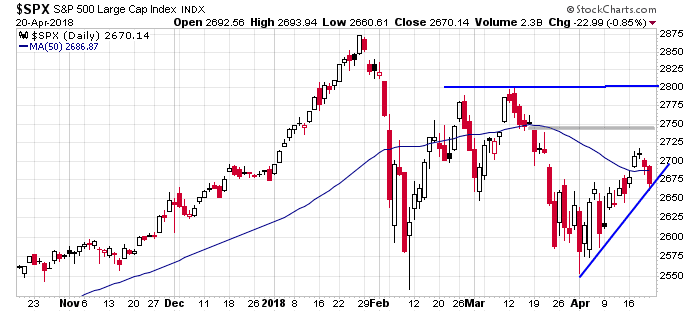
Short-term breadth indicators from Index Indicators are flashing near oversold readings that are enough for a bottom at Friday’s levels.

Another possible bullish development was the news out of North Korea. After Friday`s market close, North Korea announced that it is suspending all nuclear and ICBM tests ahead of the summit with South Korean President Moon next week. The market may interpret this event in a bullish way and it could spark a risk-on rally at the open on Monday.
My inner investor remains bullish on stocks. My inner trader went to cash last Tuesday, and he plans to re-enter the market on the long side on Monday, as long as we don`t get a rip-the-bears-face-off bullish stampede. Earnings season will be in full swing next week. Even if my inner trader doesn’t catch the initial rally on Monday, there will likely other opportunities as stocks will be volatile and reacting to the headline of the day.
Thanks again Cam.
On trade I see that Mexico and the EU have upgraded their trade agreement this weekend. As well as the economic benefits that will accrue, it suits both sides to show that protectionism isn’t the only direction to travel.
https://www.ft.com/content/2d78afac-460f-11e8-8ae9-4b5ddcca99b3
Little bit confused. You are bullish / long on all time levels. As per your inner trader; all cash last Tuesday?
(17-Apr-18 All cash, sell long, P/L: 1.7%)
As a reminder, this is what I wrote in my email alert when I went to cash last Tuesday:
“I expect that the market will pause and consolidate its gains for the next 2-5 trading days before resuming its upward path. The trading model remains bullish and the “arrow” is still pointing upwards.”
This is what I wrote in my latest post:
“My inner investor remains bullish on stocks. My inner trader went to cash last Tuesday, and he plans to re-enter the market on the long side on Monday, as long as we don`t get a rip-the-bears-face-off bullish stampede.”
It was a very short-term tactical move to step to the sidelines. I expect to re-enter the market on the long side next week.
You are right I didn’t go back to the email. My bad.
Cam read this email to David Rosenberg I sent him and said it wasn’t too long to post. So here it is. The subject line read, ‘The reason market strategists are currently wrong and YOU are right about the current stock market cycle ending sooner that expected.’
Leading indicators as yet are not flashing red and this is giving comfort to market strategists. They are saying, “Yes, we are nearing the end of the economic cycle but there will be a final leg up. Our recession indicators are still in the green.” They don’t believe markets will have a large drawdown without a recession and leading recession indicators are green. But the trend of inflation and interest rates will likely produce a recession beyond the lead times of the leading indicators.
The current thinking around the timing of the stock market cycle ending is flawed. Here’s why;
Humans adapt and humans with A.I. adapt even faster. Smart humans managing billions, strive and find new advantages in investment markets. This, I believe, will result in previously leading indicators, becoming coincident with investment markets or even lagging.
Sports bettors constantly make the error of not realizing that coaches change their tactics to negate another team’s advantages. So a game that on paper seems one sided given historical statistics, is surprisingly, flipped on its ear. So new tactics hidden in the locker room change outcomes. Today, new tactics in hidden in money management offices are changing things.
The investment game is constantly changing. I’ve been a keen observer for fifty years. The new factor that is effecting market timing is a new found appreciation of cyclicality in investment markets since the turn of the century. That was dramatically underlined with the crashing markets of the GFC. Let me explain how my personal experience gives me a unique perspective.
The period from 1982 through to 2000 saw a buy-and-hold paradise with short bear markets. This century has experienced large cyclical swings. My friend and former colleague, Horst Mueller, a great technical analyst at Wood Gundy, told me that technical analysis goes through cycles of popularity. He said in the 1950’s and 60’s markets was a secular bull market with minor bear markets and technical analysis fell out of favour. Then the 1970’s saw huge, sideways swinging market cycles where avoiding downswings became important. The period became a golden age of technical analysis where superstars like Joe Granville that could move markets. All of this to say that long secular cycles will influence a change in market players habits. I see a change occurring now in portfolio manager’s strategy to a more tactical approach to drawdown avoidance. Buy-and-hold with static asset allocation is no longer the only way to go.
I’ve been diligently studying leading stock market indicators since going through a devastating crash early in my career in the early 1980’s energy bust. That crash gave me the paranoia to research how to avoid another. It’s my belief, the devastating GFC Crash has galvanized other market players in the same way. My research led me to use proven leading economic and technical analysis tools that enabled my clients to miss all the major downswings in the last thirty years, 1987, 2000, 2008. The last two episodes were reported in the national newspaper. This worked because the vast majority of market players, especially institutions were in the buy-and-hold mentality that had produced such great returns during the 1982 to 2000 secular bull market. It was easy for me to miss the downswings because very few portfolio managers were even trying to avoid drawdowns leading up to the 2008 crash. Value investors could point to the 2000-2002 Dot.com Crash and show value stocks did fine during the downswing when the tech stocks collapsed the market indexes. The 2008 crash has changed thinking just as mine was changed decades before in my near-career-ending crash. Tactical avoidance of drawdowns has become a new and important, growing part of money management. A.I. must be a big proponent and calculator of this.
I was there in the pre-GFC buy-and-hold, value-based portfolio era where money managers didn’t really care about indicators like the yield curve that predictably foreshadowed a drawdown. Today, it’s a huge focus for a post-GFC Crash world of newly wary and tactical money managers. I’ve seen numerous Strategists comments recently, saying how we are getting closer to a point where the curve goes negative and that has historically meant that stock markets will THEN go down. But they say, that’s down the road, and we’ll have another leg up. What they are missing is that new tools are available to refine and MOVE FORWARD the indicators. Plus, the timing benefit of an indicator is determined by the number of people using it plus the learning curve of market players. For example, futures markets in Fed Funds now allows one to project the marketplace’s odds of future interest rates into the next few years. This allows for projecting the yield curve into the future. One can see when the curve is projected to go negative and this in turn feeds into economic models and stock market models. It’s amazing when I hear strategists worry about the mayhem the economy will likely experience in the future but still predict a final leg up in the markets.
Large managers with billions under management new to tactical avoidance of drawdowns, will be shifting out of stocks, putting downward pressure on indexes, long before the yield curve and other leading indicators warned of previous bull market peaks when few major players were tactical. The size of your assets demands it.
All this to say, taking cautious tactical action is needed sooner that historical indicators would previously dictate. The peak of the stock market may have been reached already.
“Humblestudentsofthemarket readers, we are in this together. I hope my experience helps.”
Ken
How much stock market exposure do you have at present (based on client risk tolerance in three buckets, aggressive, balanced and conservative)? Thanks.
I have two model portfolios, Growth and Balanced. Growth equity weight is 50% (range of 50-100%) and Balanced 30% (range 30-70%).
The area one must be most innovative is in the non-equity area. What used to be call one’s Fixed Income portion. Here I’ve chosen bullion, long/short alternative and a merger arbitrage alternative for both models. Balanced has preferred shares, that have a big dividend tax incentive in Canada. Note no bonds.
Ken, Thanks a lot for sharing this. Your claims make intuitive sense!
Ken – I was wondering if you could help me reconcile those thoughts with the following…
Since 08 there has also been an enlightening that low-cost investments are good, that passive is preferred, that in markets taking the average is OK. While this may be a more retail-focused phenomenon, I also think of the institutional money moving away from hedge funds (think CALPERS).
Add to that the low interest rates we have, and the downstream effects of pricing risk assets….
Without saying your thesis is untrue, because I do agree in part with it, is it possible that these phenomenons could actually prolong this cycle and indeed create new highs??
I have two model portfolios, Growth and Balanced. Growth equity weight is 50% (range of 50-100%) and Balanced 30% (range 30-70%).
The area one must be most innovative is in the non-equity area. What used to be call one’s Fixed Income portion. Here I’ve chosen bullion, long/short alternative and a merger arbitrage alternative for both models. Balanced has preferred shares, that have a big dividend tax incentive in Canada. Note no bonds.
Interesting. How much percentage is bullion? What is a long/short alternative? Thanks.
Ken your idea about reducing equity exposure is also echoed in today’s WSJ that talks about how liquidity is drying up in both stock and bonds, making a case to get out, while there is liquidity available.
Ken
So far, you have been right. Let us look at the evidence:
Banks kicked off this earnings season last Friday and sold off after earnings (GS is the poster child).
2. Google last night was another bell weather, and guess what, after earrings, it did not move the needle.
3. Eli Lilly, this AM came out with good earrings, and guess what, it sold off (-3% pre market).
4. Take staples (MO, PM, Kimberly Clarke, GIS, Imperial tobacco, P&G and XLP). ALL down in an upmarket! Yes, XLP may be an island of hurt in of itself, but so far, your call has been prescient.
There are large bell weather companies coming out with earnings (six before market open). Let us see whether market moves higher or not based on these earnings. Early going has shown that the needle is not moving in the right direction, so far (big banks, big tech like Google and big Pharma like Eli Lilly and big staples like P&G). Next on line is Coca Cola and Verizon. Let us watch the evidence, than be married to an ideology.