Preface: Explaining our market timing models
We maintain several market timing models, each with differing time horizons. The “Ultimate Market Timing Model” is a long-term market timing model based on the research outlined in our post, Building the ultimate market timing model. This model tends to generate only a handful of signals each decade.
The Trend Model is an asset allocation model which applies trend following principles based on the inputs of global stock and commodity price. This model has a shorter time horizon and tends to turn over about 4-6 times a year. In essence, it seeks to answer the question, “Is the trend in the global economy expansion (bullish) or contraction (bearish)?”
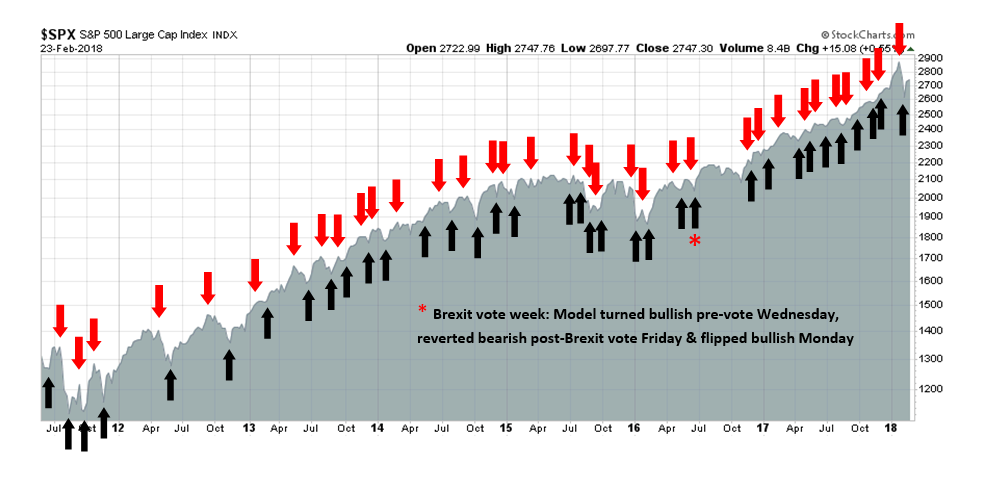
My inner trader uses the trading component of the Trend Model to look for changes in the direction of the main Trend Model signal. A bullish Trend Model signal that gets less bullish is a trading “sell” signal. Conversely, a bearish Trend Model signal that gets less bearish is a trading “buy” signal. The history of actual out-of-sample (not backtested) signals of the trading model are shown by the arrows in the chart below. The turnover rate of the trading model is high, and it has varied between 150% to 200% per month.
Subscribers receive real-time alerts of model changes, and a hypothetical trading record of the those email alerts are updated weekly here.
The latest signals of each model are as follows:
- Ultimate market timing model: Buy equities
- Trend Model signal: Neutral
- Trading model: Bullish
Update schedule: I generally update model readings on my site on weekends and tweet mid-week observations at @humblestudent. Subscribers receive real-time alerts of trading model changes, and a hypothetical trading record of the those email alerts is shown here.
Focusing on the wrong bond?
“No, Mr. Bond, I expect you to die!”
That was the classic line from the film Goldfinger, which is aptly named considering today’s conditions. The market is concerned about rising inflation expectations, which is bullish for inflation hedge vehicles like gold, and bearish for bond prices (click on this link for video if the clip is not visible).
Just as James Bond escaped the perils he faced in many films, bonds may be able to escape their perceived risks. That’s because the market may be focused on the wrong bond. The top panel of the following chart shows the yield 10-year Treasury note, which has violated a trend line that stretches back to 1990, and the yield of the 30-year Treasury, which has not.
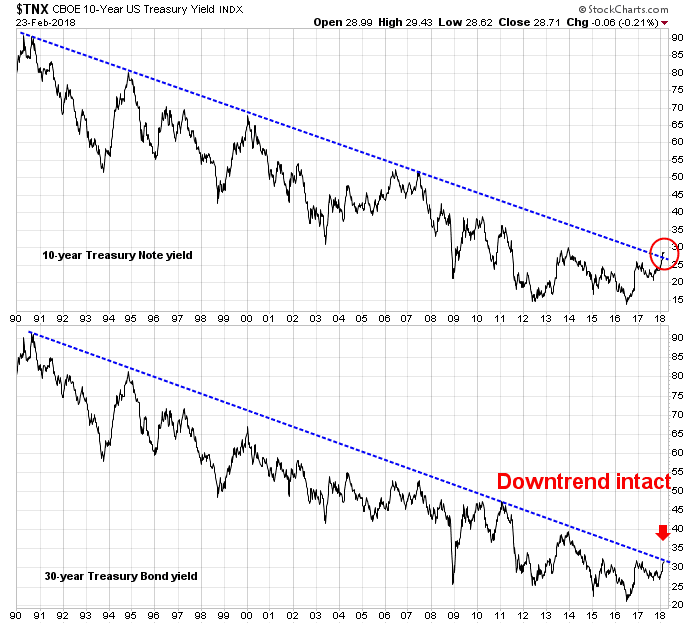
As market anxiety over inflation has picked up, the spotlight has turned to the 10-year yield. As experienced market analysts know, excess focus on a benchmark could lead to the invalidation of that benchmark.
Fiscal overheating anxiety
As inflation expectations have begun to heat up, the latest worry du jour is the prospect of fiscal overheating. Goldman Sachs put out a research note warning that the latest round of tax cuts represented “uncharted territory”:
Federal fiscal policy is entering uncharted territory…
The Treasury continues to borrow at low rates and it should be able to do so for a while even if market rates move higher in our view, thanks to a nearly 6-year average maturity of outstanding debt. … In the past, as the economy strengthens and the debt burden increases, Congress has responded by raising taxes and cutting spending. This time around, the opposite has occurred. …
The Goldman team warned that while GDP growth is likely to experience a fiscal boost of 0.7% in 2018 and 0.6% in 2019, the effects are temporary and the economy will have the pay the piper later.
The fiscal expansion should boost growth by around 0.7pp in 2018 and 0.6pp in 2019, but will likely come to an end after that … the growth effect comes from the change in the deficit … some of the recent deficit expansion relates to changes unlikely to be repeated, such as the temporarily large effect of certain tax provisions.
Edward Harrison of Credit Writedowns fretted about how such a pro-cyclical fiscal policy could affect monetary policy and the business cycle:
With Jerome Powell, a new Federal Reserve Chairman at the helm, there is a lot of uncertainty. If the Fed reacts with the same caution it has so far, long-term interest rates will remain low. And that could allow for continued growth in the economy and in corporate earnings, which ultimately helps stocks too. But since pro-cyclical policy amplifies the business cycle, it could cause overheating. if inflation rises or the Fed becomes more aggressive, the Trump Administration’s stimulus could boomerang. That would mean an initial bump in growth is followed by a steep fall. And the pain would spread beyond asset markets, to the real economy too.
Fed watcher Tim Duy had a more nuanced take that leaned slightly hawkish:
There are many, many moving pieces as the economy moves deeper into the economic cycle. It is a complex environment made only more so by the fiscal stimulus barreling down on the economy. My general takeaways: 1.) The data flow is generally supportive of the Fed’s forecast, 2.) the risk is that the Fed moves at a faster than anticipated rate of hikes 3.) that said, the Fed will not overreact to any one data point 4.) the Fed will adjust policy as necessary to maintain the inflation target over the medium run, 5.) the current policy operating environment of low and anchored inflation expectations leaves open the possibility that the Fed does not need to choke off fiscal stimulus even if it threatens to overheat the economy, 6.) fiscal stimulus does not increase the risk of recession in 2019 as much as in subsequent years if it is revealed that the Fed fell behind the inflation curve, 7.) fiscal stimulus though makes the Fed’s 2019 and 2020 rate forecast more likely.
A crowded bond short
In response to increasing anxiety, the market moved to a crowded short position in bonds. The January 2018 BAML Fund Manager Survey shows that institutional managers bond weights are at historically low levels.

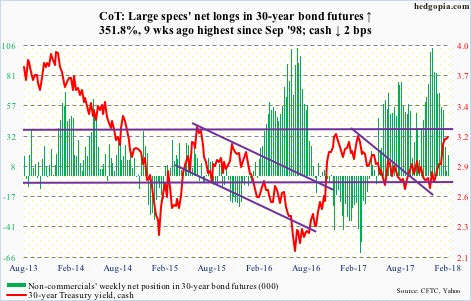
The latest update of the Commitment of Traders report from Hedgopia shows that large speculators, or hedge funds, are in a crowded short in the 10-year Treasury note.
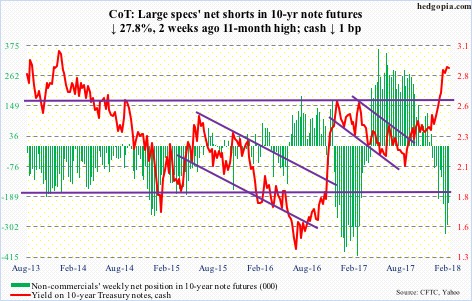
Up until recently, the record short in the 10-year had been offset by a neutral reading in the long Treasury bond, which was a hint that the market was positioned for a flattening of the 30-10 spread. But the latest readings show that large speculators are also near a crowded short position in the T-Bond contract too, and the flattening bets got unwound.
Hedgopia warned that negative sentiment was getting a little too stretched to the bearish side:
In less than six months, rates have also backed up quite a bit. The 10-year (2.87 percent) yielded 2.03 percent early September last year. In a leveraged economy, this in and of itself should help slow down economic activity. Plus, growth in M2 money supply is decelerating drastically.
It is hard to imagine the long end continuing on the current trajectory. At least a pause – if not an outright reversal – is probable. In fact, many fixed-income managers may find three percent – or thereabouts – on the 10-year an attractive level to go long bonds.
Near term, an equally important level to watch is 2.62 percent, which the 10-year broke out of in January. This also represents the neckline of a reverse-head-and-shoulders pattern. This is where a bull-bear duel likely gets fought.
Washed out Sentiment = Poised for a bond rally
Bloomberg also reported that JPM’s derivative quant Marko Kolanovic believes that these record short positions are setting up the market for a bond rally:
Short positioning in Treasury futures has climbed to a record, increasing the potential for an unraveling of trades betting on further declines in bond prices, Marko Kolanovic wrote in a note to clients. There’s also been an extreme swing in sentiment, with investors unduly focusing on higher inflation risks, said Kolanovic, who heads the team in New York.
“When there is such a large short position, there is always risk of profit taking, or worse, a proper short squeeze,” he wrote. “We also note extreme sentiment swings and the media playing into fears of inflation, while largely ignoring important points such as those most recently voiced by the Fed’s Harker and Bullard,” he said, referring to Federal Reserve district bank presidents Patrick Harker and James Bullard.
In the short run, the market may be setting up for a dovish surprise. Newly appointed Fed governor Randall Quarles recently gave a speech giving qualified support to the latest round of fiscal boost:
The tax and fiscal packages passed in recent months could help sustain the economy’s momentum in part by increasing demand, and also possibly by boosting the potential capacity of the economy by encouraging investment and supporting labor force participation…
Regardless, given the importance of productivity growth for the long-run potential of the economy and living standards, it is vitally important that policymakers pursue policies aimed at boosting the growth rate of productivity.
Despite his perceived hawkish leanings, Quarles was not willing to tilt monetary policy in a more aggressive manner. For now, he appeared to be content to stay with a “run a hot economy” policy in hopes of seeing productivity gains:
Against this economic backdrop, with a strong labor market and likely only temporary softness in inflation, I view it as appropriate that monetary policy should continue to be gradually normalized.
We are likely to get further clarify when Fed Chair Powell testifies before Congress next week.
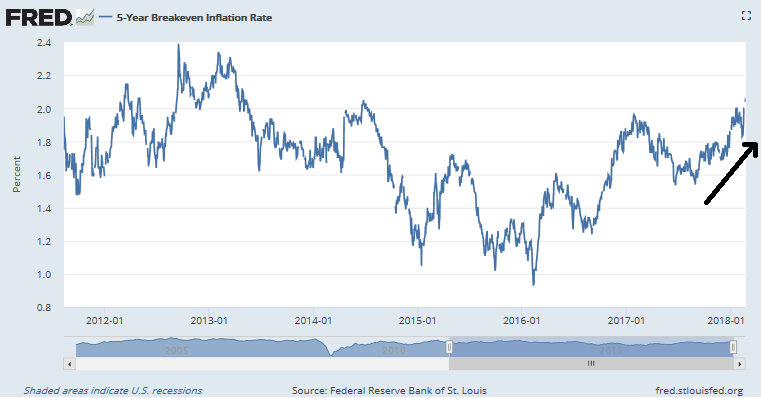
What rising inflation expectations?
From the market’s perspective, there are a number of anomalous readings on inflation expectations. Sure, the 5-year breakeven rates have been rising steadily, which is reflective of the bond market’s expectations of rising inflation.
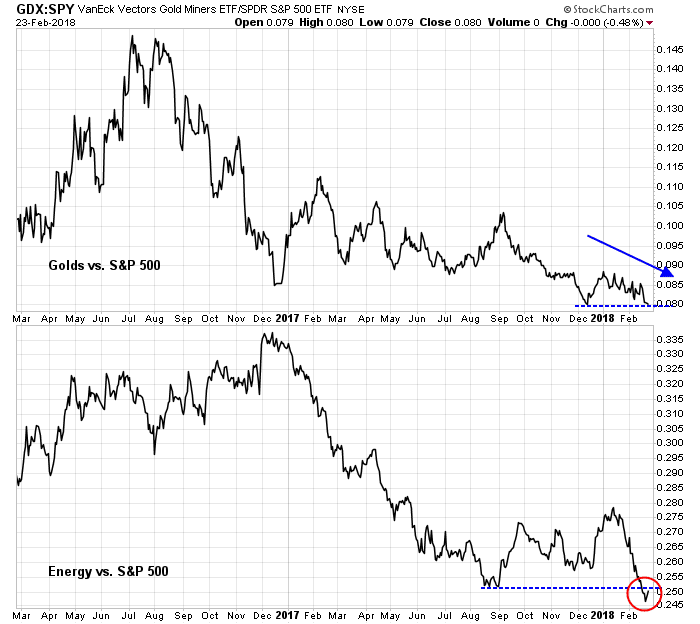
The message from the stock market is totally different. If inflation expectations are rising, then we would expect that the hard asset sectors, which perform well as inflation hedges, to be performing well. As the chart below shows, gold and energy stocks are not performing well relative to the market.
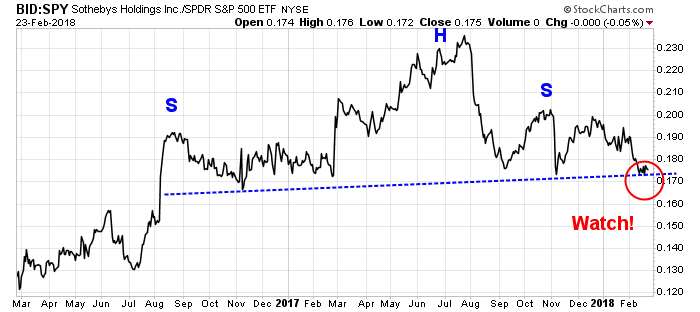
Another offbeat indicator of hard asset returns is the relative performance of Sothebys Holdings (BID), which benefits from rising demand and prices of collectibles in an inflationary era. Sadly, the relative performance chart of BID is setting up to form a head and shoulder formation. If the neckline were to break, it would be a bearish signal for the relative performance of this stock.
In short, the message from the stock market is, “What rising inflation expectations?”
Technical conditions supportive of bonds
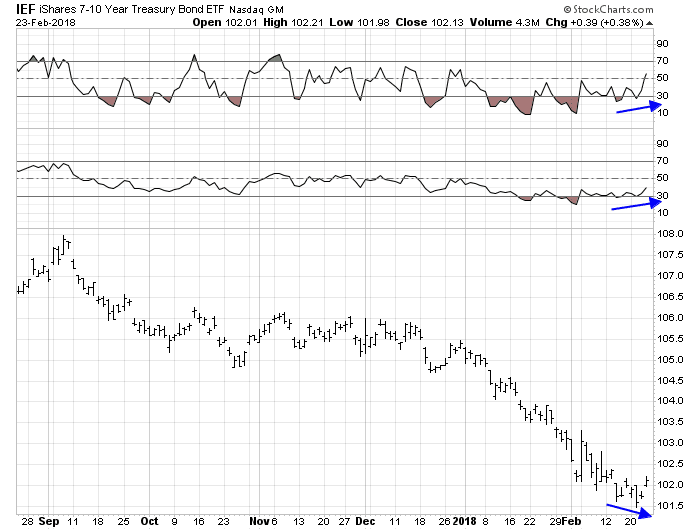
Bond prices are also setting up for a possible rally from a technical perspective. The chart below of the 7-10 year Treasury ETF (IEF) is flashing a clear positive divergence on RSI-5, and a less clear signal on RSI-14.
The positive divergence is more visible in this chart of the long Treasury bond ETF (TLT). The difference between IEF and TLT could be chalked up to an excessive market focus on the 10-year Treasury note yield, which violated the downtrend line from 1990, compared to the long bond yield, whose long-term downtrend remains intact.

Stock market implications
As bond prices have historically been inversely correlated to stock prices, a bond price rally would imply some near term stock market weakness. This is consistent with the analysis by Jeff Hirsch of Almanac Trader, who found that the end of February tends to be seasonally weak for stocks.
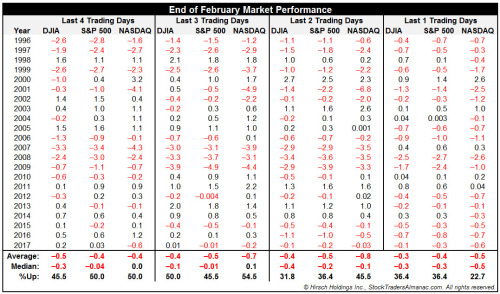
Last week’s market pattern was disappointing for the bulls. The window for a Zweig Breadth Thrust expired on Friday without a buy signal. The ZBT Indicator did not achieve a 61.5% reading within the 10 day time frame.

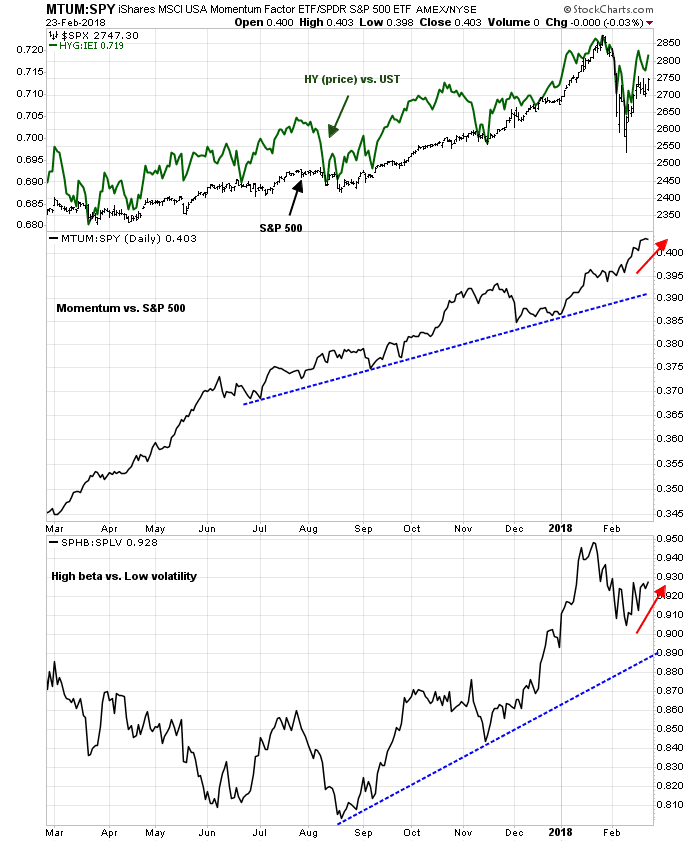
Moreover, the daily pattern of strong opens and weak closes also indicated that the bulls were unable to take control of the tape. The charts below of the major US indices gives us an indication of the strength and breadth of the rally. The SPX did manage to stage a rally Friday that regained its 50 day moving average, and tested a 61.8% Fibonacci retracement resistance level on weak and unconvincing volume. The DJIA and midcap stocks have not shown sufficient strength to test the Fibonacci resistance level, though the small caps have. The market rally is being led by NASDAQ stocks, which has powered above all retracement levels.

This chart leads to a glass half full-half empty interpretation. The half full bullish view is the rebound leaders are the high beta and momentum stocks, which is indicative of a renewal of risk appetite. The half empty bearish view is the combination of narrow leadership and middling breadth is not the foundation of a sustainable rally.
My base case scenario calls for more near term choppiness and consolidation, though I would become more bullish should the market show more strength early in the week. Despite my near term caution, I remain intermediate term bullish. Fundamental momentum remains intact. The latest update from FactSet shows that the one-time tax cut related surge in forward EPS estimates have largely petered out, but organic cyclical revisions remain healthy.

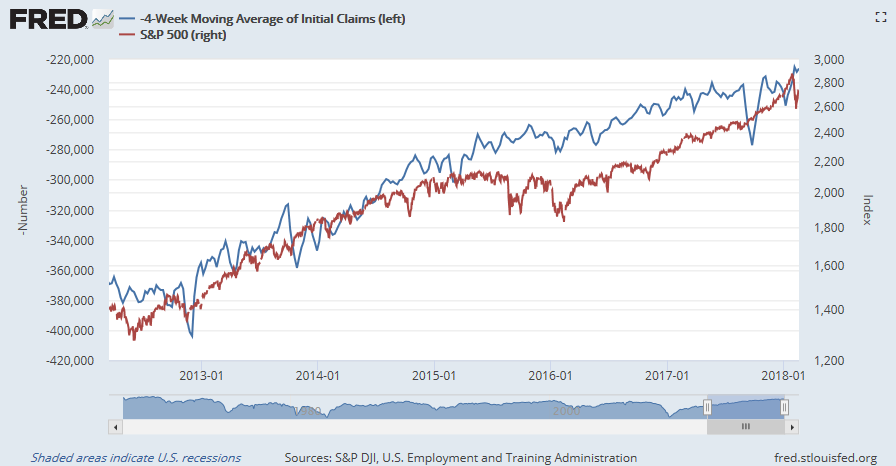
In addition, initial jobless claims (blue line) has shown a close inverse and coincident correlation to stock prices (red line). Initial claims continue to improve and show no signs of weakness, which is equity bullish.
The latest update of COT data for the high beta NASDAQ 100 shows that large speculators are in a crowded short position, which is intermediate term bullish. However, COT data is an inexact market timing indicator. In the past, the market had made double dip bottoms after extreme bearish readings was observed.

My inner investor is constructive on the market, and the risk profile of his portfolio is at the neutral position between stock and bonds, as mandated by the target asset mix specified by his investment policy. My inner trader has a small long position. He is prepared to either buy the dip, or the breakout.
Disclosure: Long SPXL
The COT graph of Nasdaq shows a double bottom of short positions between August 2015 and first half of 2016. However, in between the two time frames, Nasdaq 100, recaptured its old high. One would like to see such an action forming with a double bottom over the net six moths or so, to give this bull market a second plausible leg up.
Generally speaking, if the long term secular trend in interest rates bottomed in 2016, expect different technical signals to occur going forward than what we got used to during the secular decline in rates. For example, when speculators get short the bond futures, contrarily, bonds would rally predictably. If we are in a new regime, bonds will stage a surprisingly minor rally and head back down again. This is when you know you are in a bear market.
This is simply the opposite of persistent bullishness at the beginning of a new bull market in stocks like early 2016. If an investor shorted the market then because shorting an overbought stock market was a winning strategy in 2014-2015, they would have lost a lot of money. Long term readers will remember I was cautioning that a new bull market had started and overbought readings should not be acted on.
There is enough evidence that we likely have made a long term secular low in interest rates. Central Bankers are shifting out of massive QE stimulus programs now that we are in a synchronized global economic recovery. If that is the case, I’d be wary of short term technical bond buy signals.
If the secular trend in rates has morphed into a long term sideways bottoming trend rather than a rising one, then it would be okay to use standard techniques but not expect as good of a result.
By year end, we should likely know how the longer term global and U.S. interest rate regimes are evolving. Wish for moderation but be prepared for something worse.
Ken
Thanks for your feedback. As you note, shorting the ten year treasury was a winning hand last year. So far, every rally of the ten year treasury has been sold into also, confirming what you have said that we are looking at an end of a secular bull market in bonds.
Your conclusion circa 2015-16 of a stock bull market was prescient. Do you think that the current bull market has started a new leg up, considering the significant likelihood of earnings rise in the S&P going forward?
And large month end buying by all accounts…….will help squeeze the shorts,