Preface: Explaining our market timing models
We maintain several market timing models, each with differing time horizons. The “Ultimate Market Timing Model” is a long-term market timing model based on the research outlined in our post, Building the ultimate market timing model. This model tends to generate only a handful of signals each decade.
The Trend Model is an asset allocation model which applies trend following principles based on the inputs of global stock and commodity price. This model has a shorter time horizon and tends to turn over about 4-6 times a year. In essence, it seeks to answer the question, “Is the trend in the global economy expansion (bullish) or contraction (bearish)?”
My inner trader uses the trading component of the Trend Model to look for changes in the direction of the main Trend Model signal. A bullish Trend Model signal that gets less bullish is a trading “sell” signal. Conversely, a bearish Trend Model signal that gets less bearish is a trading “buy” signal. The history of actual out-of-sample (not backtested) signals of the trading model are shown by the arrows in the chart below. Past trading of the trading model has shown turnover rates of about 200% per month.

The latest signals of each model are as follows:
- Ultimate market timing model: Buy equities
- Trend Model signal: Neutral
- Trading model: Bearish
Update schedule: I generally update model readings on my site on weekends and tweet mid-week observations at @humblestudent. Subscribers will also receive email notices of any changes in my trading portfolio.
Rising inflation = Secular commodity bull
This chart has been floating around since July and was featured in a Marketwatch article. While it is interesting from the viewpoint of a chartist, the stretched relationship between stocks and commodities is difficult to reconcile when seen through macro and fundamental lenses. Rising commodity prices require a sustained recovery in inflation, or a collapse in the value of financial assets. How is that possible in this era of inflation undershoot and pedal-to-the-metal central bank QE?

I think I found the answer, and it may be a signal of an inflection point in inflation, interest rates, and asset return patterns.
Demographics is destiny
The Bank for International Settlement, or BIS, recently published an important working paper by Charles Goodhart and Manoj Pradhan that explained how inflation is about to return because of global population demographics. Here is the abstract:
Between the 1980s and the 2000s, the largest ever positive labour supply shock occurred, resulting from demographic trends and from the inclusion of China and eastern Europe into the World Trade Organization. This led to a shift in manufacturing to Asia, especially China; a stagnation in real wages; a collapse in the power of private sector trade unions; increasing inequality within countries, but less inequality between countries; deflationary pressures; and falling interest rates. This shock is now reversing. As the world ages, real interest rates will rise, inflation and wage growth will pick up and inequality will fall. What is the biggest challenge to our thesis? The hardest prior trend to reverse will be that of low interest rates, which have resulted in a huge and persistent debt overhang, apart from some deleveraging in advanced economy banks. Future problems may now intensify as the demographic structure worsens, growth slows, and there is little stomach for major inflation. Are we in a trap where the debt overhang enforces continuing low interest rates, and those low interest rates encourage yet more debt finance? There is no silver bullet, but we recommend policy measures to switch from debt to equity finance.
The approach taken by Goodhart and Pradhan is philosophically similar to the approach used by Branko Milanovic in his study of global vs. local inequality in formulating his well-known elephant graph. While local (within country) income inequality has risen between 1998 and 2008, global inequality has fallen because of the effects of globalization.

The authors of the BIS paper have taken the same approach to global demographics:
We approach the critical role of demographics differently from previous studies in three specific ways. First, we attach a great deal of importance to the role of China, both in the past and future. Second, we argue that the political economy of the social safety net in AEs will play a critical role in driving our results. Third, in an extension of our first point, we take what we think is a truly global approach to the discussion of demographics, looking collectively at the global labour supply and the global prices of labour and capital. By contrast, much of the literature that looks at demographics in an international context examines local demographic dynamics of two (or more) economies and then discusses spillovers to and from neighbouring economies.
Here is their key argument, and somewhat controversial conclusion:
We argue that ageing will lower both desired savings and desired investment, but desired savings will fall by more. The resulting imbalance will require the real interest rate to rise for the market to clear. Just as the real interest rate has fallen since the 1980s thanks to a decline in desired investment borne out of the demographic sweet spot we described above, real interest rates will reverse course along with demographic trends and the resulting changes in savings and investment dynamics.
This is clearly our most controversial proposition, and much of the pushback we receive is based on the argument that demographics will lower potential output growth, and hence real interest rates. We agree wholeheartedly with the first argument regarding output growth. But we disagree that it will also lower real interest rates. Indeed, there is much less reason to believe the two are connected than many believe. We discuss first the path to determining the equilibrium real interest rate and then delve into some of the dynamics that will drive savings lower but keep investment from falling by as much or more.
As the world ages, both the savings and investment rate will fall, but Goodhart and Pradhan believe that the investment rate will fall more slowly, which raises the cost of capital and therefore drive up real interest rates:
Our view is that the corporate sector is likely to respond by raising the capital/labour ratio, ie by adding capital to compensate for labour, which is the factor of production that is getting scarcer and more expensive.
There will be a rising cost of labour and a falling cost of capital. We cannot think of any other time in history when the prices of the two main factors of production were moving as clearly in opposite directions. Even before demographics start pushing wage growth up, the price of capital goods has already collapsed. As wages begin to rise, compensating for more expensive labour will be easier thanks to a lower cost of capital goods. The resulting increase in productivity will somewhat temper the increase in wages and inflation. The savings and investment lens gives us another way to view this response. Given significantly cheaper capital goods, the cost of accumulating a given stock of capital uses up a smaller amount of the economy’s stock of savings. To some extent, this can counter the savings deficit created by ageing demographics and somewhat temper the rise in both the interest rate and wages.
They acknowledge that there are three key risks to their thesis:
- Withdrawal of the social safety net in advanced economies: A more fragile social safety net will raise the savings rate, which would the savings and investment relationship towards a lower cost of capital.
- Higher participation rates and the rise of India and Africa: Much of the favorable demographic patterns in the last two or three decades is attributable to the enormous rise in labor supply from China. Now that China is aging, that demographic sweet spot is turning sour. However, should Africa and India step up and take up the role that China did in the last few decades, or if the participation rate rises substantially in advanced economies, the capital/labor ratio equilibrium changes, which puts downward pressure on inflation.
- High debt levels delay the inevitable: If US real interest rates rise or threaten to rise quickly, debt servicing will become more difficult, in turn putting downward pressure on spending and real interest rates.
Notwithstanding the risks, this BIS working paper represents a solid argument for the secular revival of inflationary pressures over the next decade.
Intermediate inflation and interest rate outlook
However important the inflation thesis of the BIS paper, nothing in it tells us anything about the outlook for inflation for the next month, next quarter, or even next year. Inflation has been surprising to the downside all around the world, though it may be stabilizing in the eurozone and emerging market economies.

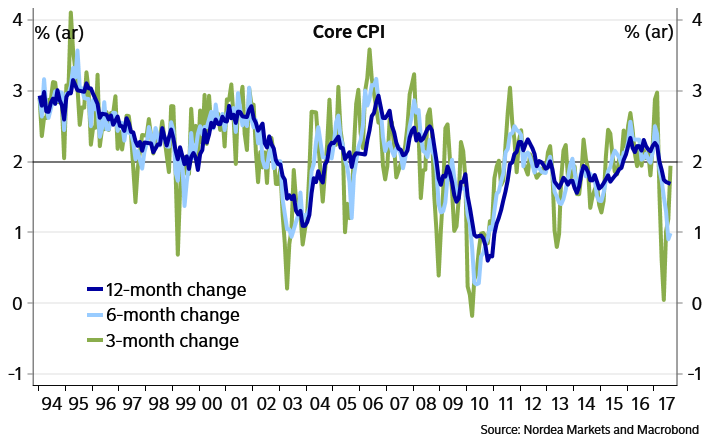
In the US, the markets were surprised last week by the stronger than expected CPI readings. However, much of the strength was attributable to a surge in Owners’ Equivalent Rent. Nevertheless, core CPI momentum has been picking up in the last few months.
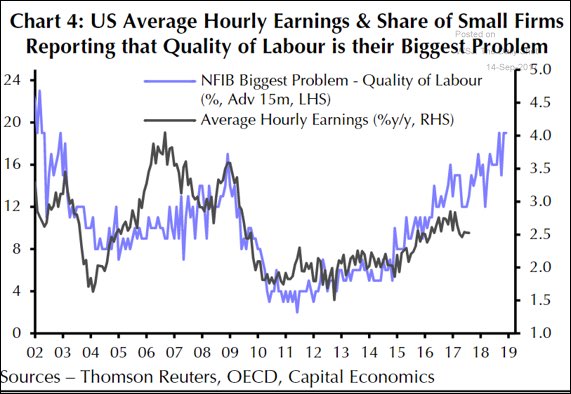
Leading indicators of inflation are picking up. Capital Economics pointed out that the NFIB quality of labor index leads average hourly earnings by about 15 months. Wage inflation is likely to pick up.
The combination of these forward indicators, along with New York Fed President Bill Dudley’s contention that financial conditions are still easing while Fed Funds are rising, mean that the Fed is likely to stay the course on normalizing monetary policy.

I pointed out recently that one wildcard of Fed policy is the composition of the Federal Reserve’s Board of Governors, as there will be four vacant seats after Stanley Fischer’s departure, out of a total of seven (see The Fed’s perfect storm of 2018). As well, there is the question of whether the Trump administration will replace Janet Yellen as Fed chair when her term expires in February. Bloomberg reported that virtually all of the potential candidates for Fed chair are Republicans who favor rules-based approaches to monetary policy. As most rules-based approaches will see Fed Funds targets that are higher than they are today, this will put upward pressure on interest rates.
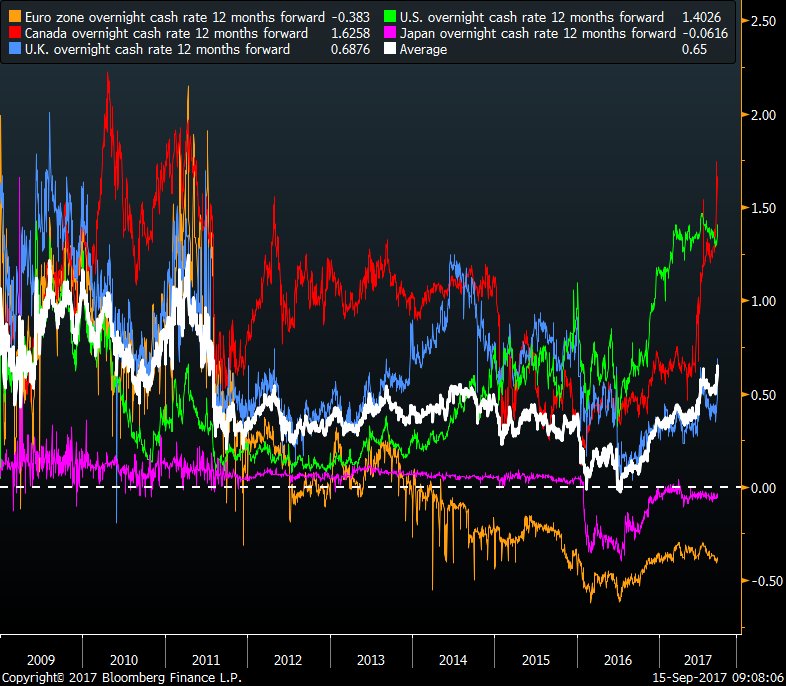
Interest rate expectations are also rising globally. The chart below depicts the 12-month G7 forward rates, which has reached the highest since 2011.
I would be not be surprised by a hawkish FOMC statement from their upcoming meeting on Wednesday. My base case is a Fed decision to begin normalizing its balance sheet at its September meeting, followed by a December rate hike.
Market implications
When analyzing the market implications of rising inflation on asset prices, we have to distinguish between cyclical effects and the secular trend. While a case can be made for a secular bottom of inflation, the cyclical trend is trickier. The US economy is in the late phase of an expansion. Past episodes have historically seen a cyclical inflation surge, followed by the Fed raising rates to cool the economy, and pushes the economy into recession.
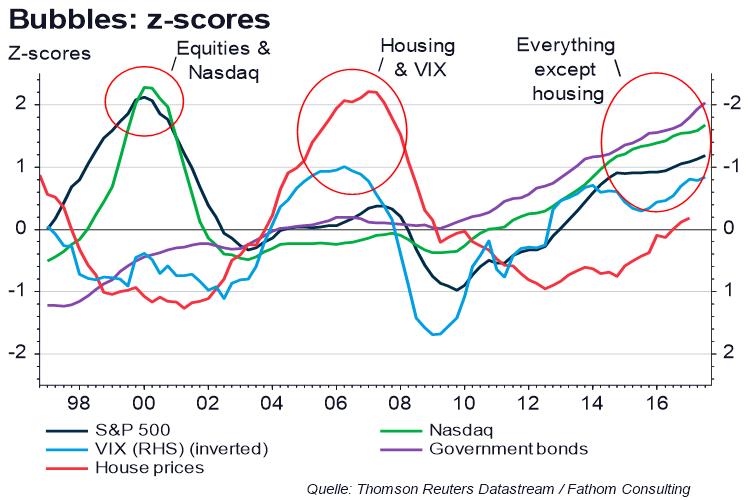
From a long term perspective, the following chart from Fathom Consulting is a useful guide showing the bubble z-scores of different asset classes over time. While there seems to be asset bubbles everywhere today, the most extended asset class is government bonds, followed closely by NASDAQ stocks. Should interest rates start to rise, first cyclically because of tighter bank policy, and later from a secular basis because of the demographic pressures outlined in the BIS paper, bond investors are likely to suffer substantial losses.
Under such a scenario, the scramble for yield by extending duration are going to come back and haunt investors. As another example of the yield madness today, Austria recently floated a 100-year old bond at 2.1%, which is less than what 10-year Treasuries are paying.

Stocks should outperform bonds in an era of rising inflation and inflationary expectations. Nominal company sales and profits are more linked to inflation than bond coupons, which are fixed. That said, sector leadership will gradually shift to hard asset linked inflation hedge sectors. Indeed, these sectors are currently bottoming out on a market relative basis.
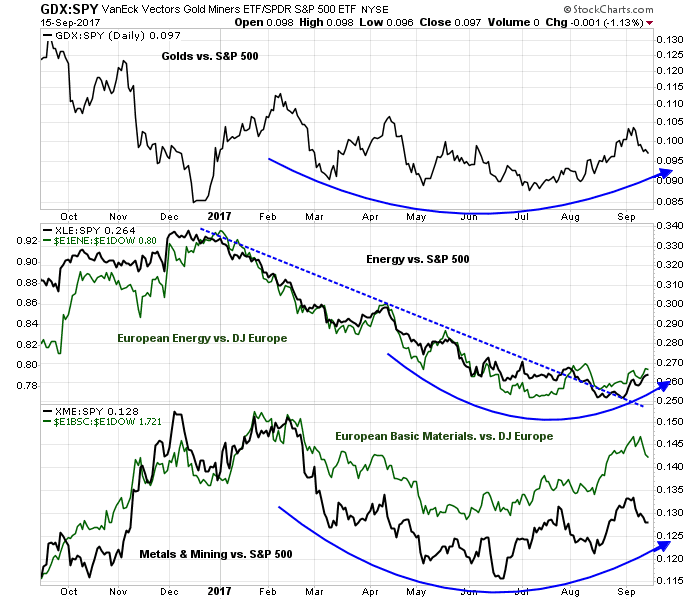
I would warn, however, that any leadership exhibited by these late cycle sectors are cyclical in character. Tighter Fed policy to choke off inflation is likely to tank the performance of these sectors. For now, they should only be viewed as trading vehicles.
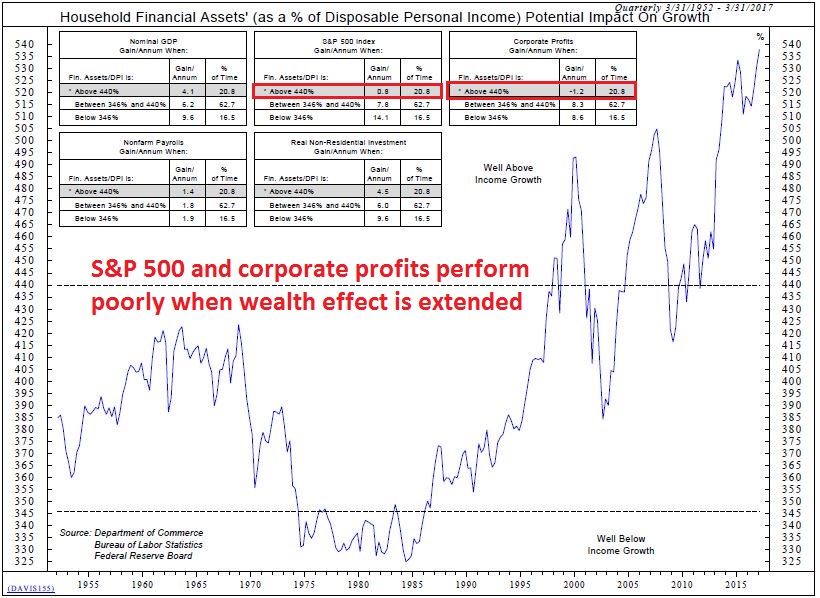
Still, equity investors are not out of the woods from a long term perspective. Ned Davis Research also observed that, from a cyclical viewpoint, an extended “wealth effect” as measured by the ratio of Household Financial Assets to GDP has led to poor performance by stocks and corporate profits (annotations in red are mine).
The week ahead
When I shorten the stock market’s time horizon to a trader’s perspective, not much has changed since my mid-week update (see A “good overbought” advance, or an imminent pullback). While I am maintaining an open mind, I am still tilting towards the bearish scenario that the market is at the top of a trading range.
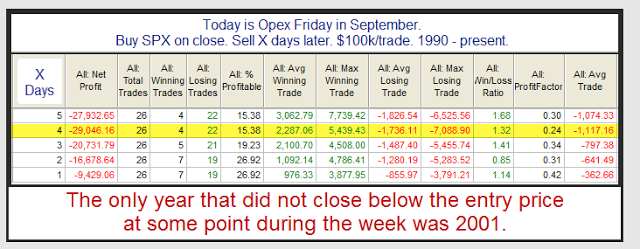
Seasonality does not favor the bulls next week, Jeff Hirsch of Almanac Trader observed that the SPX has been down 22 of the last 27 weeks after September option expiration (OpEx), which was last Friday. The average SPX loss in the September post-OpEx week since 1982 was -0.64%, and -1.00% since 1990. Rob Hanna at Quantifiable Edges found a similar effect.
Tom DeMark also warned of a market top (click link if the video is not visible).
The Fear and Greed Index has turned from fear to greed in very quickly as it has surged to 77 from 17 three weeks ago. While readings could get more bullish, they are getting extended, indicating that upside potential in stock prices may be limited.

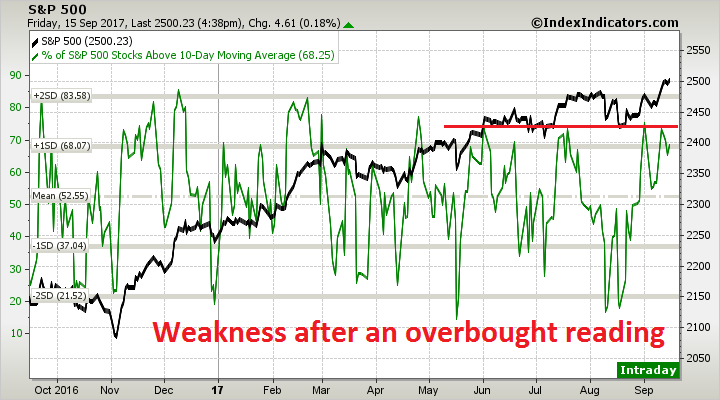
As well, breadth indicators from Index Indicators show the market retreating from an overbought reading, with negative momentum dominant in multiple time frames. Here is the % of stocks above their 5 dma:

Here is the % of stocks above their 10 dma:
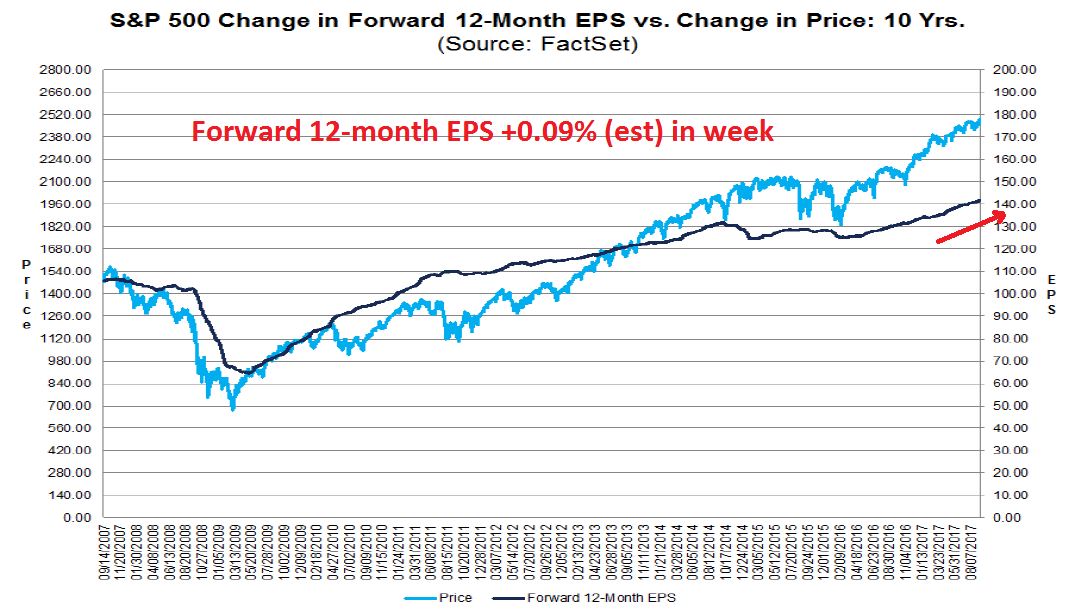
That said, the music is still playing, which is a signal that the intermediate term remains bullish. The latest update from FactSet indicates that forward 12-month EPS continues to trend upwards.
Moreover, New Deal democrat’s weekly assessment of high frequency economic indicators was bullish: “Despite the hurricane impacts, the economy appears in very good shape over the near term, and retains a positive tone, if more mutedly so, in the longer term.”
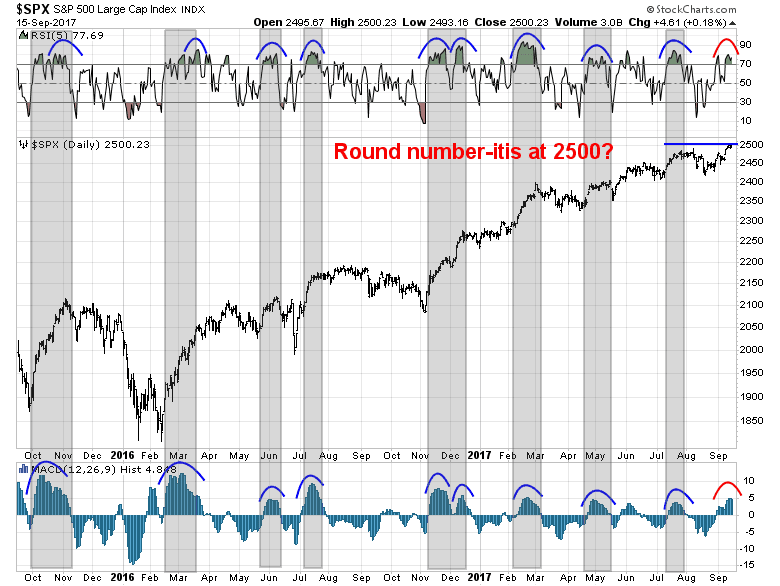
My inner investor remains neutrally weighted in accordance with his target asset mix weights. My inner trader missed the bottom of the rally and was caught short as the SPX rallied up to 2500. The technical picture suggests a period of either sideways consolidation or shallow correction next 1-2 weeks, when that will the opportunity to buy the dip. The SPX may catch a case of round number-itis, where it stalls or pulls back at a major round number. As well, past episodes where the market has become overbought on RSI-5 and MACD has begun to roll over has often seen some short-term weakness.
Disclosure: Long SPXU
Excuse me as I post here some timely information I just sent to my momentum book buyers about current stock market sector leadership;
In my book on momentum investing, I provide the usual momentum charts that have longer term momentum (nine months) that follow standard momentum theory PLUS short term charts that I call LLLL charts. That stands for Leaders or Laggards from Last Low. I’ve found leadership is a critical factor. The ‘Last Low’ part is the date of last important intermediate investor sentiment low. Recently that was August 18 and on the LLLL charts, I rebase the beginning price of the ETF and the S&P 500 to that date and change it whenever the market has an important correction.
To mark a sentiment low, I use sentimentrader.com. They were kind enough to provide this link that shows their three sentiment charts that I used to mark August 18 as the last important low. You can see the dip to investor pessimism levels on the three charts at that time.
https://www.sentimentrader.com/blog/model-updates
Sentimenttrader.com has hundreds of great sentiment charts on stocks, commodities, ETFs, bonds and currencies. They send out a daily sentiment update of new observations. I can’t recommend them highly enough.
Veteran investors all have a story of being burned by owning high-momentum bubble stocks that later crash. This turns them off momentum investing. The LLLL charts gives one an early clue as to when a popular group is topping out and the game is over or if all is well. Leaders should stay leaders.
Here are current examples of my book’s LLLL charts that are identifying possible new trends. An investor has to decide if the LLLL findings makes good sense or not. I offer my suggestion.
U.S. Healthcare. New leadership. Is Repeal and Replace dead?
https://product.datastream.com/dscharting/gateway.aspx?guid=cefbf560-c522-47c5-a2d3-4959b25bd51b&action=REFRESH
Internet. All is well – leadership carries on. No need to worry about a bubble top yet.
https://product.datastream.com/dscharting/gateway.aspx?guid=194f5c43-1948-4f05-bcb8-d79f26f39ecc&action=REFRESH
Financial. Leadership Failure. Yield curve is flattening as rate outlook softens.
https://product.datastream.com/dscharting/gateway.aspx?guid=4df87994-e129-4d73-9de2-d730eb9bdba7&action=REFRESH
Clean Energy. Niche area new leadership. Solar and battery technology advances.
https://product.datastream.com/dscharting/gateway.aspx?guid=c19e8b30-0831-4cee-b2ab-e1d11d34e620&action=REFRESH
Oil & Gas Producers. Long term underperformer that may be turning big time. I call these in the book ‘Crash Victims’ with a strategy to own this type safely.
https://product.datastream.com/dscharting/gateway.aspx?guid=5e270083-03bc-44d8-8add-2ecf5a9b166d&action=REFRESH
My book is an important new addition to momentum investing strategy by describing when NOT to use it; when an outperforming bubble is ending or an underperforming ‘Crash Victim’ is finally beaten up enough to start a new long term uptrend.
If you think you or your friends can benefit from the book, it’s available for $50 at this website http://thepathway.ca/ Pass along this valuable information on momentum investing and the tools to make it happen successfully.
I quote from the your article:
“As the world ages, both the savings and investment rate will fall, but Goodhart and Pradhan believe that the investment rate will fall more slowly, which raises the cost of capital and therefore drive up real interest rates”
What Goodhart and Pradhan are forgetting is that the “cost of capital” will be driven to zero and into negative territory by central banks. Yes, when capital availability is fixed (to say level of inflation), their premise may be correct. However, profligate and prodigal capital availability by central banks will drive cost of capital to zero or lower. We have already seen the determination by the central banks.
The BIS paper quoted here does not want to address the idea that retirees and older people are generally averse to spending (except on healthcare especially in developed economies). As global population ages, deflation is likely to be the rule (Japan is a good example over the past forty years).
India and China have GDP per capita of less than 9k US $ per person per year (India about half the number, give or take). They are unlikely to move the needle of profligate consumption to compete with western economies where per capita GDP is orders of magnitude higher than India and China. Automation is likely to replace inefficient labor pool from India and Africa and looming labor shortages in Advanced economies. So, perhaps, labor in Advanced economies may become more expensive because of demographics, but is that the only reason why inflation goes higher?
The classic hard assets turning up in value may have more to do with underinvestment in mining and drilling. Yes, inflation may turn higher here, but the ideas put forth in the BIS paper appear somewhat confusing at best.
It’s not a question of whether the hypothesis is right or wrong, for investors it’s a question of what central bankers believe and how they will react.
In my old age, I have become agnostic about what the right direction is for policy, but I am much more interested in understanding how policy makers think.
Cam
I see your perspective through all of this.