Mid-week market update: I normally write my mid-week market update on Wednesday, but the market action on FOMC decision days tend to be wildcards and not necessarily indicative of future market direction, therefore I am writing my commentary a day early.
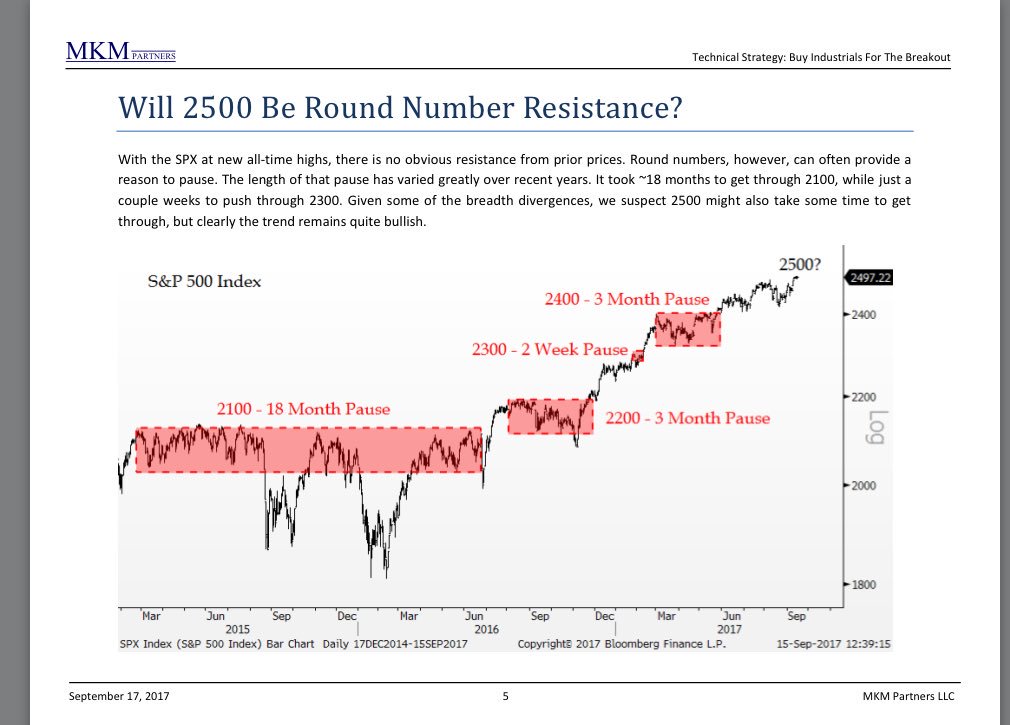
I agree with Jonathan Krinsky of MKM Partners when he wrote that the stock market is likely to encounter some resistance at SPX 2500, but the intermediate term remains bullish.
There are a number of strong negative seasonal factors at work, as well as some short-term overbought indicators that point to either a period of consolidation or shallow pullback. That said, I discovered a little noticed but unusual sentiment buy signal that has historically resolved itself bullishly in the past.
Negative seasonality
Rob Hanna at Quantifiable Edges highlighted the negative seasonal pattern in the week after September option expiry (OpEx). Here are the returns for the period 1990-2016.
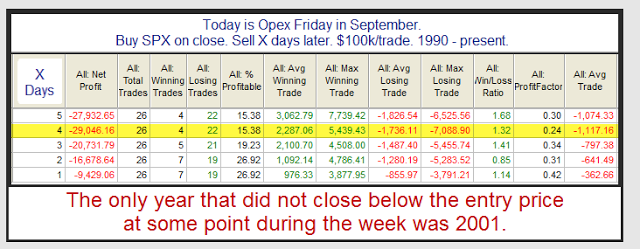
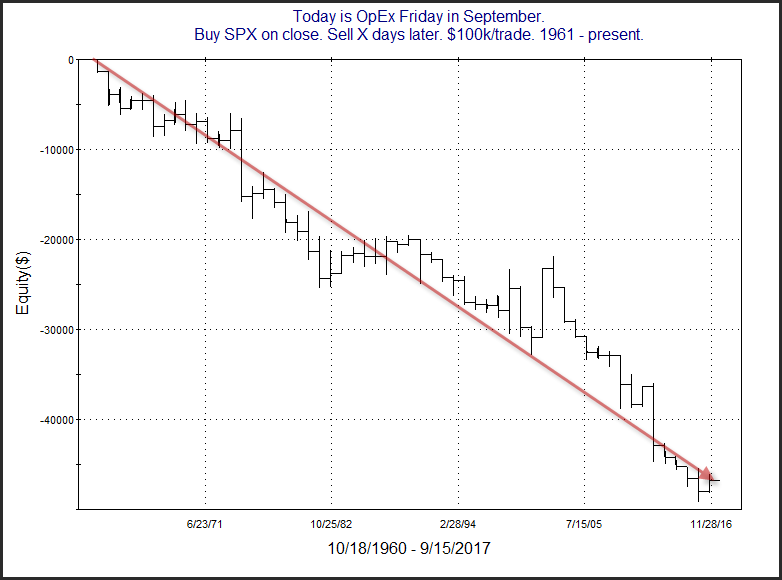
Hanna further graphically illustrated the negative seasonality for this week by showing the post-September OpEx weekly returns in this chart.
David Bergstrom found a similar negative seasonal effect at this time of the year (note highlighted dates in red).

For what it`s worth, Wednesday night is the start of Rosh Hashanah. Just remember the trader`s adage of “Sell Rosh Hashanah, Buy Yom Kippur”.
Overbought market
As well, Trade Followers, which follows trader sentiment on Twitter, found that all sectors were overbought last week. This is almost a surefire sign of a short-term top, or, at a minimum, a period of sideways market action.
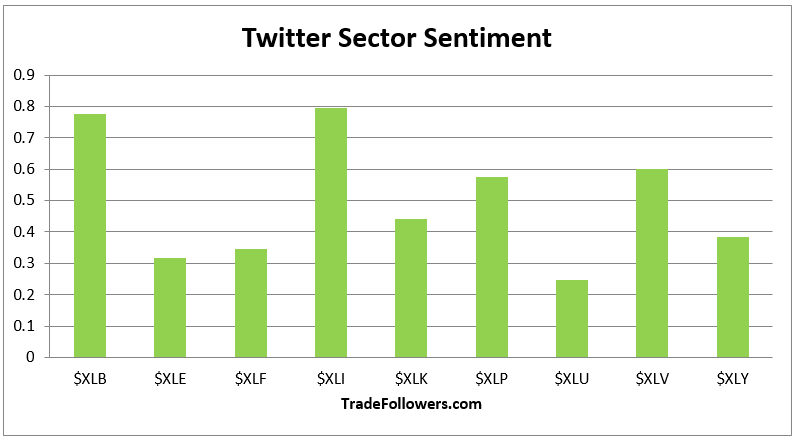
The last time this happened was in late July and early August.

NAAIM contrarian buy signal
I hadn’t noticed this until Monday, but NAAIM sentiment, which measures the sentiment of RIA portfolio managers, registered a contrarian buy signal last Thursday. In the past, whenever NAAIM sentiment has fallen below its lower Bollinger Band, it has been a very good buy signal (see vertical lines).

I missed the NAAIM sentiment buy signal because it was so unusual. NAAIM sentiment became more bearish even as all other sentiment surveys got more bullish last week. As an example, here is the AAII bull/bear spread.

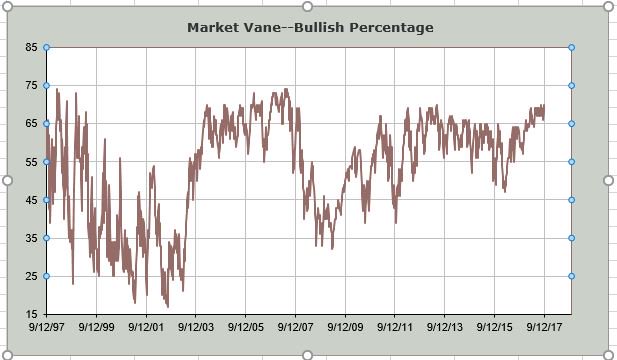
Here is a chart of the Market Vane bulls.
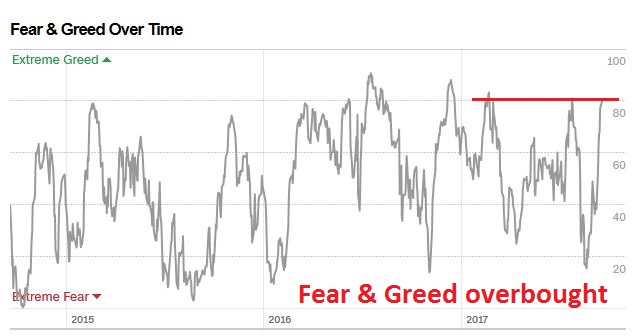
Here is the CNN Money Fear and Greed Index, which has strengthened to levels consistent with past sentiment peaks.
I could go on, but you get the idea. A dive into the the NAAIM data breakdowns revealed some suspicious readings.

Here are my main takeaways from the data analysis:
- Average sentiment fell, or got more bearish (red box), but median sentiment rose (black box), which is unusual.
- The divergence can be explained by a decline in quartile 1 sentiment and a rise in quartile 2 sentiment.
The decline in NAAIM sentiment, or increasing bearishness, could be the result of a data error. Median sentiment became more bullish, which is consistent with the results of the other sentiment surveys. However, the decline in the average sentiment could be attributable to either one or two respondents becoming extremely bearish, or a data entry error where someone mistakenly entered a survey response as “0”.
If we were to assume that the NAAIM contrarian buy signal is correct, then a study of past signals reveal astoundingly bullish results for this buy signal. Returns appear to top roughly six weeks after a buy signal.

I will therefore be watching carefully if this anomalous reading persists when NAAIM releases its next survey on Thursday. The evolution of the first quartile figure will be of particular importance. If last week’s NAAIM average was the result of a data error, then the first quartile reading should rise back to the high 60s or low 70s, and standard deviation should also decline from its relatively elevated level of 52.95.
In the meantime, my inner trader remains tilted towards the short side, pending a resolution of the NAAIM data puzzle.
Disclosure: Long SPXU