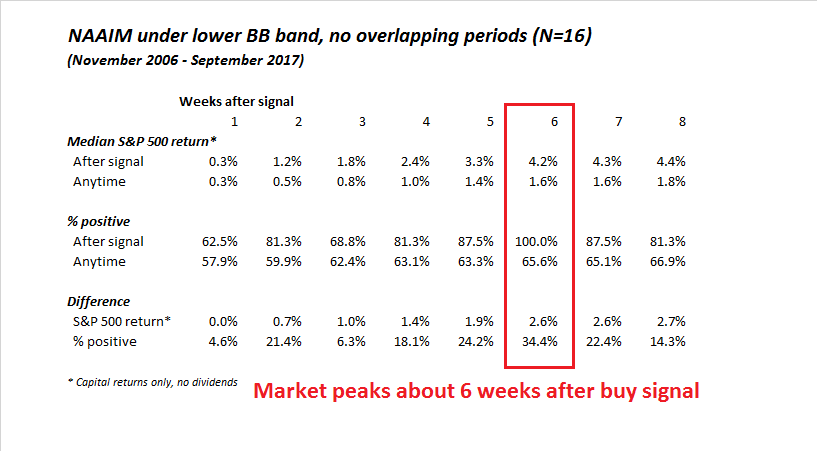
I had highlighted an unusual contrarian buy signal in my last post (see Round number-itis at 2500). NAAIM sentiment, which is reported weekly, turned anomalously bearish last week and fell below its lower Bollinger Band. Past episodes of such occurrences have turned out to be very good contrarian buy signals.
The reading last week was anomalous because every other sentiment indicator had become more bullish, while NAAIM RIAs got more bearish. This week, NAAIM managers turned more bullish, while the AAII survey became more cautious.

Was last week’s contrarian buy signal for real, or a data blip?
A dive into the data
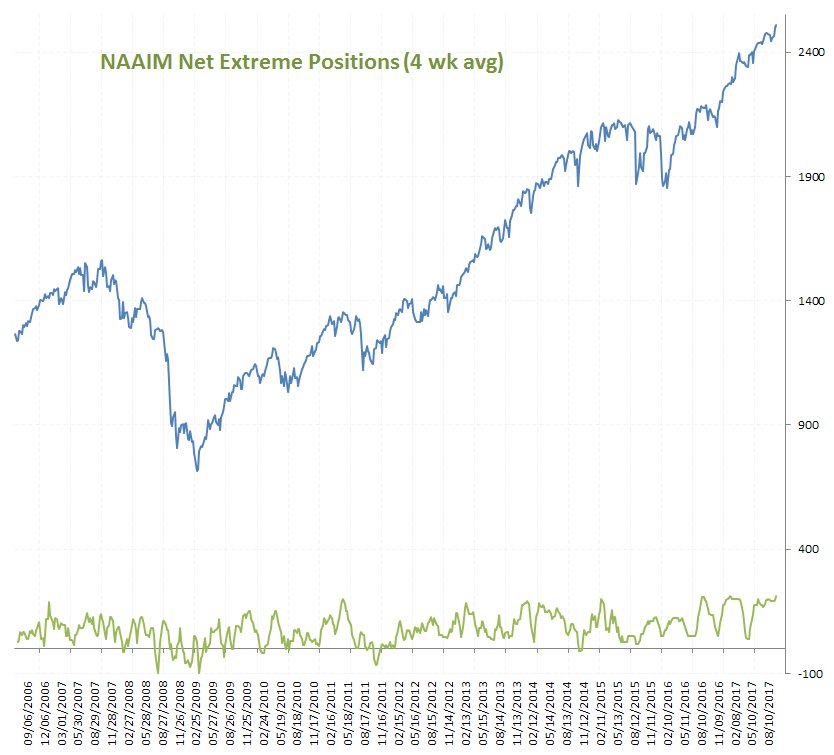
For another perspective, the bearish extreme reading disappears when we apply a 4-week moving average to the NAAIM readings.
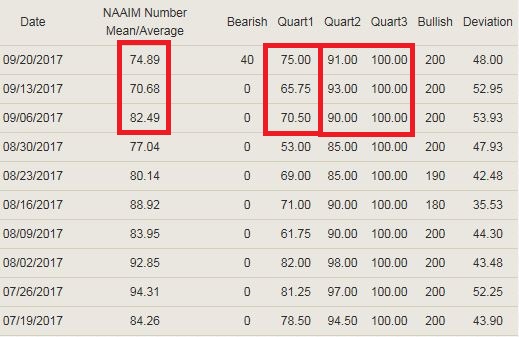
We can get further clues when we dive into the data. Here is the data table as published by NAAIM:
Here are my main takeaways:
- Last week, the average NAAIM exposure fell, but the median exposure (difference between quartile 2 and 3) rose.
- Last week, the quartile 1 break fell dramatically. This led me to speculate that the decline in the average exposure (compared to rising median bullishness) was attributable to a data error, possibly because of an erroneous data entry of zero for a manager.
- NAAIM has admitted on their website that their sample size is not large: “Although the number of participating managers, known as NAAIM Trend Setters, is steadily growing the sample size is not large and therefore may be less reflective of actual market conditions.”
- This week, average NAAIM exposure rose, and the quartile 1 break recovered significantly.
This week’s readings are consistent with my hypothesis of a data entry error last week. In all likelihood, a sentiment response was keyed in improperly last week, which dragged down the average reading. In light of the near universal rise in bullishness last week from all other sentiment surveys, I interpret last week’s NAAIM survey response as a data blip and not a legitimate contrarian buy signal.
Still tactically bearish
That said, my inner trader remains tactically bearish, though he recognizes that the stock market remains in an intermediate bull trend.
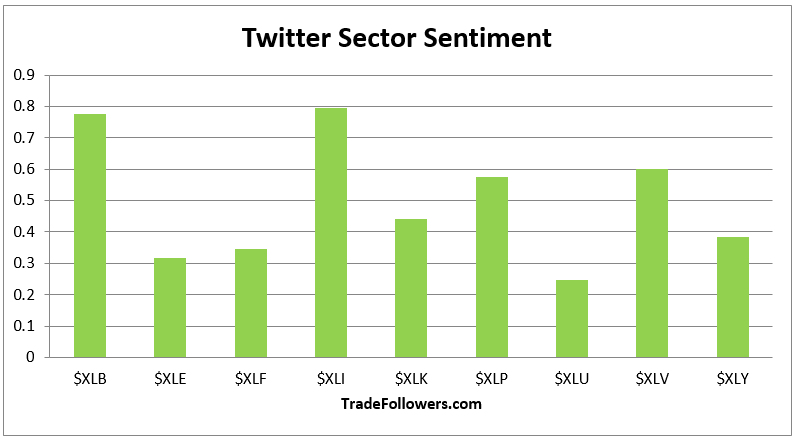
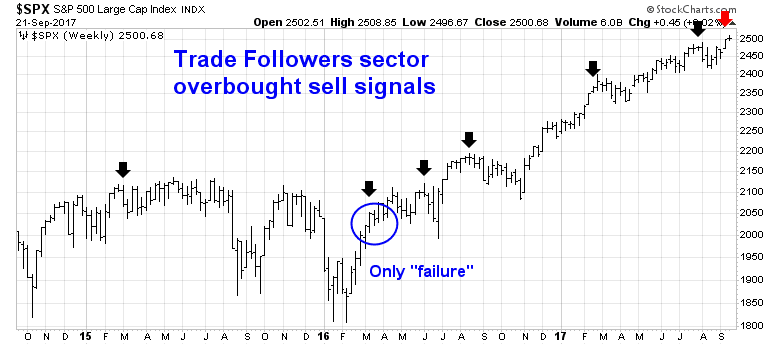
In particular, one contrarian sell signal from Trade Followers has been particularly effective. This signal is flashed whenever all sectors are showing bullish Twitter breadth readings, which they did last Friday.
Excluding the current signal, there were six similar sell signals since 2015. In five of the six instances, the market either declined or stalled. There was only one failed signal, which occurred in March 2016, though the market did decline slightly the week after that signal. Here is a list all of the past Trade Follower posts of with similar sell signals:
- Cracks in the dam (August 6, 2017)
- Short term top ahead (February 20, 2017)
- Time for a short term top (August 14, 2016)
- Everyone is waiting, but… (June 5, 2016)
- Short term top likely (March 13, 2016)
- Twitter predicting decline for stocks (March 1, 2015)
In addition, Tom McClellan recently warned about short term stock weakness due to subdued volume in XIV. Past episodes of low XIV volume have been signals for traders to be cautious.
As a result of these factors, my inner trader is maintaining his short term short exposure to equities.
Disclosure: Long SPXU
Cam
The standard deviation of the NAAIM is so large as to make the numbers questionably useful. Such large standard deviation indicates a very small sample size (as you have hinted). My critique here is unqualified, as I have not studied their report nor methodology, but that is what the data seem to indicate.
At the time of the March 2016 ‘failure’ I was saying in this blog my research indicated we were starting a new bull market cycle. I went on to say that markets stay ‘good overbought’ in the early stages of a new bull market. Hence one should not exit using normal overbought/oversold indicators.
Since early 2016 the market is up 30%. At the time I made my ‘new bull market’ call virtually every strategist was saying the bull market was seven years old and ready to fall. Cam turned bullish on commodities at that time. He separates from the herd correctly.
Listening to negative strategists back then would have been so costly.
Having a rules based model for where we are within stock market cycles is critical.
Where are we now? I agree with Cam. The top is further ahead. Leading economic indicators are positive and junk bond spreads are low and falling. The economic background is market friendly. Any correction should not be a bear. Sentiment is getting to off the charts positive and thus an intermediate pull back is likely.
As a portfolio manager, my outlook is intermediate. I was maximum weight stocks (100%) until March, the first 25% gain of the new bull market. I’m a bit underweight now at 60% (70% is neutral).
If we get a bubble-type extreme surge higher here, which could happen, I would expect a mini-crash scenario like 1987 to follow to flush out the system (likely an ETF bailing stampede). There was no recession in 1987 or 1988. I would stay with my holdings using tight moving average sell disciplines and also shift to hedging any stock exposure left with inverse ETFs bought with the proceeds of my sales. But note that is only if markets get bubble crazy.
This type of thinking is how my client portfolios went UP in 2008 and 2000-2002 when markets fell 50%. Hard to believe but I have the national press clippings to prove it.
All the best. We are in this together.
Cam,
This indicator has been in a consistent downtrend since July. Do NAAIM members know something?