Preface: Explaining our market timing models
We maintain several market timing models, each with differing time horizons. The “Ultimate Market Timing Model” is a long-term market timing model based on the research outlined in our post, Building the ultimate market timing model. This model tends to generate only a handful of signals each decade.
The Trend Model is an asset allocation model which applies trend following principles based on the inputs of global stock and commodity price. This model has a shorter time horizon and tends to turn over about 4-6 times a year. In essence, it seeks to answer the question, “Is the trend in the global economy expansion (bullish) or contraction (bearish)?”
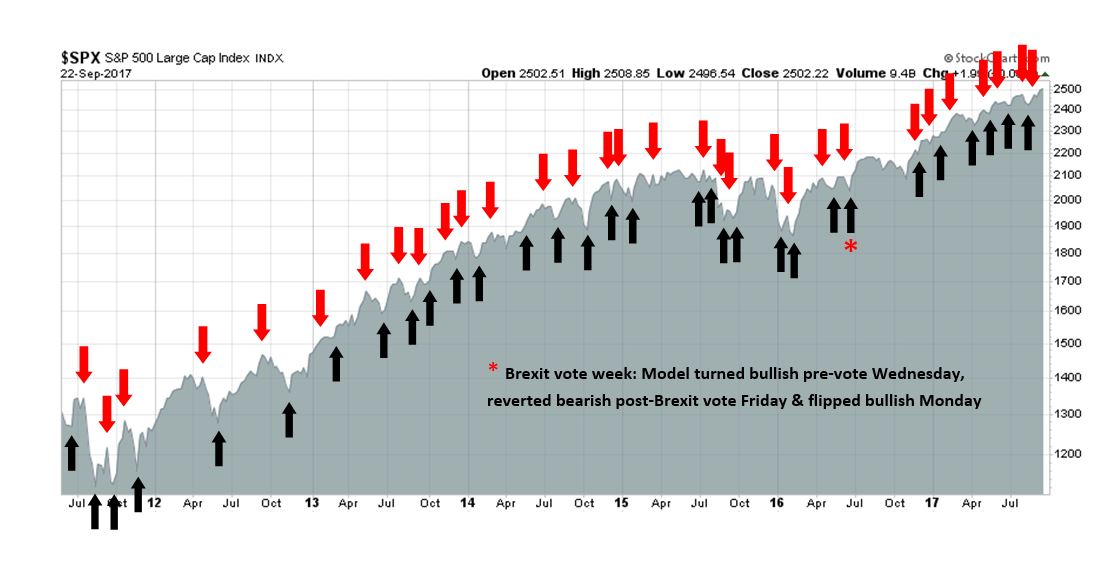
My inner trader uses the trading component of the Trend Model to look for changes in the direction of the main Trend Model signal. A bullish Trend Model signal that gets less bullish is a trading “sell” signal. Conversely, a bearish Trend Model signal that gets less bearish is a trading “buy” signal. The history of actual out-of-sample (not backtested) signals of the trading model are shown by the arrows in the chart below. Past trading of the trading model has shown turnover rates of about 200% per month.
The latest signals of each model are as follows:
- Ultimate market timing model: Buy equities
- Trend Model signal: Neutral
- Trading model: Bearish
Update schedule: I generally update model readings on my site on weekends and tweet mid-week observations at @humblestudent. Subscribers will also receive email notices of any changes in my trading portfolio.
The risks to the bond market
The Fed has spoken. Janet Yellen made it clear that the Fed is ready to normalize monetary policy, come hell or high water. This tone to US monetary policy begs the question of how much interest rates can rise.
The Citigroup Economic Surprise Index (ESI), which measures whether high frequency economic releases are beating or missing expectations, has been on a tear for the last few months. In the past, rising ESI values have put upward pressure on bond yields (blue line). How far can they go up this time, and what kind of effects will they have on stock prices?

Moreover, there are a number of indications that the Fed will become increasingly hawkish, and the trajectory of interest rate increases discounted by the market are well below actual Fed actions.
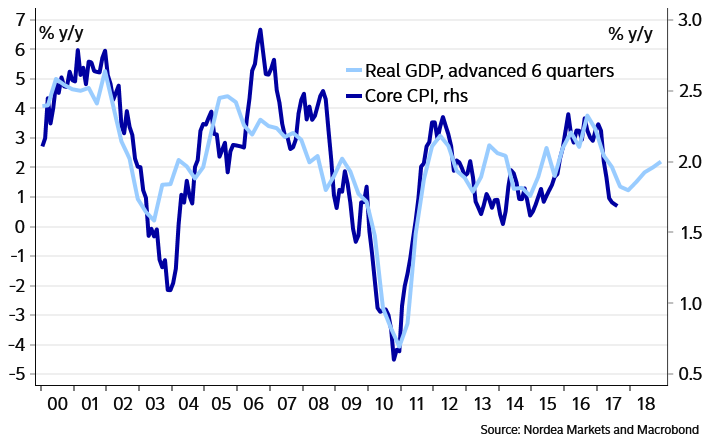
Higher growth = Higher rates
The historical relationship between GDP and inflation indicates that rising growth translates to higher inflation. If the Fed is this determined to raise rates when inflation appears to be nonexistent, how determined will it be when inflation becomes apparent?
The growth recovery is not just confined to the US alone. The South Korean economy is known as the global canary in the coalmine because of its cyclical sensitivity. The latest pickup in Korean exports will likely translate into better global growth in the near future.

For now, equity investors will likely treat rising growth as good news. On the other hand, higher growth and inflation are likely to pressure the Fed to raise rates at a rate faster than market expectations, which will eventually be bearish for stock prices. Keep an eye on how the shape of the yield curve is evolving. Past yield curve inversions have been recessionary signals, but the yield curve may not invert this time ahead of the next recession because of the Fed’s Quantitative Tightening program. Nevertheless, a steepening yield curve is still a signal that the bond market expects faster growth ahead, and a flattening curve indicates slower growth.

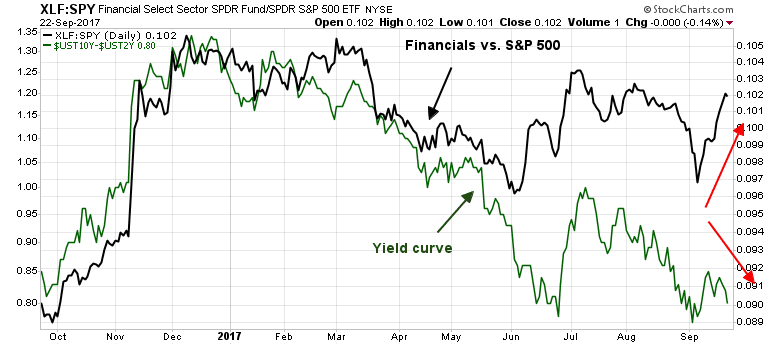
I have read a number of commentary about renewed strength in Financial stocks. Historically, the relative performance of this sector has been closely correlated to the shape of the yield curve. The flattening yield curve is setting up a negative divergence that creates downside risk potential for Financial stocks.
In short, the current economic environment is raising the risks of a Federal Reserve misstep.
1937 all over again?
In an recent interview with Business Insider, Bridgewater’s Ray Dalio indicated that the risks of a 1937 style policy error is high:
In my opinion, the risks are asymmetric on the downside. In other words, if you tighten monetary policy, certainly by more than is discounted in the market — and what’s discounted in the market is very minor rising market — that will reverberate through asset class prices, as well as then you can have a situation in terms of the economy. So, what’s similar in that: interest rates are close to zero, not much room on the downside, obligations are large, there was a political division, there is more populism. Therefore there’s more conflict. And therefore we need to be very careful at this moment. That’s what I’m basically saying.
As a reminder, the Fed tightened monetary policy into a recession in 1937.

Tony Nangle, writing at Principles and Interest, put a slightly different spin on Dalio’s concerns. Central bankers shouldn’t just focus on inflation, but rising financial leverage as a source of instability:
Claudio Borio, Head of the Monetary and Economic Department of the Bank of International Settlements, wrote an interesting paper in 2013 arguing that the idea of the output gap had kind of gone astray. Typically, monetary policymakers seek to identify potential economic growth with reference to non-inflationary economic growth. Borio argued that this is, if not bogus, too restrictive: the pace of economic growth may be unsustainably strong, and the economy operating beyond capacity, if financial imbalances (aka leverage) are building up. In other words, Borio argues that changes in the price level (inflation) and changes in the stock of private nonfinancial credit (leverage) are each important in determining the sustainable pace of economic growth.
I’ve got some sympathy with Borio. If this sounds a bit abstract think of China today: inflation is not a problem, but credit growth is rampant, perhaps to the extent that it might point to faster growth than is ultimately sustainable. Central bank mandates in many – perhaps most – developed economies are meaningfully oriented towards delivering low levels of price inflation, variously defined. Why? Because inflation is a form of monetary instability. And preventing monetary instability so that people can get on with their lives rather than obsess over the nature of money – via the creation and execution of an inflation-targeting mandate – seems a pretty reasonable thing for a monetary sovereign to do.
Central bankers should worry much more about credit growth as well as inflation:
In the speech Vlieghe [of the BOE] introduced what he called the Finance Theory of the Equilibrium Real Rate (ERR). At it’s simplest it is an intuition that interest rates are low and the risk premia attached to equities are high when the world is risky. Few would disagree. ‘Risky’ in this context means consumption growth has a lot of volatility, and (importantly) negative skew and kurtosis. The intuition is demonstrated with an historical econometric analysis of a couple of hundred years of UK data, and different regimes are identified – some with a high ERR and some with a low ERR. The different regimes have some shared characteristics of credit growth, realised equity risk premia, realised nominal rates and inflation, as well as distributions of consumption growth (expressed in terms of mean, standard deviation, skewness and kurtosis). I would urge you to read it and make up your own mind whether it says more than real policy rates are very low and equity returns are very strong in periods following economic busts. I think that it does.
How is this linked to thinking about the current state of monetary policy? Importantly, Vlieghe’s Finance Theory of the ERR doesn’t actually help define where the ERR might be, ex ante. But one of the things he associates with high or low ERR regimes is the change in the stock of household credit. If households are deleveraging, chances are that you are in a low ERR regime, and even an ultra-low nominal Bank Rate might not be very far below the ERR. But if households are releveraging, maybe you’re moving *out* of a low ERR regime, and Bank Rate might be very far below the ERR.
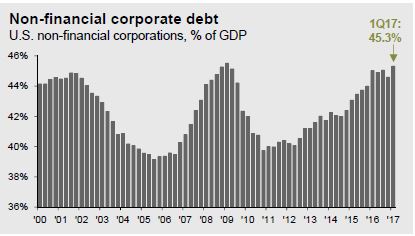
What is the state of financial leverage today? JPM Asset Management reported that corporate leverage is already approaching levels seen at the height of the last cycle.
While the household sector had been deleveraging since the GFC, the latest figures show that debt service ratios are starting to move up. The state of household balance sheets is changing from a tailwind to a headwind.
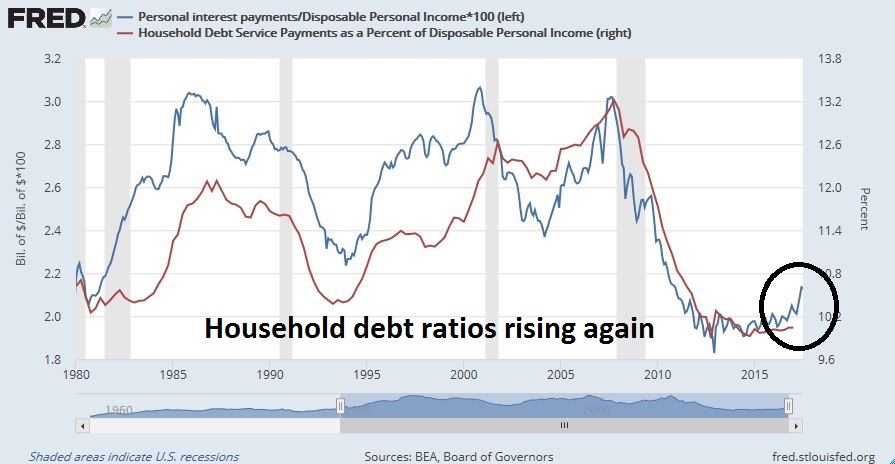
In other words, the risk of central banking policy errors are high when rising financial leverage is combined with tight monetary policy.
A more hawkish post-Yellen Fed?
Bloomberg recently reported that most of the candidates to replace Janet Yellen as Fed chair are Republicans who favor rules based approaches to the conduct of monetary policy. Already, there is a significant disconnect between market expectations and the Fed’s own projections of monetary policy under a rules based regime.
The Cleveland Fed offers a tool that calculates the Fed Funds target using the Taylor Rule using a variety of inputs. While this tool shows wide ranges for interest rates under different assumptions, the current median projection for 3Q 2018 is 2.24%.
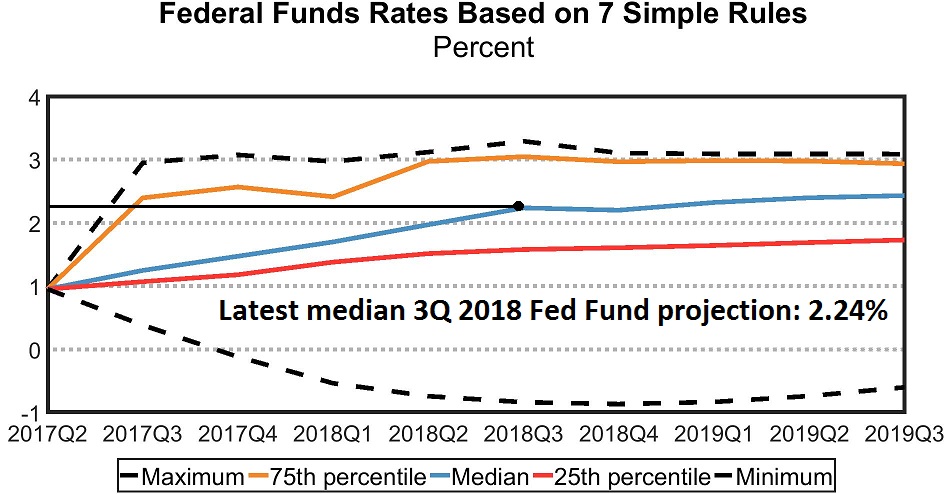
By contrast, here are the latest market expectations of Fed Funds for the August 2018 FOMC meeting. You have to squint to see the implied probability of a 2.24% Fed Fund rate.

You see the problem here. The markets would freak out if the consensus suddenly shifts to a 100 basis point hike in the next year. Even the current more dovish “dot plot” is projecting a 0.75% increase in the Fed Funds rate, which is well above market expectations.
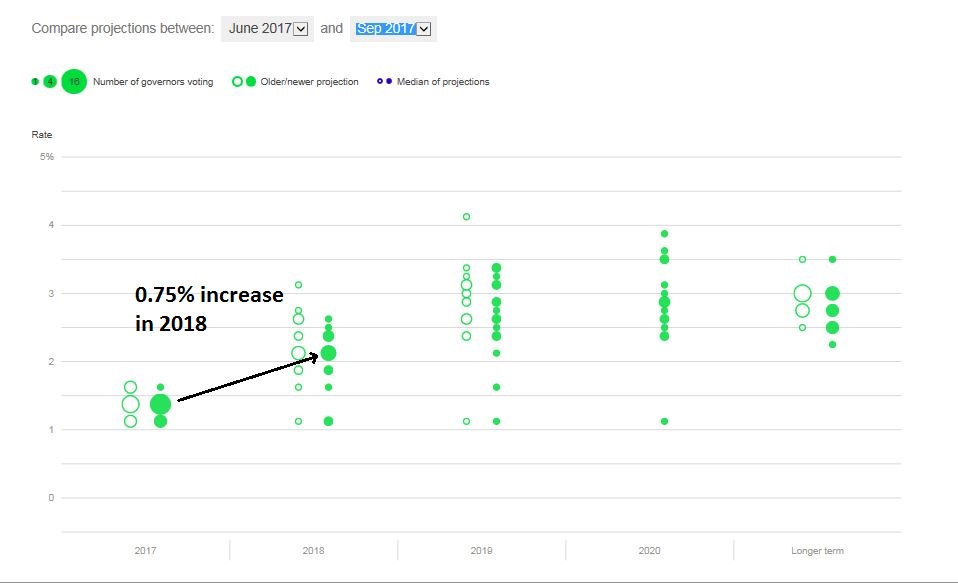
The credit markets need to be prepared for a nasty surprise in the days ahead.
Near term turbulence ahead
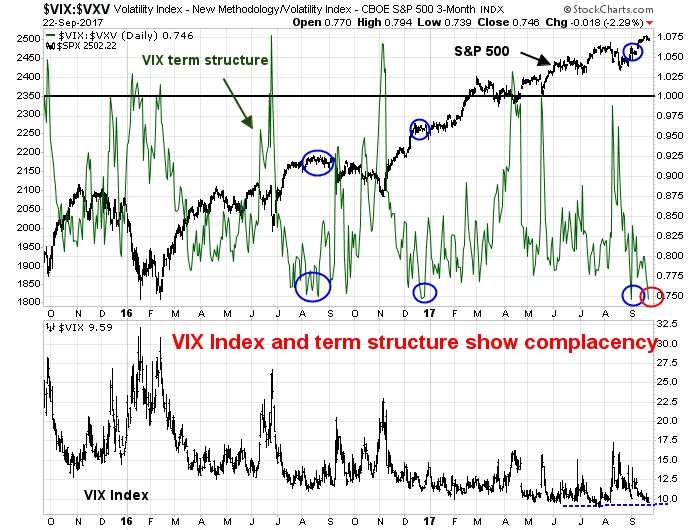
Looking to next week, the short term trend favors the bears. Both the VIX Index and its term structure are showing signs of complacency. While I have never been a big fan of using the absolute value of the VIX as a market timing device, past complacent readings of VIX term structure has seen the market either stall out or stage minor pullbacks.
The current sentiment backdrop is especially disturbing as the market seems to stopped responding to good news. Stock prices barely budged when Senate Republicans came to an agreement for a $1.5 trillion tax cut over the next 10 years. Wasn’t this the tax cut that investors had been waiting for with bated breath since the election of Donald Trump?
As a result, my bearish tactical outlook outlined in my last post (see NAAIM buy signal update) still stands. The Trade Followers sell signal that was generated when all sectors became overbought has historically been a highly effective sell signal. The chart below shows past sell signals, and only one out of five past signals has failed in the past.

In addition, we are in a period of negative seasonality between Rosh Hashanah, which began last Wednesday, and Yom Kippur, which ends this coming Friday. Jeff Hirsch of Almanac Trader found that this period has shown historically poor returns. The Dow has falling a median -0.5% during that period, and only 20 out of 46 episodes showing market gains.

Another possible bearish factor can be seen from earnings estimate revisions. FactSet reported that forward 12-month EPS fell last week. Forward 12-month EPS has historically been a coincidental indicator of stock prices, but the latest reading may be a data blip as FactSet also observed that a record number of companies have issued positive Q3 guidance.

The latest update from Barron’s of insider activity shows that this group of “smart investors” is showing little enthusiasm for equities. While these readings tend to be volatile, the current level of activity is not a great vote of confidence for the stock market.
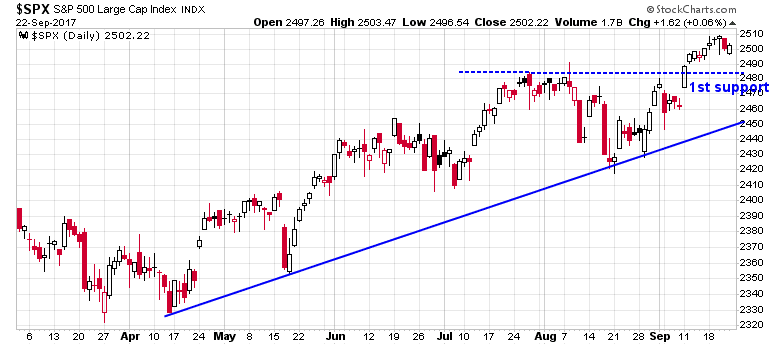
If the market were to weaken next week, then any pullback is likely to be mild. The first technical support level can be found at about 2483, the site of past resistance now turned into support. Should that level fail, there is also trend line support at about 2450.
My inner investor is neutrally positioned in his portfolio, as his equity weight is at his investment policy asset mix target weight. My inner trader remains short the market.
Disclosure: Long SPXU
Cam continues to complain about the risk of potential Fed policy errors “when rising financial leverage is combined with tight monetary policy.”
Some of us complain about past and current Fed policy errors that have directly led to that rising financial leverage as well as excessive equity valuations.
A well telegraphed tightening monetary policy is the best policy to reduce both excessive equity valuations and excessive financial leverage. Does Cam believe the world should live with ZIRP forever?
If Mr. Market ignores the telegraphed signals then Mr. Market shoulders the blame. Traders should position accordingly.
The way I’m hearing Cam’s words is that he is analyzing the incoming data without judgement and the least bias possible. It’s like “Here’s the hand the markets and Fed are dealing us and here’s where the Fed may be heading that is wrong given history.” That doesn’t sound like complaining. I believe he would love to make a pile of money for himself and us by correctly identifying a crash scenario opportunity.
Then he would likely laugh all the way to the bank while he commented on the folly of the Fed’s dumb action to cause the crash.
Sentimentrader.com had an excellent post this week on the Citigroup Economic Surprise Index (ESI). They split the index between surprises in the portion tracking sentiment data and hard economic data. Seems that recently the index has been rising only because of sentiment data. The hard economic data is still surprising on the downside. They did a chart of the spread between the two and found that when the spread is this wide with the hard data weaker, going forward the stock market does poorly and the bond market does well. Defensives also do well and this was what kicked me off the fence to switch to some Healthcare which outperforms when the market weakens.
If the hard data surprises are stronger than sentiment, stocks do better and bonds worse. This all makes sense.
The current situation in the Surprise Index speaks to Dalio’s worry that we are nearing a 1937-type inflection point where the Fed tightens too much as the economy is too fragile and in today’s case also overly indebted. People (including Fed people) may perceive economic strength when the real data is weakening.
Follow up to last week:
Here is a chart of performance of the 11 GICS Industry groups since the last sentiment low August 18.
https://product.datastream.com/dscharting/gateway.aspx?guid=9b34f6dd-14df-4193-830f-d6312289a015&action=REFRESH
This is how I monitor leadership as described in my book. I call it LLLL (Leaders or Laggards from Last Low)
Note the extreme shift in leadership following the Fed meeting. Interest sensitives down big time.
Keep the chart URL link and check how this interactive chart is progressing. It updates automatically every night. Ain’t technology great!
Question about Non-financial corporate debt.
Does the market climb a wall of debt?
Both micro- and small-caps have been performing very well since mid-Sep. It seems the market is betting on a successful legislation on tax cuts, if not tax reform, after the failure of many attempts to repeal & replace Obamacare. I wonder if that tailwind of tax cuts alone will over-power many other headwinds Cam has outlined in his recent posts.
10 pm, US EST: It would be wise at this juncture to pay attention to what is happening to the politics of tax cuts. President’s and establishment candidate has just lost the Senate elections in Alabama (for the seat vacated by Attorney General Jeff Sessions). This will weaken President’s support further in the senate. Repeal and replace Obama care is also in the rear window, as I write this. What are the odds of a successful tax cuts (short of expanding the debt limit, and borrowing and paying for the tax cuts)? Janet Yellen sent a strange signal today of backing off from tightening monetary policy further (?). What is happening in Alabama, as I write this is pretty serious. Republican party is showing further cracks. The stock market is presuming tax cuts, an almost a one sided (long only) bet. Perhaps it may be time to start to batten the hatches.