Preface: Explaining our market timing models
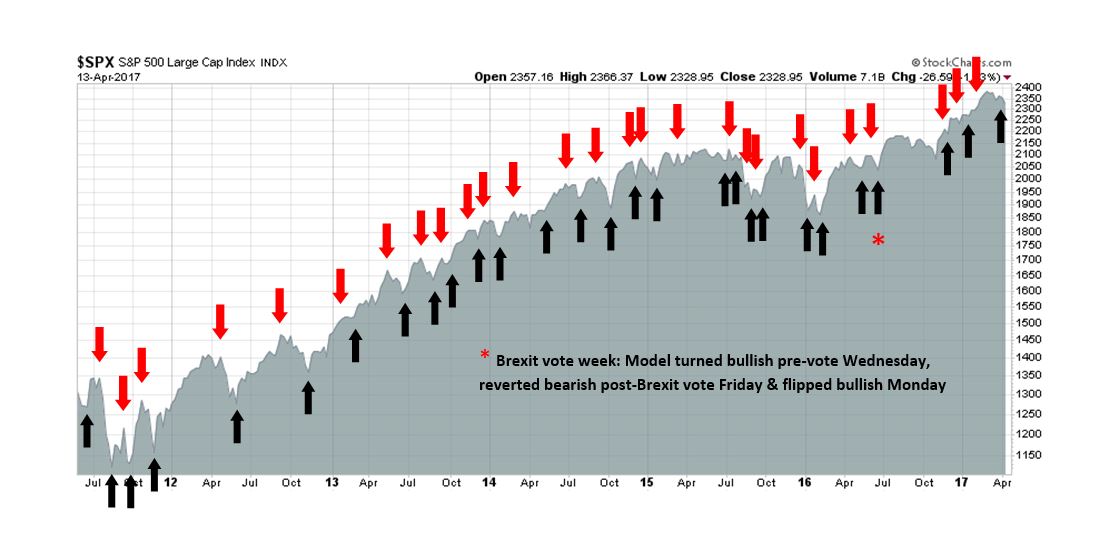
We maintain several market timing models, each with differing time horizons. The “Ultimate Market Timing Model” is a long-term market timing model based on the research outlined in our post, Building the ultimate market timing model. This model tends to generate only a handful of signals each decade.
The Trend Model is an asset allocation model which applies trend following principles based on the inputs of global stock and commodity price. This model has a shorter time horizon and tends to turn over about 4-6 times a year. In essence, it seeks to answer the question, “Is the trend in the global economy expansion (bullish) or contraction (bearish)?”
My inner trader uses the trading component of the Trend Model to look for changes in the direction of the main Trend Model signal. A bullish Trend Model signal that gets less bullish is a trading “sell” signal. Conversely, a bearish Trend Model signal that gets less bearish is a trading “buy” signal. The history of actual out-of-sample (not backtested) signals of the trading model are shown by the arrows in the chart below. Past trading of the trading model has shown turnover rates of about 200% per month.
The latest signals of each model are as follows:
- Ultimate market timing model: Buy equities
- Trend Model signal: Risk-on
- Trading model: Bullish
Update schedule: I generally update model readings on my site on weekends and tweet mid-week observations at @humblestudent. Subscribers will also receive email notices of any changes in my trading portfolio.
Measuring the Trump effect
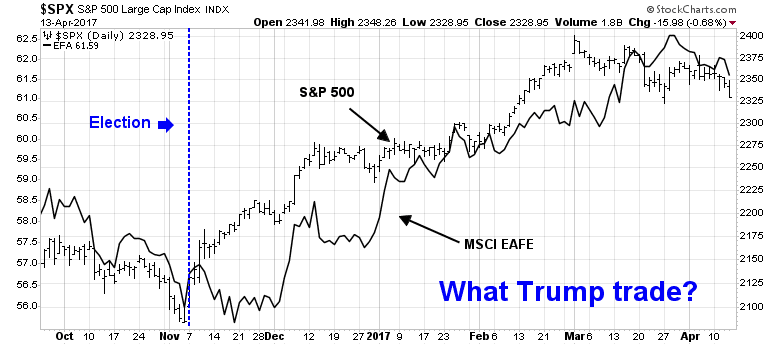
Stock prices have been on a tear since the US election last November. While analysts have attributed the rally to a Trump effect, the chart below shows the SPX and international stocks, as measured by MSCI EAFE, during that period. Both asset classes have performed roughly in line with each other. This indicates the lack of a pronounced Trump effect as the outlook for non-US stocks should not be affected by the prospect of Trump tax cuts and deregulation. The main reason for equity strength was a broad based global growth recovery.
Since taking office, the Trump White House has been seized by legislative paralysis. Consider Exhibit A, the repeal failure of ACA, which was a major goal of candidate Trump. The new administration has struggled to find its footing in the business of governing. The Washington Post reported that, of the 553 positions requiring Senate confirmation, 478 have not even been chosen, such as the three vacant board seats at the Federal Reserve. CNN reported that Trump still has about 2000 vacancies to fill – and that includes the ones that do not require Senate confirmation.
To be sure, Trump stated in a recent interview with Fox News that he does not intend to fill “unnecessary” posts in an effort to cut down on government. For now, many parts of the US federal government is running on autopilot. However, with no ambassadors in place in South Korea, China, or Japan, and an unfilled post of the Assistant Secretary of State for East Asia, the recent crisis, or near-crisis, over North Korea highlights the vulnerabilities of a slimmed down government.
Still, a government on autopilot makes market analysis an easier task. You just have to focus on the fundamentals. For now, the fundamentals remain positive.
Global growth is alive and well
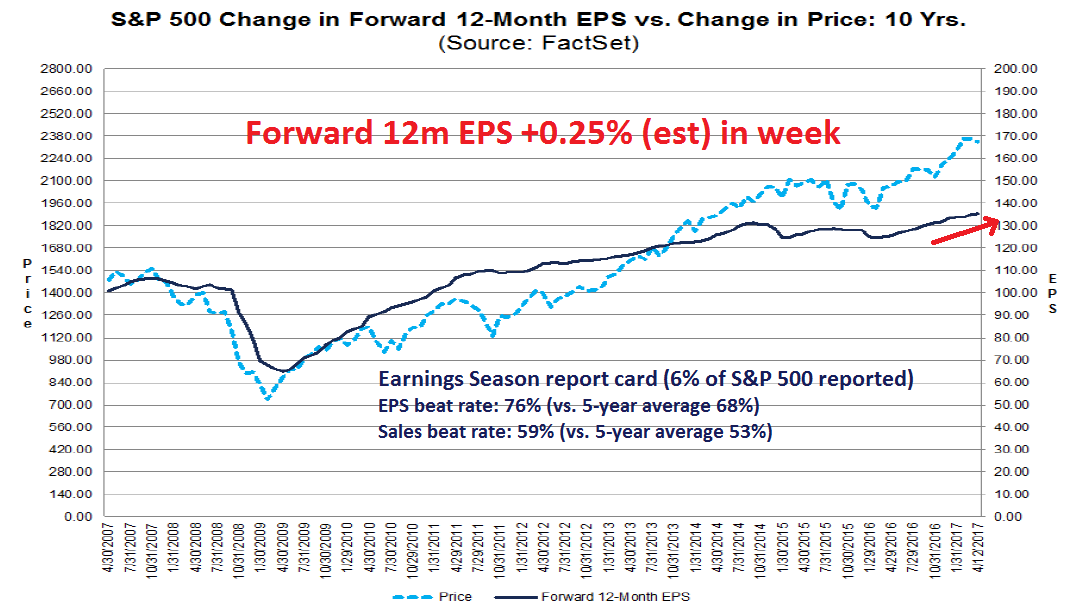
One of the principal drivers of stock prices is the earnings outlook, and the early indications from Q1 Earnings Season looks upbeat. The latest update from Factset shows that only 6% of SPX components have reported, but both the EPS and sales beat rates are above their 5-year historical averages (and that was before Thursday’s beats from major banks). More importantly, forward 12-month EPS continue to get revised upwards, which is reflective of Wall Street’s optimism (chart annotations are mine, data from Factset).
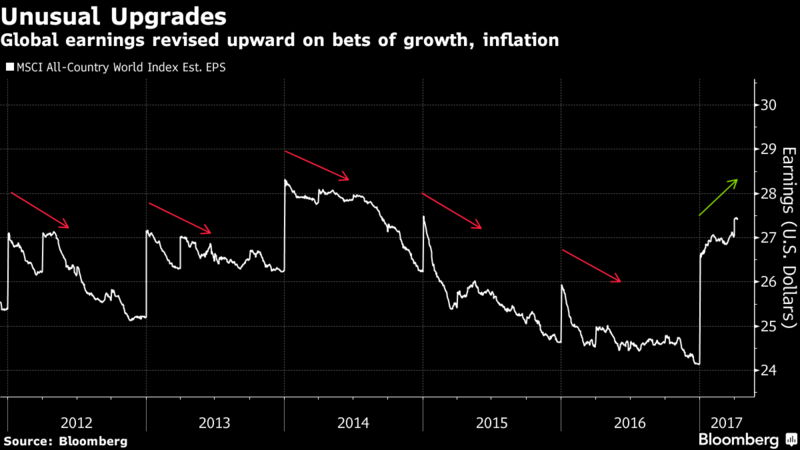
The upgrades in earnings estimates are not just restricted to the US. Bloomberg highlighted a report from JP Morgan that earnings estimates are being revised upwards globally. This is unusual situation as analysts tend to estimate EPS for a fiscal year high, and then revise downwards as time progresses. This time, 2017 EPS estimates are rising on a global basis.
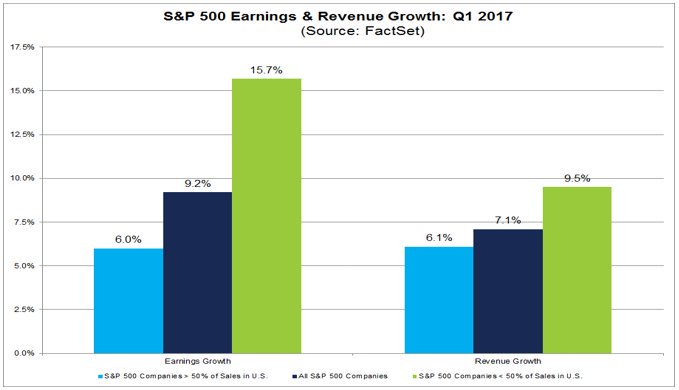
Here is further evidence of the global growth resurgence. Analysis from Factset shows that companies with more foreign exposure are expected to show better sales and earnings growth.
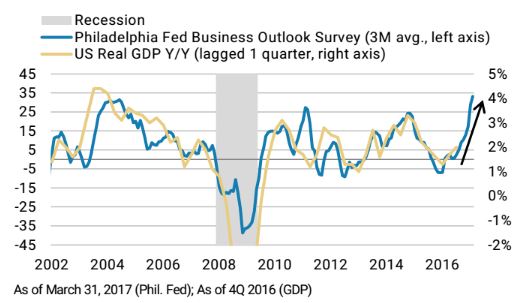
Marketwatch also reported last week that Morgan Stanley is forecasting another 15% upside potential in SPX from renewed growth. Morgan Stanley analysts, led by Michael Wilson, observed that the Philly Fed Survey tends to lead GDP growth. Current readings are pointing to a growth surge later this year.
Growth is alive and well. The party is still going strongly.
Widespread signs of fear
If I told you that earnings estimates were rising, not just in the US but globally, and bond yields fell, what would you expect stock prices to do? Instead of rising, equity prices have been weakening. Even though the SPX is less than 3% off its all-time high, widespread fear has crept into the market.
The Trifecta Bottom Spotting Model flashed an exacta buy signal on Thursday, which is indicative of market panic. The chart below shows the signals from this model in the last three years, with exacta signals shown in blue and trifecta signals shown in red. In the past, such occurrences have generally marked low risk entry points on the long side.

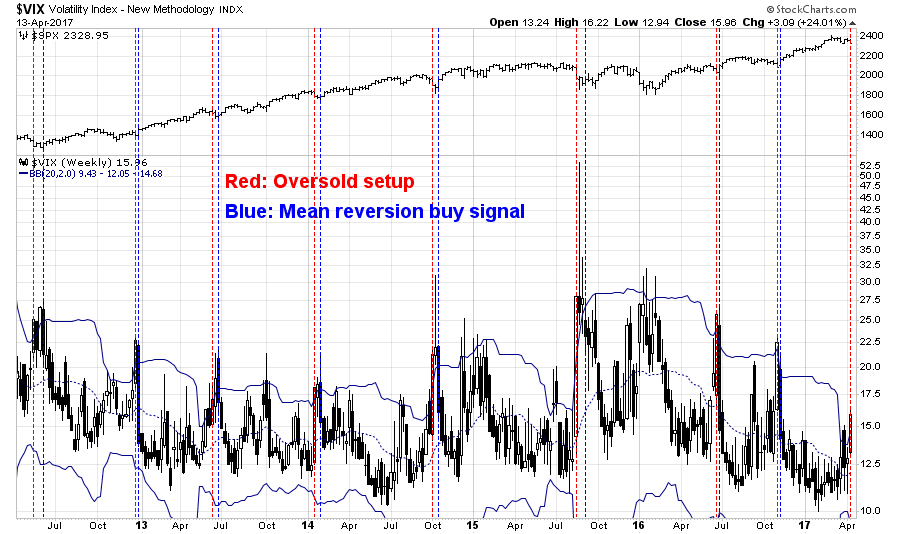
Last week, I wrote about the VIX Index rising above its upper Bollinger Band (BB), which indicated an oversold condition (see A capitulation bottom?).

In fact, we have the unusual condition where the VIX Index has risen above its weekly upper BB. The chart below shows past episodes trading setups where VIX has risen above its upper BB (red line), and when mean reversion occurred (blue line). All buy signals have seen positive returns.
Thursday also saw a relatively rare condition where the CBOE equity-only put/call ratio spike to 0.96, which is indicative of high fear.

I went back to October 2003, which is when the CPCE data series began in my database. Past episodes of high CPCE levels and the daily VIX Index above its upper BB (N=18) have tended to resolve bullishly.

Seasonal tailwinds
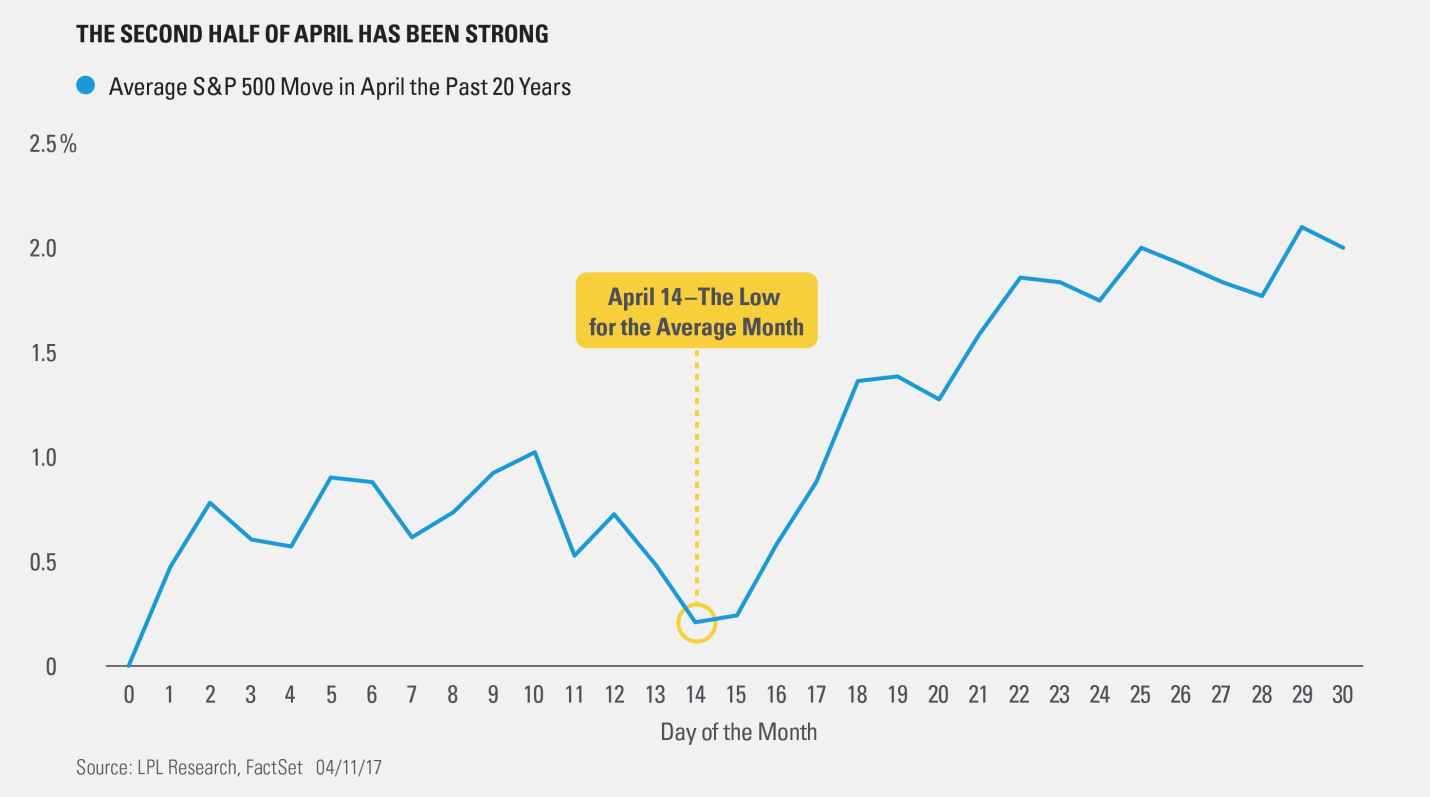
If evidence of excessive fear isn’t enough for the bulls, the market is entering a period of positive seasonality. Ryan Detrick pointed out that the second half of April tends to be favorable for stock prices and the market just reached the seasonal nadir on April 14.
In addition, next week is option expiry week. Rob Hanna at Quantifiable Edges observed that April OpEx tends to be highly favorable for stock prices.

The week ahead: BTFD
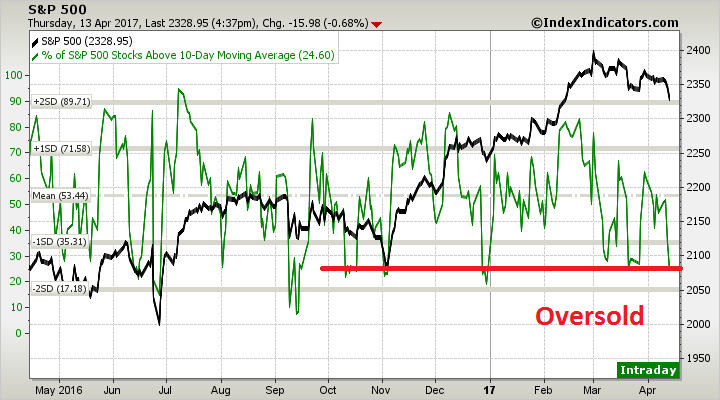
Looking to the week ahead, the market is obviously very oversold and due for a relief rally. Breadth metrics from Index Indicators are showing oversold conditions consistent with trading bottoms.
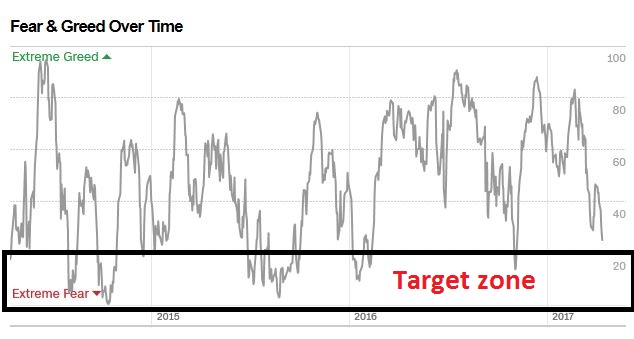
However, oversold markets can get more oversold. There are hints that there may be further short-term downside early in the week before a durable bottom is reached. Firstly, past episodes of CPCE spikes have seen 1-2 days of downside follow through before the actual trading bottom (see above CPCE chart). As well, the Fear and Greed Index has not fallen to sub-20 levels where the market has bottomed in the past. The current reading of 25 is close, but the market may need a final flush.
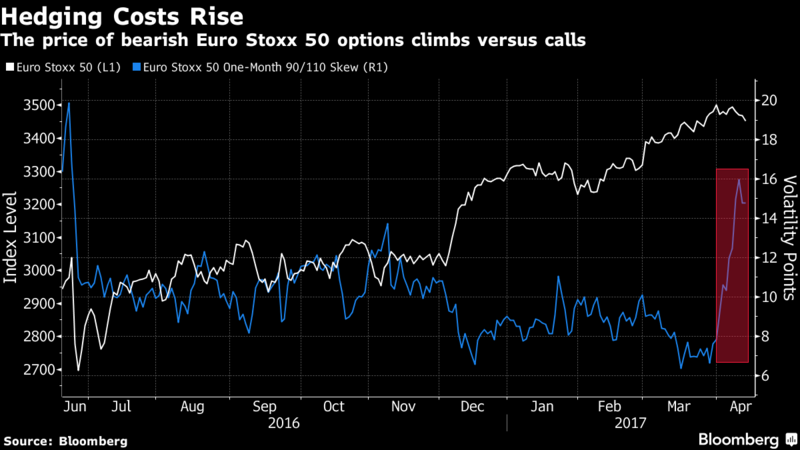
Market nervousness may not necessarily subside next week because of the uncertainties posed by the upcoming first round of French elections on April 24. As the chart below shows, hedging costs for the Euro STOXX 50 has recently spiked.
My inner investor remains bullishly positioned. He is inwardly smiling at the silliness of the emotional extremes when the market has only corrected by 3%.
My inner trader remains long equities. Should the market fall further, he is prepared to take the unusual step of going all-in on the long side.
Disclosure: Long SPXL, TQQQ
This time i agree.The sell off on Thursday was in part due possible turmoil in North Korea over a 3 day weekend.My own analysis is in line with yours & i expect decent earnings,with a positive market response ….SPY 236.5 upside target for this week.I am long SPY calls & short OTM SPY puts.
According to pivots, VIX 15.99 is the level to watch. Holding there on daily close Friday gives the stock bounce the better shot. I bought SPY calls too on 4/13 close, though had trimmed my stock ETF exposure after 4/5.
ps, Thursday 4/13 not Friday.
My book entitled ‘The Pathway … Your money in a changing world’ is now available on my website http://www.thepathway.ca Price = $50 Canadian (about $38 U.S.) Kindle versions through Amazon.
The forty-page book is about my improved Momentum-style strategy that fixes some key flaws, namely when NOT to use Momentum.
Most importantly, I provide you the chart tools to do momentum investing. A critical companion report to the book contains over 500 Momentum charts of country, style, industry and sub-industry ETFs as well as the top ten companies in many of them. These are dynamically linked charts that update every day. Amazing new technology! Here are links to the chart report. I give you these to look at and use for a month. Pick either the U.S. or Canadian version. When prompted for a user name and password, it’s humblestudent and 1234. The LLLL charts (Leader or Laggard since Last Low) are my favorites since they show current market leadership. Last Low was Trump election day.
American Version: https://view.protectedpdf.com/SignIn/V7Pubb
Canadian Version: https://view.protectedpdf.com/3DA4bm
When the report pops up on your browser, just add it to your favorites or copy it to an email to yourself to save and use whenever. To learn how to use them, buy the book.
I’m among the ten finalists for the Portfolio Manager of the Year Award in Canada due to this strategy. My client portfolios were up 23.6% (25% in $US) in 2016. Cam’s newsletter was a big help too.
Thanks for the update and the links. Looks interesting!
N Korea will blow over but equities will only rally as they start to become convinced Le Pen or Melenchon are not going to win, too early for that yet.
Equities in a bull mkt normally only sell off when they are beset by 3 worries, and we have 3 currently, France, N Korea and the FED.
This is a great point, “This indicates the lack of a pronounced Trump effect as the outlook for non-US stocks should not be affected by the prospect of Trump tax cuts and deregulation. The main reason for equity strength was a broad based global growth recovery.”, which has been widely overlooked by some very good economic/market watchers.