Mid-week market update: Regular readers know that I have been bullish on the commodity and reflation trade (see A possible generational low in oil and energy stocks and The road to a 2016 market top). On the weekend, I postulated three separate short-term scenarios for the stock market (see *Sigh* Another growth scare):
- The growth scare recedes and the market pushes upwards to test and possibly exceed the all-time highs;
- The growth scare continues, which results in a choppy range-bound market; or
- The growth scare intensifies and the market breaks support, with a measured SPX target of 1970-1980.
It seems that circumstances are converging towards scenario 2 and 3. It`s time to make a call to take trading profits in both the long SPX and commodity positions. The combination of excessive market positioning and weakness in China are raising red flags, from the viewpoints of cross-asset and inter-market analysis.
Crowded long and short positions
Macro Man recently pointed out that the market positioning in the USD, which is inversely related to commodity prices, and gold are at extreme levels. The CFTC Commitment of Traders report shows that large speculators, which are mainly hedge funds, were in a crowded short in the USD and crowded long in gold. It was only a matter of time before a catalyst came along for these positions to get unwound.

Blame China!
In this case, the tipping point came from a reversal of inflows into the Chinese commodity market. As Bloomberg reports, the combination of poor fundamentals and the Chinese authorities acting quickly to clamp down on excessive speculation in the commodity markets led to a downdraft in iron ore.

In a separate report detailing the trading frenzy, Bloomberg noted that the typical holding period for some commodity contracts is as low as three hours.

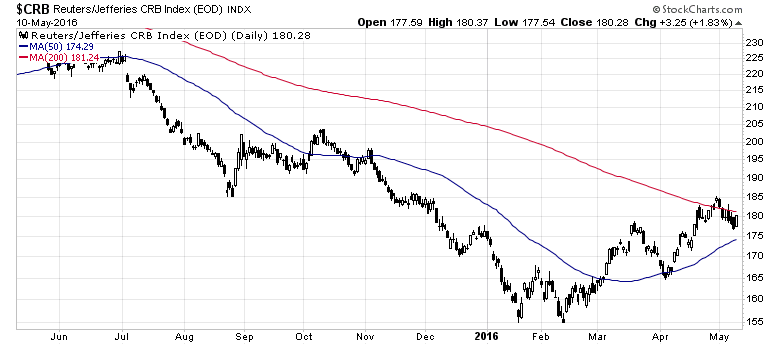
When the USD firmed in the last week, the carnage spread to industrial metals, which violated both its 50 and 200 dma.

The broader CRB Index fell below its 50 dma but remains above its 200 dma.
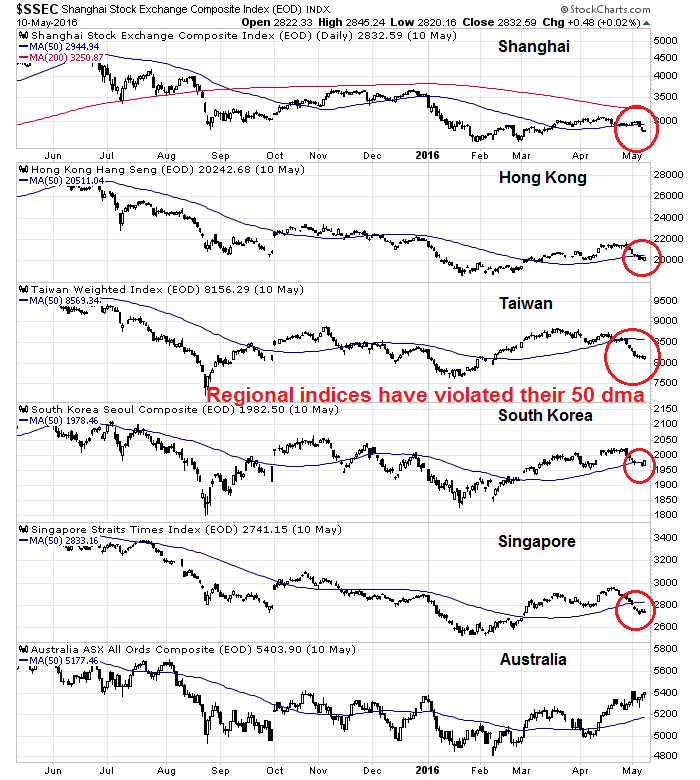
If the damage had just been limited to the currency and commodity markets, my inner trader wouldn’t be so worried. However, the Chinese slowdown scare has become evident in the regional stock indices of China’s major Asian trading partners. As the chart below shows, every single regional index has fallen below its 50 dma, with the exception of Australia, which has further downside risk because of its sensitivity to bulk commodities.
Putting it all together, this paints a picture of exhausted reflationary bulls and ascendant equity bears.
Intermediate bull case intact
I want to underline my case that the intermediate bull case for equities and the reflation trade remains intact. It’s just time to take a breather. A high in SPX of 2400 or more is still within reach (see How the SP 500 could get to 2400 this year), based on the combination of better earnings and a modest expansion in PE multiples.
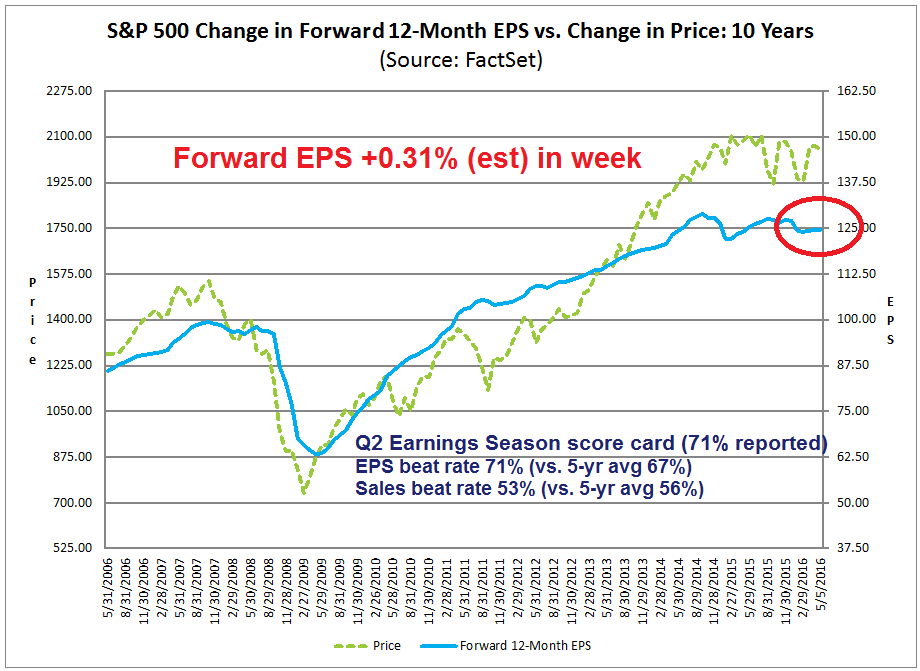
Forward looking fundamentals continue to be constructive for equities. The latest update from John Butters of Factset shows that forward 12-month EPS continues to rise, which is supportive of equity strength.
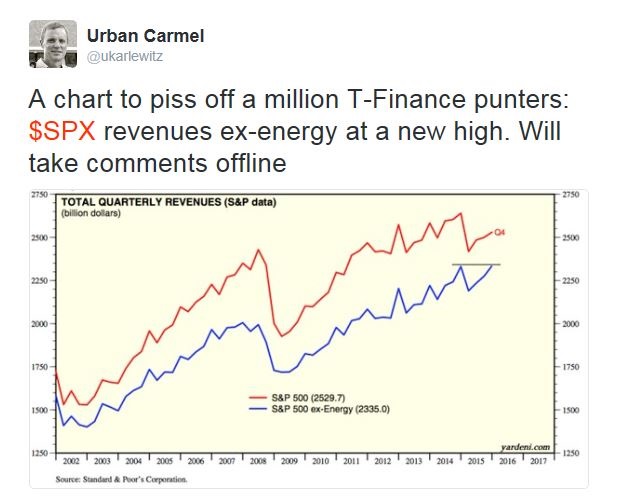
In addition, Urban Carmel pointed out that SPX sales ex-energy actually made a new high. As we progress through 2016 and sales and earnings declines from Energy and Materials get “less bad”, overall sales and EPS gains will not be difficult to achieve.
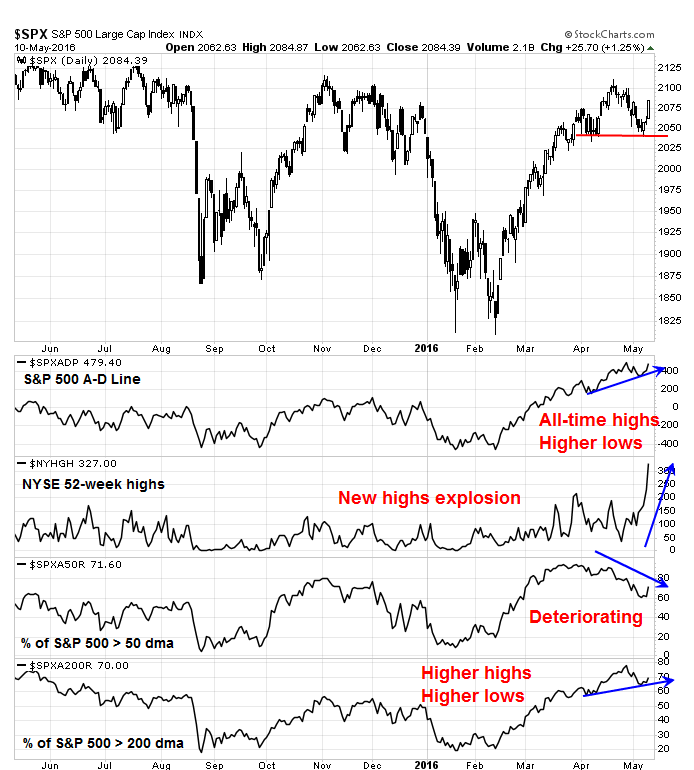
Breadth indicators also suggest that the downside in equity prices is limited. The SPX Advance-Decline Line, NYSE 52-week highs and % of stocks above the 200 dma, which an intermediate term breadth metric, are showing patterns of higher highs and higher lows. However, the % of stocks above the 50 dma is weak, which indicates that the market is undergoing a period of consolidation or correction. In other words, the intermediate term outlook is bullish, but brace for short-term choppiness.
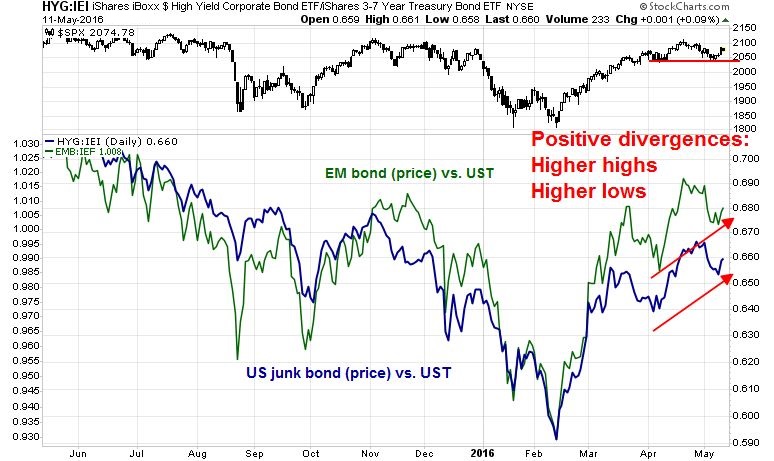
The message from the bond market is also comforting for equity bulls. The relative price performance of both the US junk bond and the emerging market bond market are also showing patterns of higher highs and high lows, which is also bullish for risk appetite.
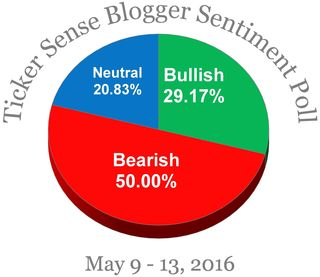
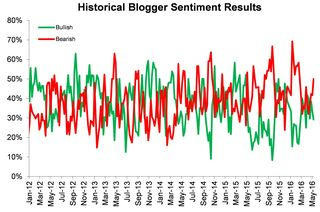
I would also like to reiterate the message that sentiment is likely to put a floor on stock prices. I have pointed out repeatedly that sentiment models show that there are just too many bears and not enough bulls (as example see Mark Hulbert’s HNNSI). The latest readings from the TickerSense Blogger Sentiment Poll is further evidence of excessive bearishness. Major downlegs simply do not start with sentiment readings at these levels.
The road ahead
My Trend Model applies cross-asset, or inter-market, analysis principles of global equity and commodity markets to derive its buy and sell signals. In this case, the intermediate term uptrend is intact, but the tactical trading signal has turned negative.
We`ve had a good run in the reflation trade, it`s time to book some profits (see A possible generational low in oil and energy stocks).

My inner investor remains long equities, with an overweight position in resource stocks, as he is less concerned about these minor blips in the market.
I tweeted that my inner trader has sold out his long equity positions and taken a small short on SPX. He anticipates that the market will be choppy and range-bound in the near term, with a downside target at the 50 dma of about 2050. If that support is broken, the SPX is unlikely to break the 200 dma support at about 2010.
Disclosure: Long SPXU
If I hear you right, you are still intermediate long commodity sector but just sold the short term commodity position?
Cam– I also am unclear about this move. Did you sell out any positions in precious metals as part of this trade? Thank you!
I actually don’t have any precious metals positions. However, if I did, I would take profits as I believe the near-term risk/reward ratio to be unfavorable.
I do have some energy in my investment account and I am not taking any action with those positions.
Cam – It still seems to me that the forward EPS estimate that appears to be stable or very slightly rising (the seventh chart) is largely the result of declining shares outstanding due to share buybacks which reduce the float. If share buybacks were at historically ‘normal’ levels then the EPS would be declining. There have also been numerous articles lately claiming that non-GAAP earnings have become increasingly unrealistic over the last year. Do you find these claims justified or are they overstated (like the earnings!)?
Forward EPS (also earnings) are rising because:
1) Energy and other resource extraction earnings are getting “less bad”, so we are seeing better “growth” YoY
2) Weak USD is boosting the margins of multi-nationals doing business overseas