Explaining our market timing models
We maintain several market timing models, each with differing time horizons. The “Ultimate Market Timing Model” is a long-term market timing model based on research outlined in our post Building the ultimate market timing model. This model tends to generate only a handful of signals each decade.
The Trend Model is an asset allocation model which applies trend following principles based on the inputs of global stock and commodity price. This model has a shorter time horizon and tends to turn over about 4-6 times a year. In essence, it seeks to answer the question, “Is the trend in the global economy expansion (bullish) or contraction (bearish)?”
My inner trader uses the trading component of the Trend Model seeks to answer the question, “Is the trend getting better (bullish) or worse (bearish)?” The history of actual out-of-sample (not backtested) signals of the trading model are shown by the arrows in the chart below. Past trading of this model has shown turnover rates of about 200% per month.
The signals of each model are as follows:
- Ultimate market timing model: Buy equities
- Trend Model signal: Risk-on
- Trading model: Bullish
Update schedule: I generally update model readings on my site on weekends and tweet any changes during the week at @humblestudent. Subscribers will also receive email notices of any changes in my trading portfolio.
How the USD tells us about the stock market
I have been asked in the past to describe my brand of market analysis, which can be characterized in a number of ways. Technicians would call my approach inter-market analysis. Fundamentally driven investors may regard me as a global macro or cross-asset analyst. That`s because all markets are inter-connected and to simply focus at any single stock, sector or market in isolation misses the big picture. Analyzing different components of the big picture also allows me to write about topics as diverse as the US equity market, the term structure of the VIX Index (see Sell Rosh Hashanah?), Europe (see The costs of Spain’s astounding recovery: Bug or feature?) and China (see Big Trouble with 5-year China).
To illustrate my point, I would like to show why I believe that the US Dollar holds the key to the medium term outlook (6-12 months) for US equities. As the chart below shows, the Trade Weighted Dollar has seen a clear breach of an uptrend line, which has bullish implications for equity bulls.
How the USD affects everything
Here is why the trend breach is important. USD direction affects a lot of economic and market conditions. For one thing, Dollar weakness raises inflationary expectations. As the currency weakens, the prices of imports rise, which is inflationary. The chart below shows how the Dollar is inversely correlated with 5 year x 5 year forward measures of inflationary expectations (note the inverted scale on inflationary expectations in the chart).
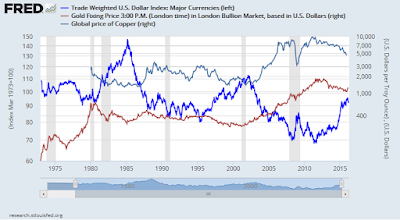
Another proxy for inflation and inflationary expectations are commodity prices. The Trade Weighted Dollar (dark blue line) has displayed a broad inverse correlation to gold and copper prices in the last few decades.
Currency strength has also been shown to be inversely correlated to industrial production. As the USD rises, it makes American manufacturing less competitive and therefore industrial production comes under pressure. Here is a chart of the USD and ISM-Manufacturing, which is a forward looking measure of industrial production (note inverted scale for ISM).
A USD tailwind for earnings growth
The USD was on a tear in 2015. More recently, its strength has moderated. We heard repeatedly from companies last year about how the strong Dollar has depressed earnings. It was none other than Zero Hedge that trumpeted the negative effects of USD strength last October (I guess we won`t be hearing from them about the bullish effects of currency weakness).
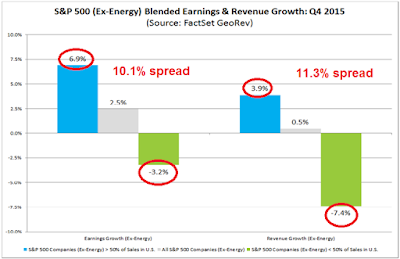
John Butters of Factset also quantified the effects of USD strength with the following chart (annotations in red are mine). For Q4 2015, he found roughly a 10-11% spread in earnings and revenue growth between domestic companies and exporters.
Now that the greenback has started to fall, we are seeing the initial Street reaction to currency weakness. John Butters` latest update of the earnings expectations shows that the consensus forward 12-month EPS is rising again. That’s because a double tailwind is helping earnings growth. The first comes from the positive translation effects of a weaker USD on the earnings of multi-nationals. As well, the inverse correlation between the USD and commodity prices is also likely to spur cautious optimism in the highly depressed energy and mining sectors.
Fed policy and the USD
In discussions about the USD, the question of US monetary policy always comes up. What about the Fed? Won`t rising US rates push the Dollar up? After all, 10-year Treasuries are yielding 1.9% while 10-year Bunds are only at 0.2%.
The flip side of the interest rate differential coin is the inflation differential. Consider the following thought experiment: Would you rather lend money to the US Treasury for 10 years at 1.9%, or some other sovereign country in its own currency at 15%, but its inflation rate is 12%?
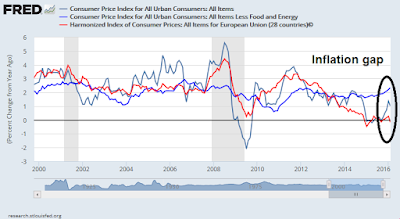
Currency traders recognize that US inflation is rising, while the rest of the world is still struggling with deflation. The chart below shows the CPI differential between the US and the European Union. US inflation is ticking up, while European inflation is non-existent. Similarly, the latest report shows Japanese inflation was flat in February.
While a rising interest rate differential is supportive of USD strength, a rising inflation rate differential weakens the Dollar. Notwithstanding the weak USD effects on inflationary expectations and commodity prices, which I showed in previous charts, we are starting to see signs of cost-push inflation. Indeed, Torsten Slok at Deutsche Bank pointed out that the US labor market recovery is broadening out (via Business Insider). Can wage inflation be that far behind?
The latest update from the Atlanta Fed’s Hourly Wage Tracker shows that wage inflation is rising. The latest reading of 3.2% is well above the Fed’s stated 2% inflation target.
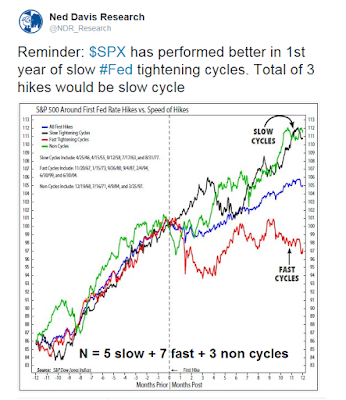
As a result, the USD may continue to weaken, despite the Fed`s initiation of a tightening cycle. Analysis from Ned Davis Research shows that the stock market tends to perform well when the Fed is in a slow or non (e.g., once and done) tightening cycle.
Eagle-eyed readers will discern from the above chart that we are entering the fourth month of a slow tightening cycle, when equities have historically corrected. I read that pattern with a healthy dose of skepticism for a couple of reasons. First, the sample size is small (N=5). In addition, the current stock market price experience doesn’t really conform to past history. Equities recently corrected and they have only begun to recover because of a recession scare. Arguably, that was the correction seen in the historical charts – it was just early.
History doesn’t repeat, it rhymes.
A USD counter-trend rally?
Having established a bearish medium term (6-12 month) outlook for the USD and therefore a bullish outlook for US equities, the logical conclusion from this analysis is to buy sectors and industries that benefit the most from USD weakness. That’s why I have advocated overweight positions in late-cycle groups such as capital goods and natural resource extraction, which benefit from rising inflationary expectations (see RIP Correction. Inflationary resurrection next?).
Peering into next week, we have to allow for the possibility of a retracement rally of recent USD weakness. Under such a scenario, equity prices could see further pullbacks.
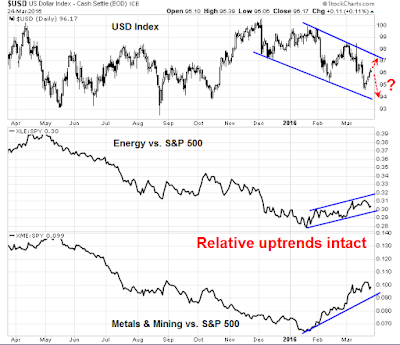
Here is what I am watching. The top panel of the chart below shows the USD Index, which has already staged a counter-trend rally within a descending channel. The relative performance of resource extraction sectors like energy and mining shows that their relative uptrends to be intact. Until any of these channels break, either for the USD or the relative performance of energy and mining, I am inclined to give the equity bull case the benefit of the doubt. I interpret the market action last week to be equity consolidation in an uptrend unless proven otherwise (see A shallow pullback?).
Chartists should also note that the current advance is seeing broad participation from breadth indicators, The chart below shows that while the SPX has not exceeded its November and December highs, the SPX A-D Line, the % bullish indicator and % of stocks above the 200 dma have all made higher highs. This represents three separate and independent instances of positive breadth divergences.
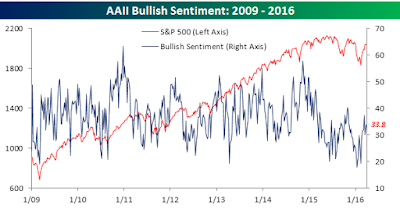
Further, Todd Salamone at Schaeffer’s Research also found that when the survey of AAII bulls dip from below 30% (bearish sentiment) and rebounds, the results have tended to be equity bullish for the next 2-4 weeks. This study sample size is small, so take the conclusions with a grain of salt.
Along the same lines as Salamone, analysis from Ryan Detrick is also supportive of the medium term bull case. Detrick found that powerful momentum thrusts like we have experienced, where the market goes from an extreme oversold to overbought readings in two months, tend to be resolved bullishly (with the caveat that the sample size is also very small):
[I]t is rare to see stocks move from extremely oversold to overbought in two months like we just did. Going back to the percentage of stocks above their 50-day moving average, the number moved from below 10% to more than 90% in two months. Going back to 1990, that has only happened three other times, and the S+P 500 results after this occurs are rather strong. In other words, moving to extremely overbought could be a sign of impending strength, not weakness.
I would point out that while AAII bulls have moved off oversold extremes, readings are still below average and nowhere near crowded long levels (via Bespoke):
In fact, Joe Fahmy noted that, at an anecdotal level, he isn’t find a lot of bulls. These sentiment readings are raises the possibility for a FOMO (Fear Of Missing Out) rally as we approach quarter-end next week.
1) I spoke to many potential investors around mid to late February, telling them I was getting back in the market. 100% of them were still scared. Now when I talk to them, they say “no way am I going to jump in at these levels!” Hey, sometimes you just can’t help people.
2) Let’s move on to the institutional people I talk to who manage $2B or more in assets. Many are still underinvested, and some have the biggest net-short positions they’ve ever had.
3) When looking at the major Wall Street strategists, the average 2016 year-end SP 500 target is 2150. That’s only +5.5% away. So, when I say “No One Is Bullish,” I mean almost no one is calling for a +10-20% gain from here.
The one wild-card for the markets comes in the form of the upcoming Employment Report, which could prove to be a source of near-term market volatility. Should jobs gains come in higher than expectations, it would raise the odds of rate hikes, which would put upward pressure on the USD and therefore downward pressure on stock prices.
My inner investor remains long the market, with an overweight position in resource extraction stocks. My inner trader bought into the market last week and he is looking to add to his long positions on weakness (see A shallow pullback?).
Disclosure: Long SPXL






Wage inflation is a big scare with unemployment so low. Economists have been predicting an upsurge for a year and yet wage gains are surprisingly staying around a tame 2%. Rosenberg mentions a report that shows this has been caused by older workers retiring and being replaced by lower wage workers. They expected future tame wage gains that would not hurt margins.
Last December when the Fed moved up on rates for the first time in nine years, markets predicted 4 increases this year. That would have sent the U.S. soaring. The Fed knew this would be a huge drag on their economy so did not raise in March even though many of their economic targets were reached to justify a hike in rates. So a very big YES in watching the dollar to predict how Fed rate decisions will go and how U.S. stock markets will follow.
Before last year, the Fed never mentioned the world economic scene in their decisions. Their mandate was strictly internal U.S., employment and inflation. The U.S. Treasury handled foreign exchange and global economic viewpoints. This has changed. All Central Bankers are trying to steer their respective economies within the globe with their very blunt tools and their governments practicing austerity. So they feel they are the arm of government that can stimulate to boost underachieving growth. Foreign exchange manipulation is one of their less blunt tools. They will use it to the hilt.
Welcome to the Moonless world economy and stock markets. The ‘slow tightening’ mentioned above is a sure thing. Expect no resistance from Central Bankers to this new bull market for as long as the eye can see.
Always appreciate your insightful comments, Ken.