I’ve been meaning to write on this topic but I hadn’t gotten around to it. For several weeks, I have seen warnings about deteriorating earnings quality. The gap between corporate earnings as defined by Generally Accepted Accounting Principles (GAAP) and operating earnings (earnings without the special bad stuff) has been widening to levels not seen since the last market crash.
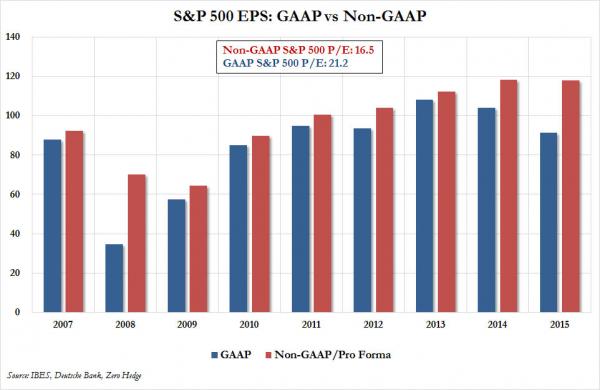
Here is a chart from Zero Hedge which showed that the gap between GAAP and Non-GAAP earnings is at its worst since 2008.
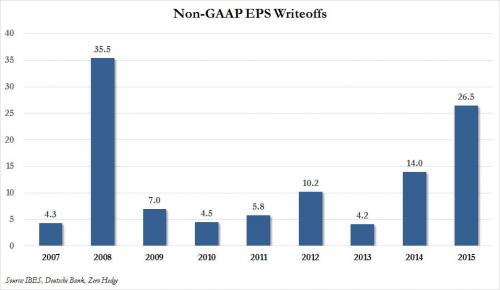
The level of write-offs are absolutely horrendous.
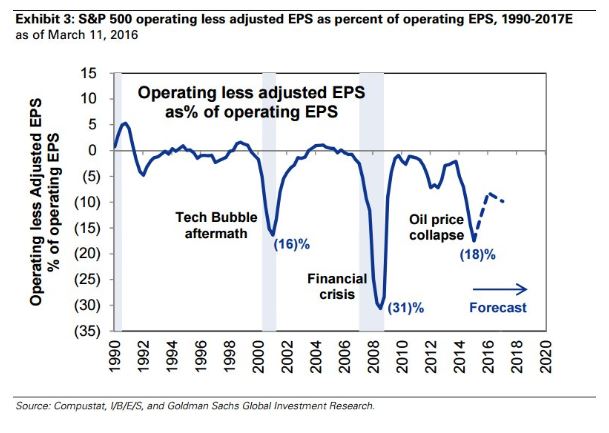
On the other hand, this chart from Goldman Sachs is suggestive that these earnings “gaps” occur at the height of bear markets. If we are already through the worst of these writeoffs, could such a development be actually equity bullish?
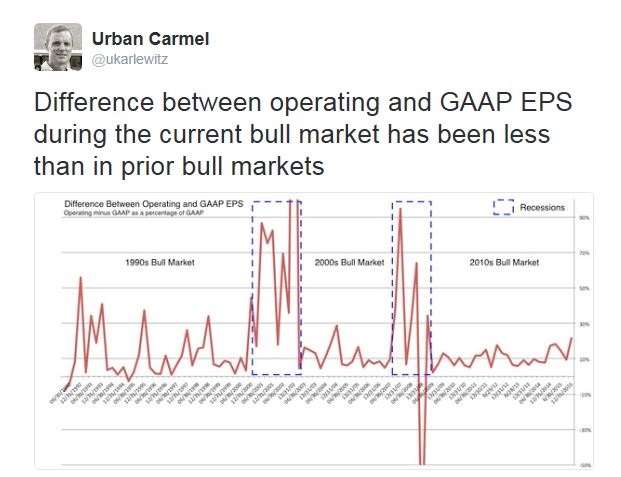
Urban Carmel also pointed out that outside of recessions, the “GAAP gap” actually isn’t that bad on a historical basis.
Interpreting the GAAP earnings quality gap is like the Rorschach inkblot test. Bullish or bearish? What`s the real story?
The difference between GAAP and Non-GAAP earnings
To try and answer that question, let’s start with the distinguishing difference between GAAP and operating, or Non-GAAP, earnings. Ed Yardeni explains:
GAAP rules are highly conservative. US public companies are required to report on EPS in their financial statements based on Generally Accepted Accounting Principles (GAAP). In short, GAAP earnings are fully loaded with all income statement line items pertinent to the reporting periods. Even when a judgment call exists, GAAP accountants will lean towards the outcome that reveals the least amount of profit. That’s because accountants are trained to follow the principle of conservatism in accordance with GAAP.
Public companies report on several variations of EPS. Those include basic and diluted EPS based on total net income, or loss, with further subdivision by continuing and discontinued operations.
There are some very legitimate reasons for excluding certain items when evaluating an earnings report. Supposing a company experienced a one-time event, such as the gains or losses from selling an operation, or legal settlements such as BP`s $20.7 billion payment over its 2010 Gulf of Mexico oil spill . A comparison of GAAP earnings between periods is not very meaningful because of the unusual or extraordinary nature of the one-time gain or loss. That’s why analysts focus on (Non-GAAP) operating earnings for comparability purposes. On the flip side, this “operating earnings” loophole is subject to abuse by corporate management:
“Unusual” exclusions are usually not GAAP. Public companies typically want to demonstrate the best view of their results to investors, and so may wish to exclude (or include) items considered “unusual” in nature from their EPS calculations. Any such related financial measures would be considered non-GAAP. It’s no surprise that non-GAAP measures tend to be more favorable than GAAP as it tends to be more conservative. In a 2014 note, SP’s Senior Index Analyst, Howard Silverblatt, quipped: “[D]uring difficult times, the term ‘unusual’ appears to be used more liberally [by companies].”
Note that to avoid misleading investors, the SEC requires that any non-GAAP financial measures are presented and also reconciled against the most directly comparable GAAP measure.
A narrow “GAAP gap”
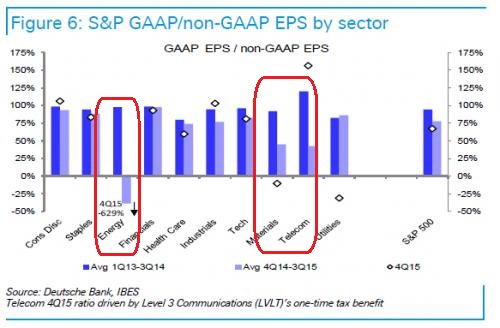
In the current instance, much of the “GAAP gap” is attributable to narrowly based writeoffs in a few sectors. Zero Hedge documented the writeoffs by sector in the chart below (annotations in red are mine). Most of the writeoffs were concentrated in energy and materials. There was a significant discrepancy in telecom, which can be explained by a one-time tax benefit at a single company, Level 3 Communications (LVLT).
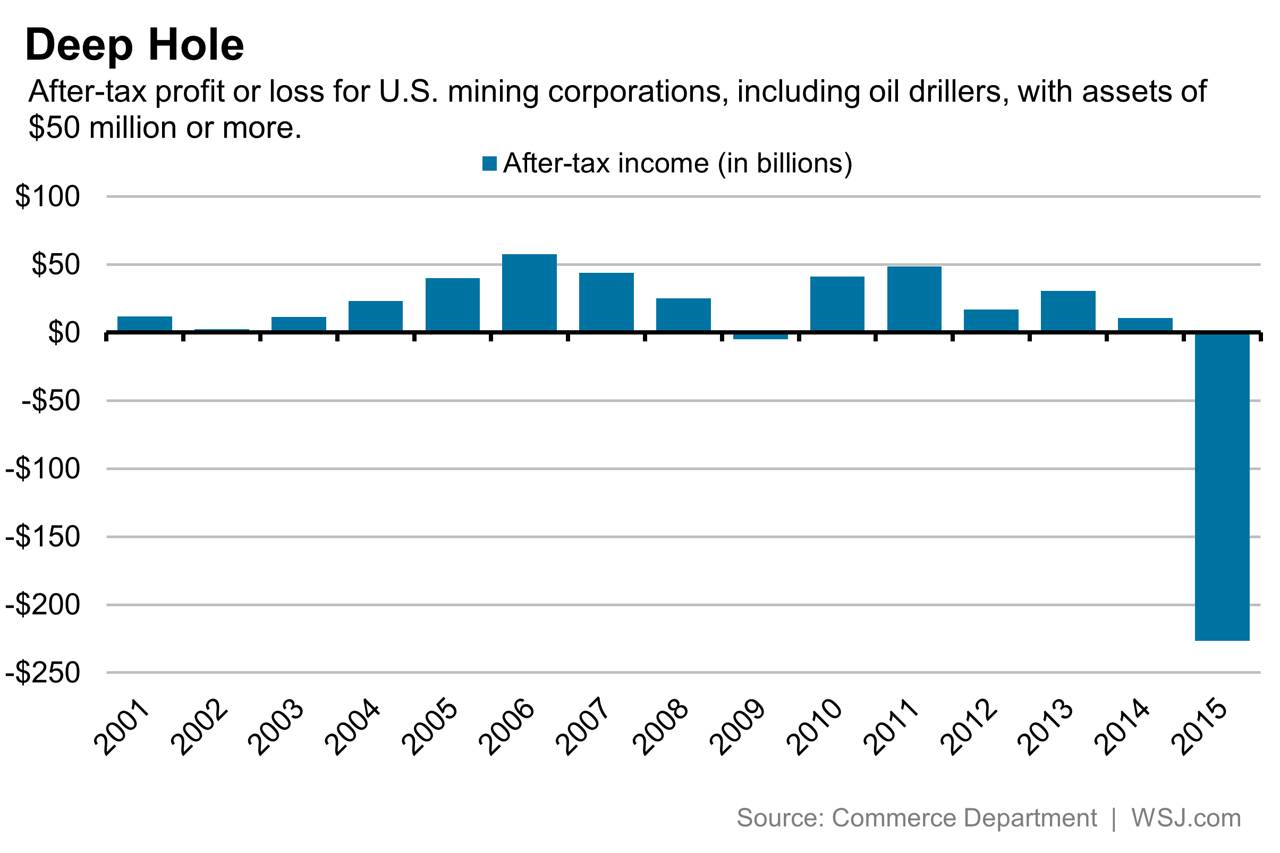
As commodity prices have tanked badly in the 2015, it is no surprise that resource extraction companies have chosen to write down underperforming and uneconomic mines and oilfields. Indeed, the WSJ reported that the losses made by mining companies (which includes oil drillers) wiped out all of their cumulative profits since 2007.
The narrowness of the writeoffs also brings up more color to a concern that I saw some analysts make on the weekend. The latest Q4 GDP report showed that corporate profits are starting to roll over (red line below), which could represent an early warning of impending economic slowdown. However, proprietors` income (blue line below), which is a more timely and closely correlated data series, is still showing robust growth.
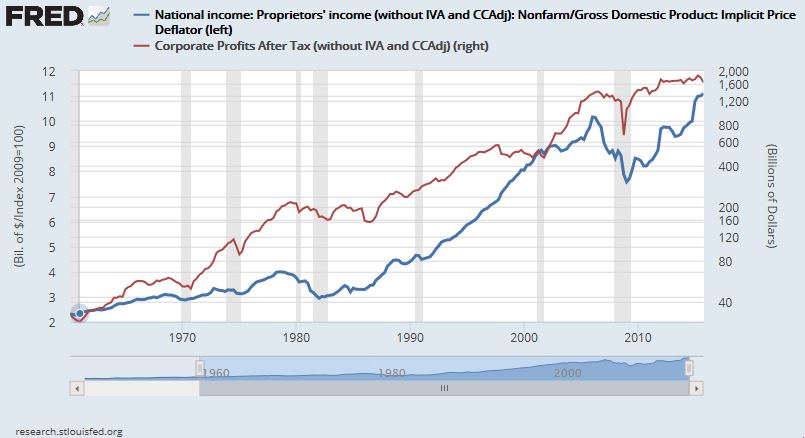
I interpret the narrowness of the earnings writeoffs as the weakness in corporate profits is not broadly based and therefore near-term recession risk remains low. In fact, the current episode is somewhat reminiscent of the oil price plunge of 1986, when corporate profits fell, but proprietors’ income stayed healthy and the economy continued to grow.

Let’s go back to the Rorschbach inkblot test. How worried should you be about deteriorating earnings quality?
This is another example of sectors on different economic and stock market cycles making the overall index viewpoint meaningless. Look at the sectors that are holding the S&P 500 up, consumer, health, IT. They have little spread between earnings methods. Materiaks and energy are huge. Asset writedowns of mines and oil wells are understandibly huge when the price of commodities they produce drops so much.
In the past before the Moonless world all sectors would be falling together in a general recession and a general bear market. That’s because in the past commodities would have been falling due to a Central Bank caused recession and a drop in demand. But commodities are not falling because of a recession. It overproduction. So no recession, no general bear market.
One other thought. I have been investing in commodity companies in Canada since Moby Dick was a minnow. I learned that investing based on their profit and loss statements is done exactly the opposite of non-resource. So when the mining or energy index is losing money (infinite PE) and cutting dividends, it’s a buy. When its making big profits (low PE) and raising dividends, its a sell.
This is why I bought the XME mining ETF ON January 21one day after the low for my portfolio clients. I had not bought a mining investment for at least 5 years. It’s up 30%.
It has been easier to see this crazy reverse logic in Canada because we don’t have huge energy companies like Exxon and Chevron that keep making money in the downturns.
So where are we now. Canadian resource companies are a perfect bull market signal in both mining and energy because both sectors are losing money as an industry and cutting dividends. Back up the truck.
American commodity stocks have mining index perfect (losing money and cutting dividends) while energy is simply great with most smaller companies losing appropriately large amounts and slashing dividends but those nasty giant companies confuse the picture with their nasty profits.
So for you folks that never invest in commodity stocks (or have and always lose) that is the crazy reverse logic that underlies this area. My suggestion is avoid investing in the area.
This is another reason I believe we are in a general bull market since early this year with resources starting a new bull market and all the consistently profitable industrial sectors continuing their bull markets.