Trend Model signal summary
Trend Model signal: Risk-off (downgrade)
Trading model: Bearish
The Trend Model is an asset allocation model which applies trend following principles based on the inputs of global stock and commodity price. In essence, it seeks to answer the question, “Is the trend in the global economy expansion (bullish) or contraction (bearish)?”
My inner trader uses the trading model component of the Trend Model seeks to answer the question, “Is the trend getting better (bullish) or worse (bearish)?” The history of actual out-of-sample (not backtested) signals of the trading model are shown by the arrows in the chart below.

Update schedule: I generally update Trend Model readings on my blog on weekends and tweet any changes during the week at @humblestudent.
A glass half-full, or half-empty?
Wow! I realize that when I tactically turned negative on stocks last week, this kind of downdraft would happen (see The road to a 2016 market top). Regardless, David Rosenberg had an excellent piece of advice with his “Breakfast with Dave” last week for investors (for traders, it’s another story):
I have three pieces of advice of my own to all the nervous nellies out there, not to mention the nattering nabobs of negativity, turn off the television, focus on the big picture, and review your asset mix.
- Are we facing a war or revolution that will cause the permanent impairment of capital (e.g. Russian revolution, World War II, US Civil War, etc.)?
- Is a recession on the horizon?
- Is the Fed being overly aggressive and tightening the US economy into a recession?
The answer to the first question is obviously no.
I also see minimal risk of a US recession (see my Recession Watch page). Using the framework used by New Deal democrat’s approach of adopting the Geoffrey Moore long leading indicators, recession risk is low. As well, Georg Vrba`s work also comes to a similar conclusion.
As for the third question, the Fed is just starting a tightening cycle and they have made it clear that they plan on being slow and gradual. Moreover, various Federal Reserve officials have indicated that they are tolerant of inflation being slightly over target in order to bring the economy back to full employment. So the Fed can hardly be characterized as being aggressive.
In short, the triggers for a bear market are not there. But what`s spooking the markets? I can summarize the worries as:
- Geopolitics: The North Korean H-bomb test and rising tensions between Saudi Arabia and Iran;
- China; and
- Slowing growth.
North Korea
Saudi Arabia-Iran
China
The biggest scary headlines for the markets last week came from China. But Cullen Roche put the concerns over China into context. Firstly, the Chinese stock market is a big casino dominated by small uninformed retail punters. Moreover, its movements are not very correlated with the US equity prices.

Chinese GDP growth rates are not correlated with US stock prices either.

The biggest worries are stem from Beijing initiating a program of competitive devaluation, to the detriment of her Asian trading partners, or if the Chinese economy unravels into a hard landing.
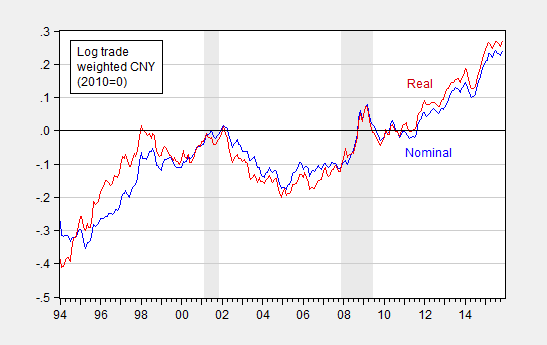
First, while it is true that the offshore yuan (CNHUSD) exchange rate spread against the onshore yuan (CNYUSD) has widened considerably, which is pressuring CNY downwards and thus the risk of whole devaluation is rising, that may be the wrong perspective to take. Menzie Chinn at Econbrowser pointed out that the trade weight yuan has actually been appreciating over the past year so a downward adjustment is not unwarranted at all.
As for the concerns over a slowing Chinese economy, it is difficult to see that Beijing would stand idly by and watch the Chinese economy crater into a hard landing when the PBoC has a lot of ammunition left in its monetary holster. Interest rates are nowhere near zero bound and the reserve ratio (RRR) is still high at 17.5%. If push came to shove, the PBoC also has the option of engaging in quantitative easing (QE).
If the PBoC were to engage in shock-and-awe scale monetary stimulus, however, it would put downward pressure on the yuan, everything else being equal. But everything else isn’t equal, because this kind of policy action would be positive for the growth outlook and therefore yuan bullish.
So is the glass half full or half empty?
Weak growth
The last major worry that seems to be bothering the markets is the prospect of slowing growth. The Atlanta Fed GDPNow nowcast of Q4 growth has fallen to 0.8%.
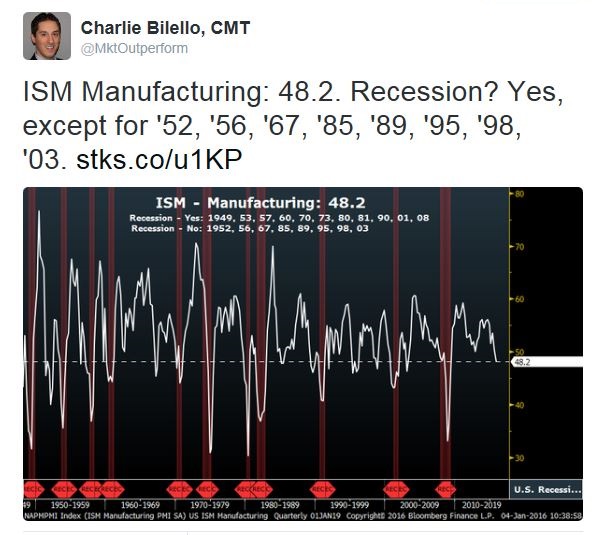
Much of the slowdown has been driven by weakness in manufacturing, as exemplified by the weak ISM Manufacturing release. However, Charlie Bilello pointed out that ISM Manufacturing has had a spotty record of forecasting recessions in the past (also see these comments from David Rosenberg).
My own analysis found that the USD is inversely correlated with ISM (note ISM is shown in an inverted scale in the chart below).

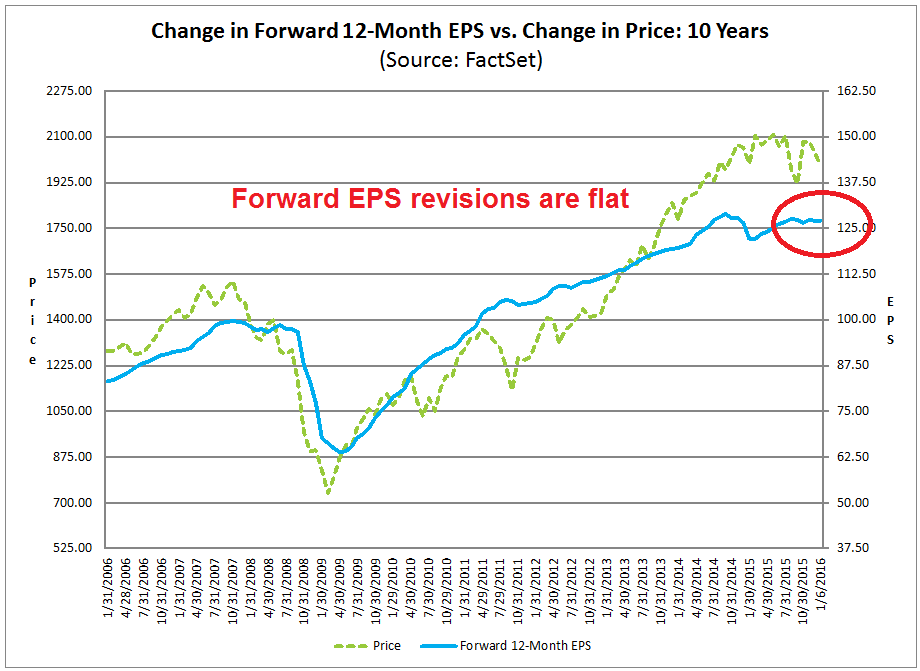
So we are back to the story of a strengthening USD holding back the US economic and profit growth outlook again. Indeed, the latest update from John Butters of Factset shows that forward EPS revisions have been roughly flat in the last few weeks. In short, that may be the main reason spooking stock prices.
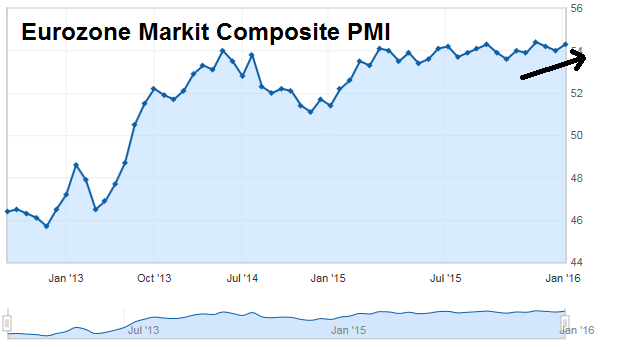
There are a number of reasons to be more optimistic in the next few months. The Dollar is starting to weaken as growth differentials narrow. China is undoubtedly poised to unleash another round of stimulus, which should boost growth rates. The outlook for European growth is also getting better. Eurozone unemployment and confidence have improved to 2011 levels…

and PMIs have been rising as well.
In his weekly monitor of high frequency US economic releases, New Deal democrat is starting to discern an inflection point in growth rates:
The bad news is, the downturn in coincident data is now so drastic that I suspect we are going to get a negative GDP print either for Q4 2015 or Q1 2016. Meanwhile, there are some interesting things happening at the margins of the data. My suspicion is that we are getting close to the longer term bottom in the commodity collapse, and it is interesting that aside from oil, industrial commodities did not make a new low this week. The decline in wholesale inventories is the first sign that a liquidation may be beginning (one reason why I think we may get a negative GDP print). The further big pulse down in rail transport may also be a sign of a beginning of inventory liquidation via a big downturn in new orders (also shown in the ISM manufacturing release). Tax withholding for December wobbled a little bit, and YoY Real M1 decelerated to a new 5 year low. On the other hand, lower mortgage rates will give a little boost to the housing market. I still see this as a global trade driven inventory correction rather than the onset of a recession. Housing permits and Q4 residential investment will be particularly important when they are released later this month.
Putting this all together, I interpret the current stock market environment as corrective and not the start of a major bear market. Corrections happen all the time. Investors shouldn’t be overly worried.
Technically cautious
For traders, it’s a entirely different ball game. I wrote on Monday that while the stock market appeared to be oversold, I expected further downside for the week (see Oversold, but…). What I didn’t expect was the magnitude of the downdraft. On Thursday, I fretted that while short-term indicators were at oversold extremes indicating a bounce was at hand, but I was concerned that signs of fear and capitulation were not fully evident. I concluded that any rally would likely be short-lived (see A tradeable bottom?).
Mark Hulbert came to a similar conclusion. There just isn’t enough fear out there.

Brett Steenbarger also observed that his cycle indicators are not yet at levels seen at intermediate term bottoms yet.

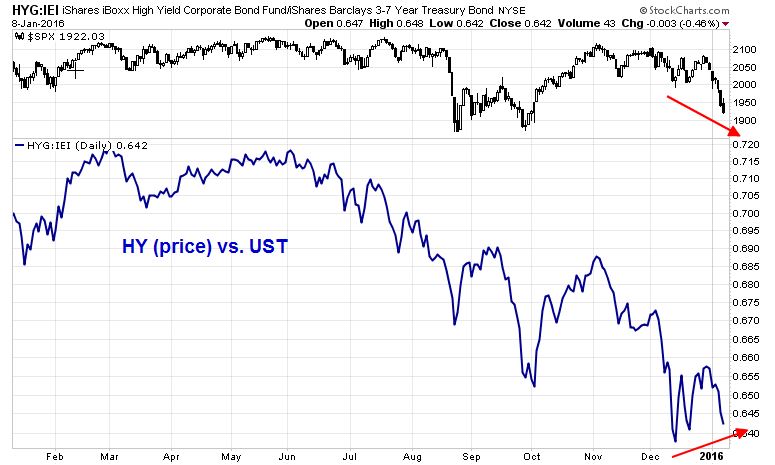
I don’t mean to imply that everything looks bearish as there are some constructive signs for stocks. As an example, the relative performance of junk bonds is actually doing much better an tracing out a positive divergence against stock prices.
As well, the CNN Money Fear and Greed Index is nearing the top of its capitulation zone where durable bottoms have been found in the past.

Based on these readings, two scenarios are in play next week. The stock market could either sell off further into a capitulative sell-off, or the market could stage an oversold rally. The first scenario would represent a durable intermediate term bottom. On the other hand, an oversold rally next week would likely set the stage for a weak rebound, with further weakness into a final panic bottom some time in the near future.
My inner investor remains invested in equities, with a tilt toward natural resource sectors. My inner trader got (painfully) caught long last week. He is waiting to see how the market develops next week. If it does rally, he will be fading strength. On the other hand, he will see further weakness as an opportunity to do some bottom fishing, especially if sentiment readings reach a crowded short extremes.
Disclosure: Long SPXL TNA
” My inner investor remains invested in equities, with a tilt toward natural resource sectors.”
Sorry to sound dense but what exactly does that mean?
Are you invested in them and if so can or will you share your ideas in them ? TIA
Gene
I have two personas and two accounts, an investment (long horizon) account (inner investor) and a trading (short horizoned) account.
The investment account is still long, with and overweight position in natural resource equities.
Of the two scenarios you’ve outlined for next week, how can we spot a “weak rally” with some certainty?
Sorry, there is no certainty in investing. I only play the odds.
I take your disclosure as the position of your inner trader ?
Yes, those positions are from my trading account. My investment account is broadly diversified and the positions don’t change much. I have described them in general terms, but there are no relevant conflicts.
The purpose of the disclosure at the end of the post is to show any possible conflicts that I might have.
The CBOE pull/call ratio is now at 1.34, only slightly below the level on 28 Sep 2015 (1.44). It may reach that level tomorrow (11 Jan 2016, Mon). Can this be an indicator suggesting that we have reached a durable intermediate bottom by Monday? If not, what other indicators would you look at?
I look at a variety of sentiment metrics, the more important of measure how people are putting their money on the line, rather than surveys. Here is the A-list in no particular order:
1) CBOE put-call ratio, equity only and overall
2) ISE call-put ratio
3) VIX term structure
4) Rydex fund flows
5) Insider activity
Here is the B-list of surveys:
1) AAII
2) II
3) BoAML Fund Manager Survey (global institutions)
4) Barrons Big Money poll (quarterly, US institutions)
5) NAAIM (US RIAs)
I may have missed one or two, but those are the main indicators that I watch.
Additions:
A-List: TRIN (when TRIN>2, it usually indicates panic, or forced margin clerk selling)
B-List: CNN Money Fear and Greed Index
The AAII Bullish % is 22. Pessimism is 25. We got to 20 in the autumn of 2015. 22 is plenty low for a bottom.
I strongly recommend sentimenttrader.com as a great source of sentiment indicators in everything. Stocks bonds commodities currencies
Cheap to subscribe and a must have toolkit
Thank you for your vigorous analysis. I presume that you are defining a bear market as a correction that is more then 20% and a recession as two or three quarters of negative growth. I guess it is important to note that the index you use is important. The Dow Jones Transportation Index is down in excess of 20% and the New York Composite Index is down in excess of 15%. Some of the other indices like the S&P mid cap and small cap last week closed below their August lows.
I’d greatly appreciate a column from the inner trader on using / setting stop losses. Your disclosure indicates at least one of the two yous is still long. Does either of your investors use stop losses and if so what are the criteria used for the investor? the trader?
Thanks
It’s difficult for me to define how you place a stop loss. The intent of a stop loss is to say that my call was wrong and the risk-reward equation has changed so I want to be out of my position.
That statement implies some sort of underlying risk-reward estimate of a trade, to which I have no idea. I know nothing about why you entered the trade, the expected upside and downside, probabilities and volatility of your trading system, if you have one.
It would be helpful if you provided specifics based on your long SPXL and TNA position.
Cam, do you follow or read John P. Hussman? I don’t know anything about the guy other than that a few people I follow on Twitter also follow him. He seems to be picking up the recession rhetoric and uses lots of fancy charts regarding valuation, manufacturing data, and other economic metrics to make his case. Sometimes I read his work and think that you and he are saying the same thing — but at other times, maybe not so much.
John P. Hussman is a tragic case. His claim to fame is he went bearish correctly and avoided the 2008 crash. Then when his valuation numbers turned positive at the bottom in 2009, he changed the buy-back-in parameters to “Depression-style” numbers and did not buy back in. He has been out of the market eloquently ever since. His base case is that the Schiller CAPE valuation model is at bubble highs. He then looks for anything elsewhere to bolster the bearish case. He might be right one of these days. A terrible stock market crash and Mad Max style terrible economy might happen. Fortunately for him, he is a young man. We of more mature years on the other hand, will not.
Beginner’s / new subscriber’s question here.
The Trend Model, from my perspective, looks quite actionable, as the black arrows seem to have an excellent track record (perhaps excepting the third-from-latest one). Likewise, the red arrows appear to have a 90%+ hit-to-miss ratio.
I think I understand the inner investor thing. And one’s inner trader: why wouldn’t he/she consider purchasing (leveraged) ETFs whenever a new Trend Model arrow showed up?
Oops I meant to say “trading model”, not “Trend Model”, sorry.
Yes that is a reasonable course of action. I personally use Cam’s trading model to supplement my trading plan, and occasionally I buy the leveraged ETFs. You could also go the volatility route (TVIX / VXX / XIV). Cam provides disclaimers that he is long this or that ETF, and in the past he has been long SPXL, which is a 3x leveraged ETF that tracks the S&P 500.
I would add a caveat that the price chart is a weekly chart using closing prices. Therefore that chart will and does hide a lot of intra-week volatility. Depending on at what price you execute at, your mileage can vary – and very considerably.
As well, you can see that the system isn’t always perfect.
Thanks, everybody!
Tim Duy agrees that a recession is not imminent.
http://economistsview.typepad.com/timduy/2016/01/so-you-think-a-recession-is-imminent-employment-edition.html
Even if things did start to roll over, I think the Fed would be on it pretty quick. There are a lot of Fed members who are uneasy about inflation being as low as it is. If labor markets and/or GDP started to turn over, I think they would immediately stop tightening monetary policy. I suspect it would take relatively high level of pain for the Fed to begin easing again (i.e., QE4), however.