After the market closed yesterday (Wednesday), I tweeted a series of charts indicating that the market appeared to be oversold, but fear levels weren’t extreme yet:
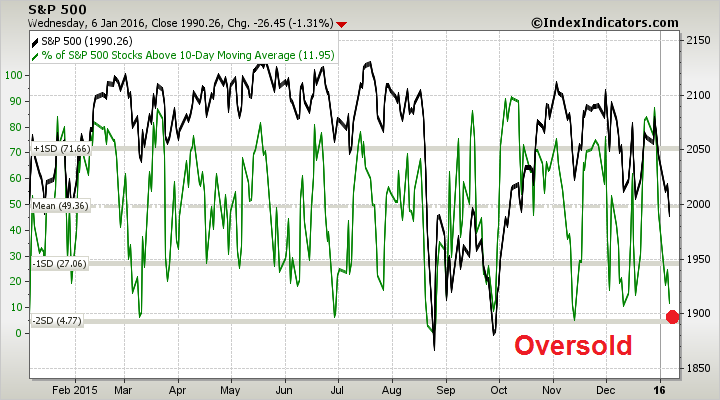
- The market was oversold on % of stocks over the 10 day moving average based on the breadth charts from IndexIndicators;
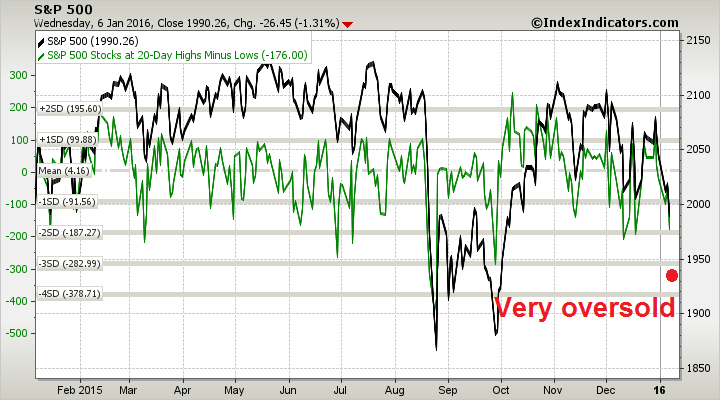
- The market was oversold on net 20 day highs – lows;
- The market was showing a positive RSI divergence on the hourly SPX chart; but…
- The CBOE equity only put/call ratio was only at average levels, which indicated no signs of fear from the option market; and
- My Trifecta Bottom Model was nowhere close to a buy signal (described here), which was another sign of complacency.
I had concluded that a bottom was near, but we may need a further wash-out before a tradeable bottom could be seen. The stock market weakened further on Thursday and a number of fear metrics spiked.
Is the market near a durable bottom?
Extreme oversold readings
It depends on what you mean by “durable” and “tradable”. The market is definitely very oversold and due for a reflex rally. Consider the following breadth metrics from IndexIndicators (red dots are my estimates). Here is the % of stocks above their 10 dma, which is a good overbought/oversold indicator over a 1-3 day time horizon:
Here is the net 20-day highs-lows, which is a OBOS indicator over a 1-2 week horizon:
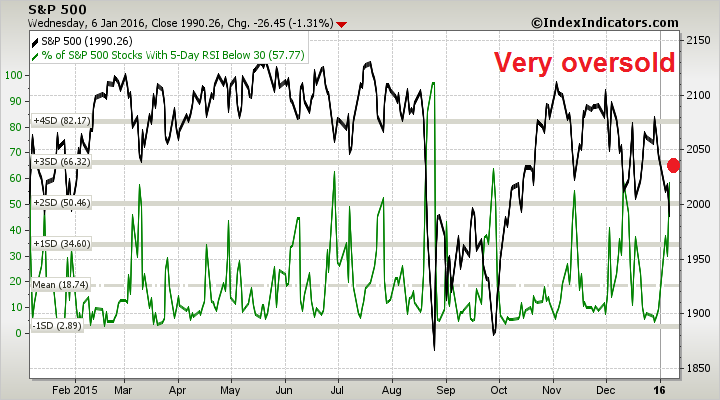
Other breadth measures, such as the % of stocks with RSI less than 30, is also at an oversold extreme:
The stock market should bounce from here, but how far?
Fear rising, but is it enough?
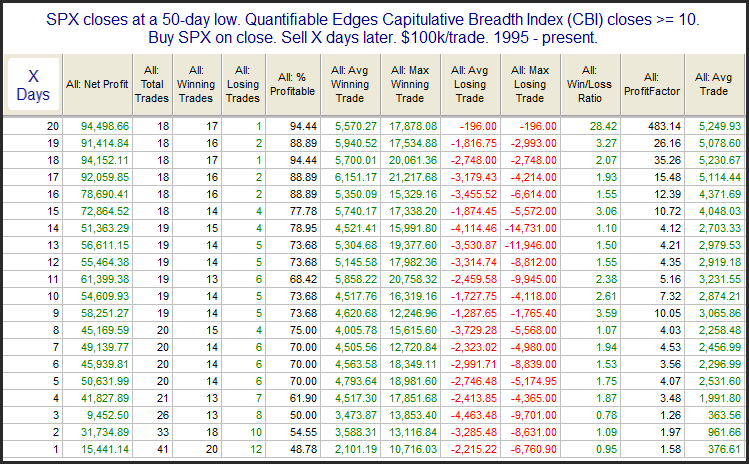
Rob Hanna at Quantifiable Edges expressed similar concerns as I did about the lack of fear. He wrote this morning that he was also seeing the oversold conditions, but he was concerned that his Capitulative Breadth Index (CBI) was only 0, which is a very low reading. He went on to show statistics for past returns when the market was oversold and CBI was 0. The results suggest a very short-term bounce, followed by more weakness.

If CBI were to rise to the 1-5 range, which indicates a higher level of fear, returns improve. After 20 trading days, the average return is 1.5%, which is reasonable, but not tremendously exciting.

Contrast the above results when the market is oversold and CBI is over 10, where the average 20 day return is over 5%.
I don’t know what goes into CBI are, but I can make an educated guess as to what counts for capitulation. Here is the latest CBOE equity only put/call ratio. Readings are elevated but not extreme.

Here is my Trifecta Bottom Model (for description see Sell Rosh Hashanah?), which has had a remarkable record of spotting bottoms in the last three years (blue lines = 2/3 triggered, red lines = 3/3 triggered). The term structure of the VIX was inverted today. The TRIN Index, which shows capitulative selling when readings spike above 2, closed yesterday (Wednesday) at 1.96. So do current readings count as hitting the exacta? Well, kinda, sorta, but the signal is very marginal.

One constructive sign is the VIX Index spiked today to test its December highs. As well, it also rallied about its Bollinger Band, which is usually a sign that a bottom is near.
What to make of all this? My conclusion is that the market is poised for a relief rally. As the signs of capitulation can only be described as marginal, the rally is likely to be relatively weak and near-term market action choppy. The study from Rob Hanna with CBI at the 1-5 range might be a reasonable expectation of returns over the rest of January.
What positions do you hold , if any?
Still holding my long positions in $SPX and $RUT. It’s been painful…
Noticed that Russell 2000 has been underperforming since the start of high yield breakdown in the summer. There are good reasons why they correlate. Smaller firms had cheap high yield financing thrown at them as the junk bubble grew to the summer peak. Going forward, funding smaller firms using junk will be more difficult or impossible.
When I buy a single short ETF hedge sometime this year, it will be RWM.
Thanks -To me this looks more like a sides ways market (2011, 1994, 1990) than a top. Does the Chinese market really say anything about the US economy or even the Chinese economy.
I would tend to agree with you that the action look more corrective than like a bear market. As for China, it depends on how freaked out you are over the possibility of a Chinese devaluation against the USD.
Less inflation!
The Chinese market has 80% public traders with tens of millions of new accounts opened in the last year. Here we have less than 20%. It is the only place they can gamble inside China and they do. This is a frontier market that is mob ruled with rumors and day traders. When they think a daily limit trade stop is coming, they bail in fear. I smile when I see headlines saying the Chinese market went up or down based on some economic number. The media is trying to make sense of this scramble by using the logic that drives the S&P 500. Also, less than 10% of Chinese own a share of stock so plunging markets have very little effect on the economy unlike here. So to say copper and oil are at risk because they have a bear market is silly.
Nice report, Cam. I agree that any bounce from here will probably not be large. But, if the market panics down tomorrow, there will probably be no time to wait for indicators to be updated. Just saying.
I expect a melt-up in markets after this downswing. My reasoning is that the macro backdrop is good (economy and monetary policy) and once this storm is past, investors will look back at the last six months and see a crash low in August, then another in October that did not go below the August low, then a scary bottom in December much higher than August low and now we will have another panicky low holding above the August low. With the August low set up as a very durable base, investors will think they are bullet-proof. Zero percent T-Bills burn a hole in investor pockets and bonds are not good. That leaves stocks when confidence returns.
From a sector perspective, we have commodity stocks so beaten up they can’t go down much more. Freeport is at five bucks down from forty. Kinda late to get negative. If commodity stocks simply stop going down (they may even catch a bid) we have the other sectors with good earnings growth and dividends above the 10 year bond that a more confident investor will buy.
Lastly, the chances of a March Fed rate increase has fallen to about 35%. If they don’t raise rates, the stock market will go nuts. All the bears that think four rate hikes in 2016 are in the cards will have their heads handed to them.
Besides these measures what else is different in this selling vs what we saw in August ’15? I mean is there any particular sectors and/or stocks that are being sold more/less this time around? That could provide an insight into why we’re seeing this calculated proactive selling rather than the fear based reactive selling we saw in August ’15.
I also wonder if Chinese are selling their global holdings as they can’t sell their Chinese holdings (circuit breakers) to manage down their overall leverage. Also the USD strength (which you’ve talked about before) in this rally is worrisome because that could severely limit US firms export revenues and profits in 2016.
Just the facts Ma am
https://www.youtube.com/watch?v=Dj6UEQoXHSo
In trading/investing as in poker you play the hand that you have been dealt with not the one you wish you had or the one you hope you will have.
The facts are:
1. There was tremendous resistance at 1950 – 1970 on the SPY and the market did not go through it to make a new high instead broke down sharply. 6 very sharp down days is not good.
2. The 10 week moving average is below the 40,45 and 65 week moving average. By an statistical measure that is defined as a down trend.
3. Cam has pointed out we should have a short term rally.
4. The quality of the rally and how far it retraces the down move will tell us whether this a garden time 5-10% correction or the start of something big.
5. Anything beyond that is pure conjecture (bull market or bear market) and an exercise in in self aggrandizement.
Gold has recently got a bid. Historically, gold has had an inverse relationship to the dollar (though not all the time). With the recent downtrend in the stock market, the interest futures market is sensing that the Federal Reserve will either have to reverse its policy of raising interest rates or it is “one and done”. If that is the case, the best the dollar will be able to do is to go down or sideways. Therefore, the multinationals might be O.K.. We will just have to watch their relative strength going forward.
Your thoughts Cam?
Hi Cam, another loosing day (instead of dead cat bounce)? I hope that markets will not be -7% on Monday :-(.
The Chinese market on Friday opened around 3200, fell to 3050 and closed qt 3200 (no change). One wonders how much the market would have fallen had there been no intervention from the Chinese government. There are no circuit breakers any more and I would like see if the Chinese market would have waterfall type correction on monday.
The 3200 is also a decent support in the Chinese index and a fall below that level would be breach of a significant support level.
The VIX index is only in the mid 20s (26.x). It is not showing significant pain, FWIW. The US stock market had a pretty volatile day on friday, with a sharp sell off in the last half hour.
It would be really interesting to see what happens on Sunday night in the futures markets as China opens. It appears as though there is still not enough fear in the market, based on VIX index still only in the mid 20s (would like to see past 30),
The Chinese stock market is dominated by small uniformed retail players, many of whom don’t have a high school education. Why should we obsess over a market with the characteristics of the pink sheets in the US?
Cam
do you think that are creating a scenario like the one that took place at ‘ the beginning of 2008 ? Tom McLellan wrote an article about it . Americans Index seem difficult at the moment to break the neckline but many other indices , including those of European countries , are on the cutting edge .