The blogger Jesse Livermore at Philosophical Economics recently wrote another brilliant post about the use of trend following models and market timing. He found that trend following models work very well on diversified stock indices, but didn’t really understand the mechanism of how they worked. As I pride myself on being a left and right brained quant, I am going to try and explain why these classes of models work and why they perform poorly on individual securities.
Here is the summary of Jesse Livermore`s analysis:
In the current piece, I’m going to conduct a comprehensive backtest of three popular trend-following market timing strategies: the moving average strategy, the moving average crossover strategy, and the momentum strategy. These are simple, binary market timing strategies that go long or that go to cash at the close of each month based on the market’s position relative to trend. They produce very similar results, so after reviewing their performances in U.S. data, I’m going to settle on the moving average strategy as a representative strategy to backtest out-of-sample.
The backtest will cover roughly 235 different equity, fixed income, currency, and commodity indices, and roughly 120 different individual large company stocks (e.g., Apple, Berkshire Hathaway, Exxon Mobil, Procter and Gamble, and so on)…
The backtest will reveal an unexpected result: that the strategy works very well on aggregate indices–e.g., the SP 500, the FTSE, the Nikkei, etc.–but works very poorly on individual securities.
He tested Mebane Faber’s moving average strategy, which he called MMA, and found that it worked well by avoiding large losses:
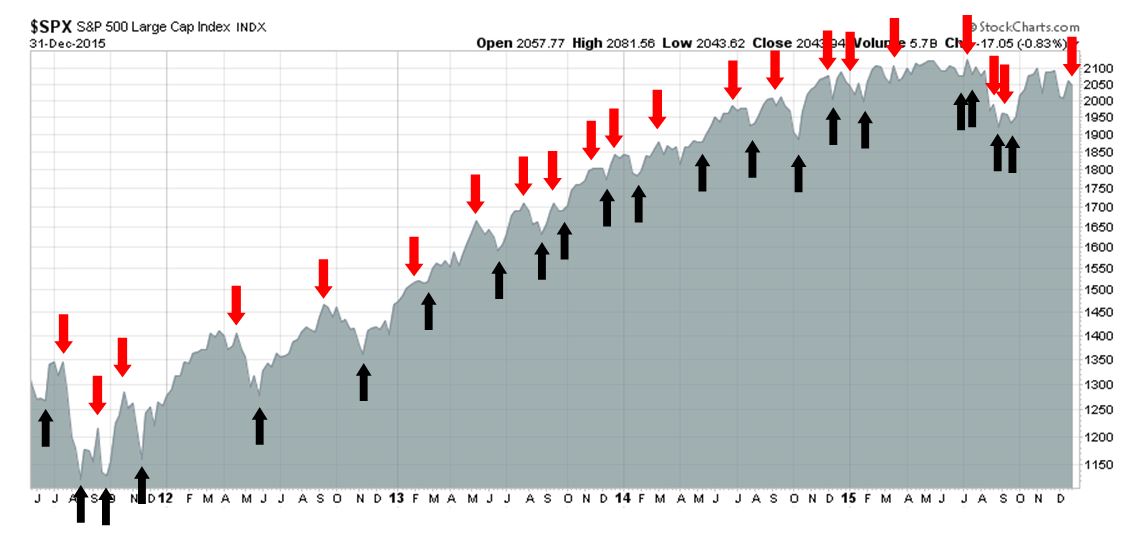
What the table is telling is that the strategy makes the majority of its money by avoiding large, sustained market downturns. To be able to avoid those downturns, it has to accept a large number of small losses associated with switches that prove to be unnecessary. Numerically, more than 75% of all of MMA’s trades turn out to be losing trades. But there’s a significant payout asymmetry to each trade: the average winning trade produces a relative gain of 26.5% on the index, whereas the average losing trade only inflicts a relative loss of -6.0%.
He tested a couple of other strategies, namely crossing moving averages and momentum and found that results were quite similar. The MMA results are summarized below:
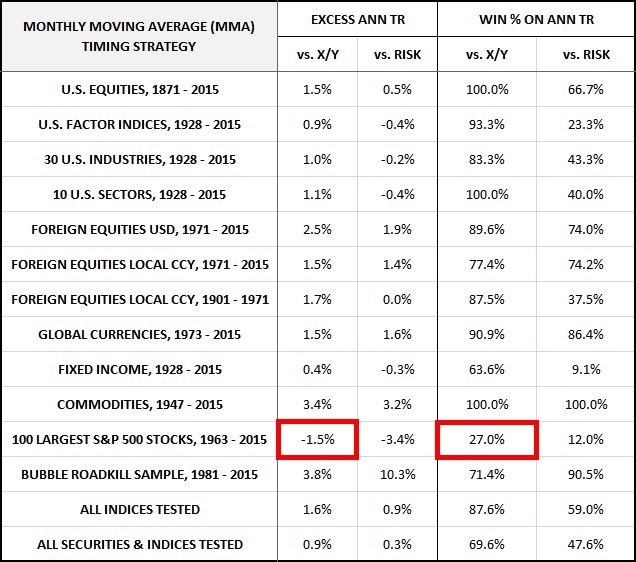
Here are the maximum drawdowns statistics for MMA:

The missing piece of the puzzle is why these strategies work:
The point I’m trying to make, then, is not that the successful implementation of a strategy necessarily requires a strong analytic understanding of the strategy’s mechanism, but that such an understanding is highly valuable, worth the cost of digging to find it. We should not just cross our fingers and hope that past patterning will repeat itself. We should dig to understand.
In the early 1890s, when the brilliant physicist Oliver Heaviside discovered his operator method for solving differential equations, the mathematics establishment dismissed it, since he couldn’t give an analytic proof for its correctness. All he could do was put it to use in practice, and show that it worked, which was not enough. To his critics, he famously retorted:
“I do not refuse my dinner simply because I do not understand the process of digestion.”
His point is relevant here. The fact that we don’t have a complete analytic understanding of a strategy’s efficacy doesn’t mean that the strategy can’t be put to profitable use. But there’s an important difference between Heaviside’s case and the case of someone who discovers a strategy that succeeds in backtesting for unknown reasons. If you make up a brand new differential equation that meets the necessary structure, an equation that Heaviside has never used his method on, that won’t be an obstacle for him–he will be able to use the method to solve it, right in front of your eyes. Make up another one, he’ll solve that one. And so on. Obviously, the same sort of on-demand demonstration is not possible in the context of a market timing strategy that someone has discovered to work in past data. All that the person can do is point to backtesting in that same stale data, or some other set of data that is likely to have high correlations to it. That doesn’t count for very much, and shouldn’t.
Trend Following Models spot macro trends
In this day and age, investment consultants use a standard 4Ps framework to dig behind investment managers to understand whether a performance record is repeatable, so a response of “I do not refuse my dinner simply because I do not understand the process of digestion” is unlikely to cut it. The 4Ps are:
- People: Who are you
- Performance: What are the returns, though past returns is no guarantee of future performance
- Philosophy: Why do you think you have an alpha
- Process: How do you implement your investment philosophy
This reason behind why trend following models work is not that difficult, but suffers from a persistent cultural bias. The vast majority of users of trend following models, or moving averages, come from a technical analysis background. The vast majority of institutional investors tend to be fundamentally oriented – and the two groups have never really mixed well. It took a quant like me, who understood both technical analysis, macro analysis and quantitative analysis to put it all together.
Hi Cam,
I am sure you have read Jack Schwager’s interview of Gil Blake in the New Market Wizards book. What Gil Blake found out and now can be exploited is the “persistency” of the trend in narrow focused indexes like Biotechnology (BBH), Semi-Conductor (SMH) and Solar (TAN). He was using it for 2 to 3 day moves but I am sure it can be used for long term buy and hold using moving averages to establish and exit trades.
Richard Dennis of the Turtles fame very aptly put it (not a direct quote) “I can give the same system to people and they will not make any money. It takes tremendous discipline more so because in trend following the sequence of profitable trades are random. Most people cannot follow the “system” because of the number of losing trades that can come in succession.
Nice article thanks for posting it.
The 4Ps or any basis of understanding are important for any system solely because one needs confidence at key turning points to keep on using it. It’s easy to set up a strategy when all is calm but as Mike Tyson said, “Everybody has a plan until they get punched in the mouth.”
I have been studying trend and momentum and successfully using techniques for forty years. In 2008, my portfolio clients went UP 8% when the market fell in half by using moving averages and momentum.
I started studying trends with the advent of negotiated rates on mutual funds in the early 1980’s. The biggest newsletter in the U.S. at the time was “Telephone Switch” that used a simple 200 day moving average line strategy to time mutual fund buys and sells that all of a sudden could be transacted over the phone (early fintech!) directly with mutual fund companies who gave discount rates. You can imagine it didn’t work with 9% commissions but did great with the new 1%. My client, a brilliant engineer, and I, back-tested various moving averages for Canadian mutuals and put it into practice north of the border. It worked well. We felt like geniuses when we missed the 1987 Crash but in the months following we were in and out as markets bounced around. We left a lot on the table just as the chart above shows the large number of losing trades but the general success with the large gains and missed declines. We set out to eliminate unnecessary switches and made a HUGE DISCOVERY.
********* SUPER IMPORTANT INFORMATION ABOUT TREND TECHNIQUES FOR CAM HUI SUBSCRIBERS *********
Before I reveal, the HUGE DISCOVERY, let me share an observation about moving average techniques, including stop-loss ones as well. They come into vogue after a big decline. This is EXACTLY when they aren’t needed. This is recency bias in action. After the crash in 2008, investors looked back and regretted not using any automatic “get out now” technique. They start using moving averages and then spend the next few years of a bull market regretting it because every dip is short and new highs keep coming. So in true human screwed up behavior, investors give up on the technique just in time for the next bear market. They lose big again by not using it when its needed. Recency bias again. This leads into the HUGE DISCOVERY;
My brilliant engineer and I, reduced the need for losing trades dramatically by including two other factors, Central Bank Policy and market valuation. We had objective measures of each that would flash red or green. That meant there were three criteria when you included whether you were above or below a trend line. One needed two of the three to be negative to make a trade. For example, after the 1987 Crash, Central Bank policy flipped from red to green as rates were dropped and stocks went from expensive to cheap. Therefor, two of the three were positive even if the market went below its moving average line. No transactions necessary for a few years.
The trend research Cam has brought us is typical. It shows what happens if you use the strategy every day for many decades. I only use it occasionally when it is needed. This minimizes my trades and doesn’t fray my nerves and tempt me to stop using it with a string of frustrating losing trades.
My background indicators have changed over the years but the idea is to use objective “get out” sell signals (trend lines and stop-losses) only when needed.
Where am I now? I expect to start using trend lines later this year when investor sentiment ramps up, valuations get stretched, Central Bank Policy turns decidedly negative and leading economic indicators turn down. This is where I was in the fall of 2007. I am worried about the high yield spread blowing out and will likely use trend lines to scale my equity exposure somewhat if we hit new highs in spreads. I believe high yield is this cycles bubble. Trend techniques saved my and my clients asses in 2008. They will again.
I stayed fully invested in 2015 using a momentum style. Here are my discretionary client results just in;
Average PMA client performance in the four programs in 2015.
Benchmark Lowest Highest
2015 Return Benchmark Indexes Client Client
Growth with stocks 8.5% -8.3% TSE Total Return 6.4% 13.6%
Growth with ETFs only 7.0% -8.3% TSE Total Return 4.6% 9.6%
Balanced with stocks 9.3% -3.6% 60% TSE TR, 40% Bonds 9.1% 9.5%
Balanced with ETFs only 7.9% -3.6% 60% TSE TR, 40% Bonds 6.6% 9.7%
I agree 100% with Ken. You need other dimensions to evaluate markets. He uses valuations & central bank policy, which are good choices.
BTW, the research I highlighted in the post isn’t mine. It was done by the blogger “Jesse Livermore”, who has done excellent and very comprehensive work in the past. The study is a vindication of technical analysis and, in particular, trend following techniques.
Sorry it looks like the columns didn’t line up well.
The numbers on each line are, 2015 return average for that strategy, the benchmark return, my lowest client’s return in that strategy and the highest clients return in that strategy.
I am especially proud of my balanced client returns. Many fixed income investors got killed on Canadian preferreds and high yield. Momentum kept me out of those. Momentum had me in U.S. dollar fixed income.
Ken, I am new to this site. Thank you very much for sharing.
Cam / Ken,
Thanks for the post and comments. I am a newbie to the markets but have been spending the last five months consuming as much information as possible. I feel like there is a lot of good information out there but also a lot of useless noise. Would either of you be willing to provide a list of recommended resources? What books / authors do you like? Are there any people in particular that you trust more than others? What should I avoid? Any advice is welcomed.
Thanks,
-Neal
Neal,
It’s hard for anyone to give you advice for a number of reasons. Here are some major ones:
1) We have no idea what your risk tolerance, or pain threshold, is
2) We have no idea what your time horizon is
3) We know nothing about your tax situation
Beyond making a call of what to buy and sell, one of the key decisions in portfolio management is deciding on how much to buy and sell. You can read about techniques like the ones that Ken and I have proposed (and there are many others who can guide you too). That is only the first step of a long journey. It`s difficult for anyone to give you much advice without understanding your situation, as per the issues that I have raised. If you are looking to either swing trade or day trade, my best advice to you is to read a lot and then develop your own trading style.
The most important question with any approach is to understand under what circumstances that methodology fails. If you can`t answer the question, then you have a serious blind spot that will blow up in your face one day.
I recognize that I am not answering your question, but this is like learning to drive a car. You need to know the rules of the road first. If you don`t and you just figure out what to do by jumping in the driver`s seat and starting the engine, then you are going to get in over your head.
Sorry, I should have clarified my question. At the moment, I’m interested more in learning than trading/investing.
If I want to become a “student of the markets,” where should I start? What should I avoid (i.e., what is a waste of time to study)? Who are some good (or great) minds that I should learn from? How can I start to make sense of the immense amount of data and separate what matters from what doesn’t?
I would try reading some of the different investment styles and see what you feel most comfortable with. All are different, but all have good investors who have made very good money in the past. Some suggestions:
Value: Read past Berkshire Hathaway annual reports and comments from Warren Buffett – one of the best. Recognize that being a value investor can be painful, but you will be rewarded over time. You need to be patient.
Quality growth: Peter Lynch, One up on Wall Street
Dean LeBaron’s Treasury of Investment Wisdom: 30 Great Investing Minds. I used to work for Dean at Batterymarch. Dean LeBaron was a legend in his time.
Trend following: The Complete TurtleTrader: How 23 Novice Investors Became Overnight Millionaires
The New Market Wizards: Conversations with America’s Top Traders
That’s enough to start with. With each of them, you will think that you found religion, but understand that nothing works all the time. Just figure out what you’re comfortable with.
http://seekingalpha.com/article/3793056-what-if-shes-not-there-for-investors-why-dr-yellen-may-not-care-if-stock-prices-drop?isDirectRoadblock=false&uprof=
CAM: I ask you to evaluate (more than skim) this current piece by DoctoRx. He is the only other market commentator whom I follow as closely I follow you, for several years.
I find him, like you, data driven, quantitative, thinks and writes clearly, is humble about the limits of his powers. His usual focus is on single companies, but there is always a context. Left and right brained. In this piece, he has a broader brush; worldwide economics, inflation, fed policy, etc. Over the past year he has become quite bearish, with drastic changes in his portfolio, even for the next several months. Much darker and defensive than you, as I understand you.
I boldly ask for your opinion on this essay because I have come to trust you both.
I am NOT asking you for specific advice FOR MYSELF; only for your take on his premises, choice of evidence, reasonableness of working assumptions, appropriateness of his action plan, or posture, in relation to yours.
I shall be very grateful if you excuse my presumption and undertake my request.
Your servant,
David Galin MD
(P.S. – my professional career centered on left- and right
hemispheric cerebral specialization, and the ensuing
cooperation and conflict).
I will try to give you a more complete answer in my post this weekend.