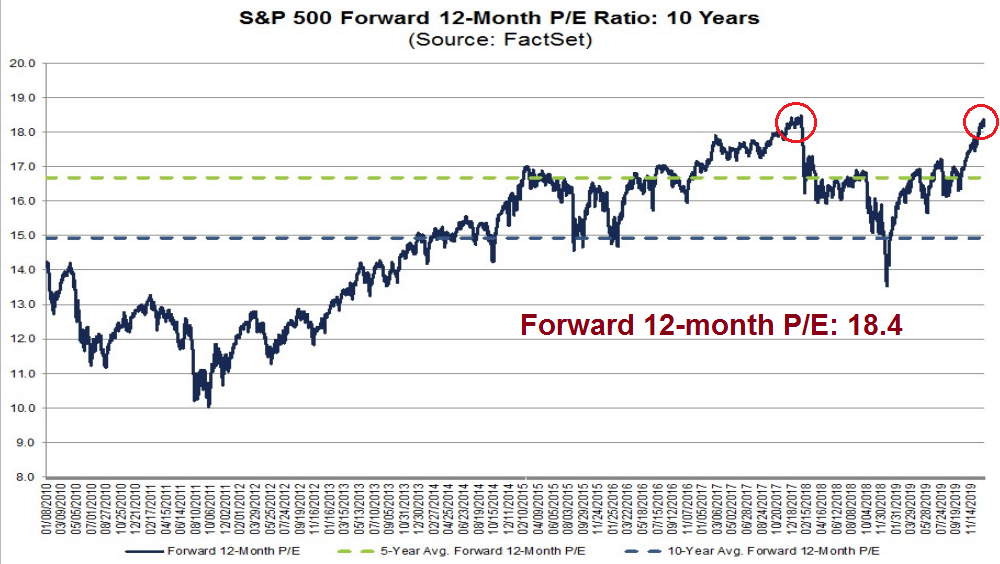
Mid-week market update: The stock market is over-extended. I warned on the weekend about the market’s nosebleed valuation (see Priced for perfection). The market’s forward P/E ratio of 18.4 matched the levels last seen at the 2017/18 market melt-up.
But there are some crucial differences between the last melt-up episode and the one today.
Crucial differences
One crucial difference is each rally was sparked by different fundamentals. As the chart below shows, the last melt-up coincided with surging EPS estimates from Trump’s tax cuts. The market cratered when the pace of upward estimate revision slowed. Today, estimate revisions are flat to slightly up. Today’s melt-up was mostly attributable to P/E expansion, not rising earnings estimates.

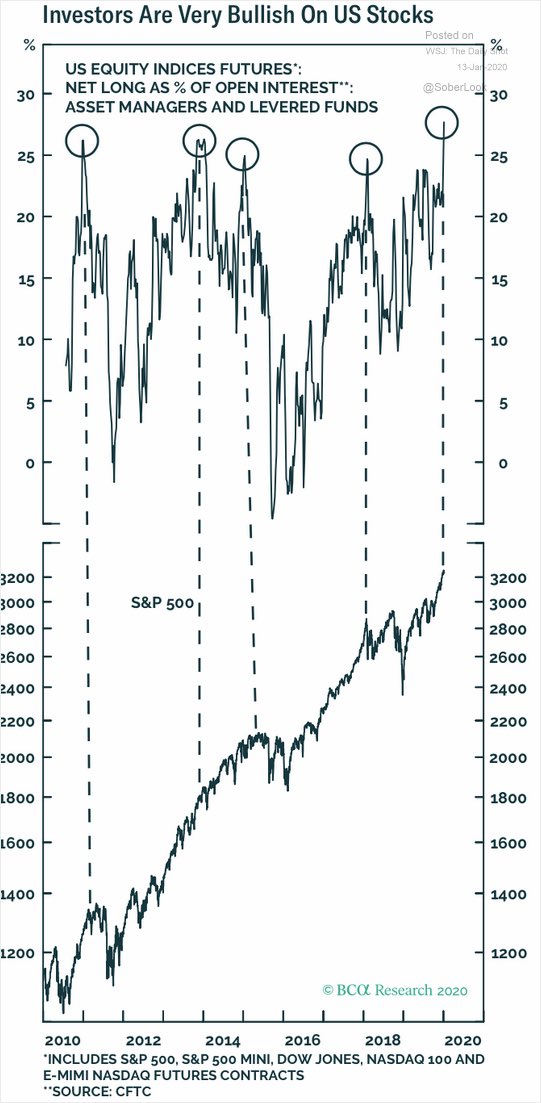
I had identified the nascent bull move in early November (see Buy the breakout, recession limited and How far can stock prices rise?). Investors were caught offside with excessively defensive portfolios. As it became evident that the economy was not falling into recession, a beta chase began, and cyclical stocks soared (see Here comes the beta chase).
Fast forward two months. While the slow moving institutional money is raising their market beta, the fast money is in a crowded long (h/t Liz Ann Sonders).
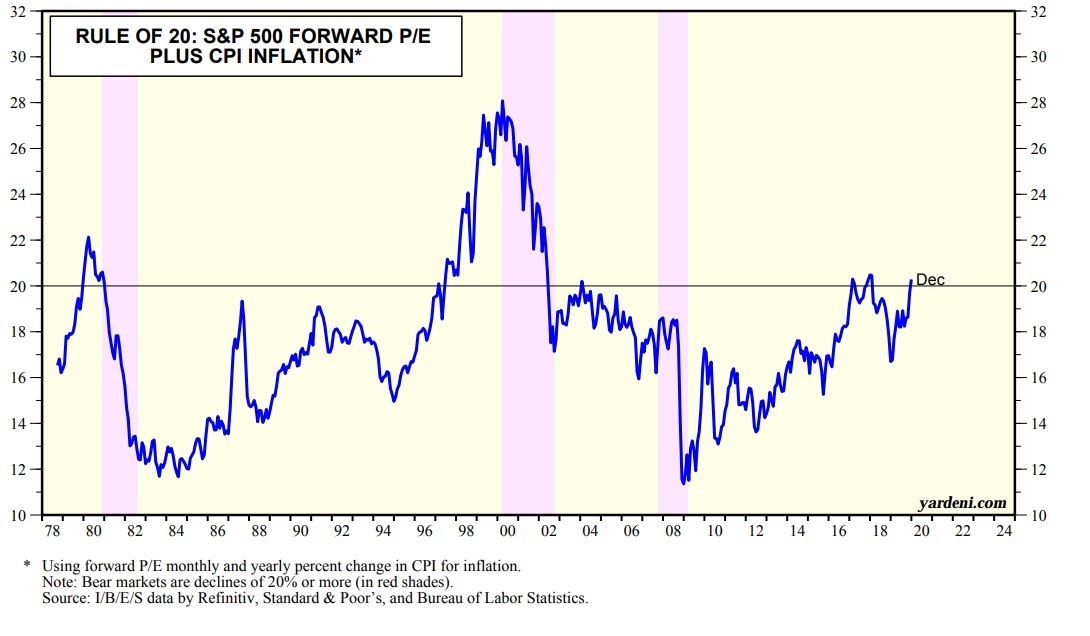
The Rule of 20, which raises a warning flag whenever the sum of the market P/E and inflation rate exceeds 20, is coming into play.
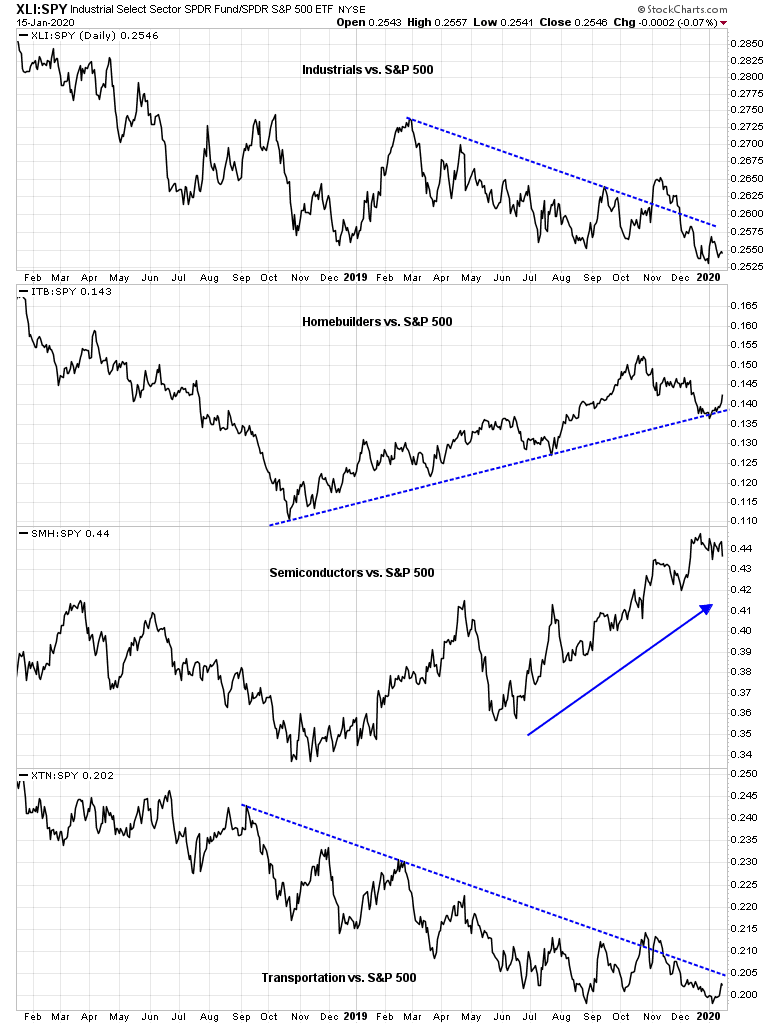
In addition, the relative performance of selected cyclical industries have been faltering, especially the industrial and transportation stocks.
It is time for a pause in the rally.
Estimating downside risk
To be sure, price momentum is still very strong right now, and I have no idea when the market will correct in the short run. However, we can estimate downside risk in a couple of ways.
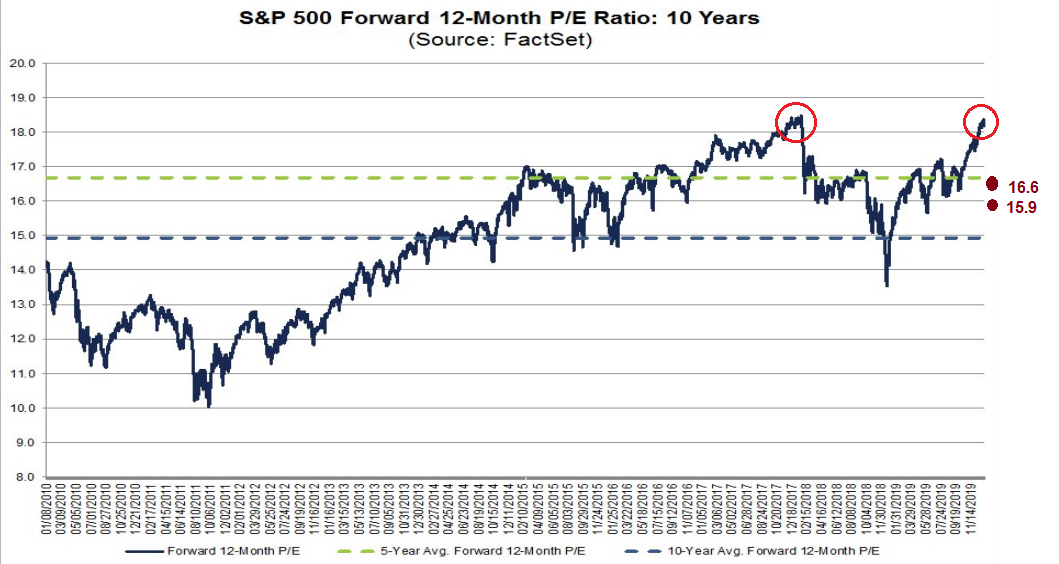
As the chart below shows, the corrective phase in the last melt-up was halted at the red upward sloping trend line, which represented an -11.8% downdraft. A similar projection today yields a downside target of about 2970, or downside risk of around 10%. Secondary support can be found at about 2850, or downside risk of -14%.

From a valuation perspective, a 10% correction would translate to a forward P/E of 16.6, which is just below the 5-year average of 16.7. A decline to secondary support at 2850 means a forward P/E of 15.9.
Much will depend on how earnings estimates evolve during the latest earnings season, and the tone of the outlook corporate management gives in their earnings calls.
A correction, not a bear
In the short run, I had waiting for the lines in the sand that I outlined on the weekend to be crossed before turning tactically bearish. Subscribers received an email alert this morning that one of my bearish lines in the sand had been crossed, but I was waiting for the closing bell for confirmation of the signal. TLT and the 30-year yield crossed their trend lines. Since a rally in Treasuries tend to be a sign of falling risk appetite, this is a cross-asset negative risk-off signal for stocks. I therefore initiated a small short position in the stock market in my trading account.

However. the other bearish tripwire that I outlined has not been triggered. The SPX has not fallen below its 5 day moving average on a closing basis despite exhibiting negative RSI divergences.

Looking further ahead, I believe that this market is only facing a correction, and not a bear market. Despite the recent setback suffered by cyclical stocks, top down macro indicators of a global cyclical rebound The Global Economic Surprise Index is still rising, indicating more positive than negative economic surprises.

In particular, data out of Asia is seeing a more positive tone. South Korea’s cyclically sensitive first 10-day exports rose 5.3% YoY in January, compared to -5.2% in December, though some of the positive surprise was attributable to the effects of a low base. In addition, China’s December exports rose 7.6% (vs. 3.2% expected) and imports rose 16.3% (vs. 9.6% expected), indicating strength in the Chinese economy, even before the effects of a Phase One trade deal kicks in. However, be prepared for some volatility in the January data, as the Lunar New Year falls in January this year compared to February last year.

My inner investor remains bullishly positioned. My inner trader has dipped his toe in on the bearish side.
Disclosure: Long SPXU
Hello Cam,
Your “Priced for Perfection” piece released on Sunday morning used the 10dma as a trigger:
“Subscribers received an email alert on Thursday indicating that I had taken profits in all of my long positions and I was in 100% in my trading account. Here are two lines in the sand that I am watching to become more aggressive and go short. The first is an SPX close below its 10 dma.”
In your narrative above you use the 5dma as the trigger. I’m wondering which it is! Thanks, Tom
I was using either of those triggers to go short. If one of them tripped (which it did), I would take a small initial position. If both did, I would take a bigger short position.
I apologize for being unclear.
Sorry but…
So the trigger is on the 10 dma, not the 5 dma as you said in this post? It looks like a typo.
Trigger is 5 dma. Where did I say 10 dma?
In the latest post I reference the 5 dma.
“Lines in the sand
On the other hand, traders should exercise caution, and take steps to either de-risk their portfolios, or set up risk management triggers to de-risk or possibly go short.
Subscribers received an email alert on Thursday indicating that I had taken profits in all of my long positions and I was in 100% in my trading account. Here are two lines in the sand that I am watching to become more aggressive and go short. The first is an SPX close below its 10 dma.”
No bearish divergence in HYG.
.
As for SMH:SPY ratio, there were pullbacks in the past in a rising trend. Can’t tell the difference on this pullback.
https://www.tradingview.com/x/OsbYtExn/
If this ratio reverses / bounces off from here, it’s bizwax as usual.
.
It’s one day breakout in TLT, and it’s looked overbought. Not too sure it means anything too much.
.
Bearish divergence isn’t a sell signal by itself. Will see.
.
I have been expecting this pullback since last week. But………………..
Needs to see bearish divergence in HYG
True… Also TNX looks like forming a bullish triangle.
Negative divergence is not an actionable signal until price confirms with it. That means at least close below 9EMA or other short term trend lines/MAs…
A pullback in global markets may take the form of a rotational pause. Emerging markets pulled back over the past two days, and may begin to rally as US indexes pull back.