I have been in the habit of writing a weekend publication consisting of a relatively long research piece combined with a tactical trading commentary, which has at times been very long. As an experiment, I am splitting the two up. Please let me know if you prefer the format of two shorter posts, or a combined longer publication.
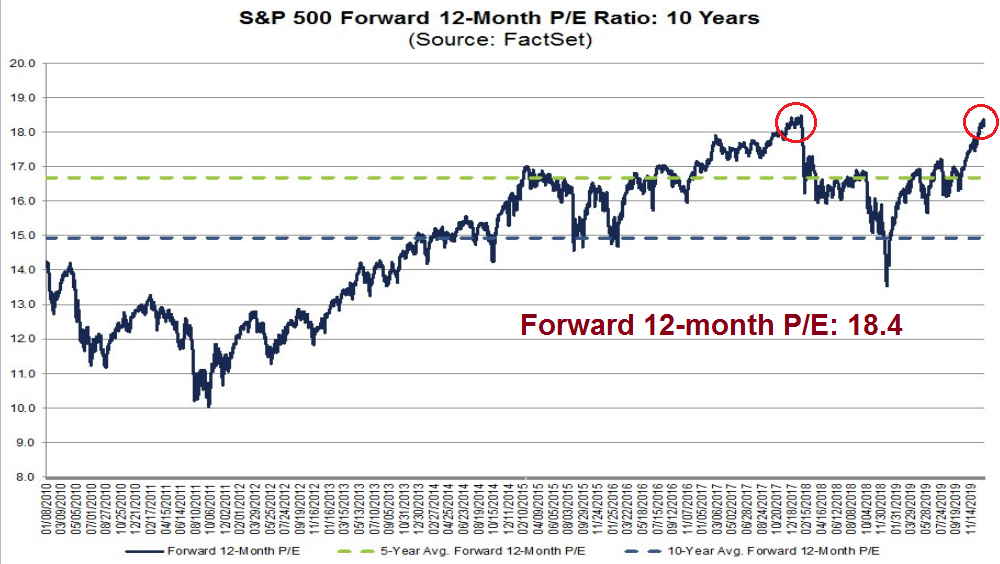
As the market advanced to another fresh high, the forward P/E rose to 18.4, which roughly matches the level last seen at the melt-up high of early 2018.
From a pure valuation perspective, stock prices have risen too far, too fast. Oliver Renick, writing in Forbes, justified the elevated valuations this way:
Actually, if there’s anyone for the bears to blame, it’s themselves.
Economic data in the U.S., China and Eurozone are beating expectations by the biggest gap since early 2018 and on the longest win-streak since mid-2017, according to the sum of Citi’s economic surprise indices I compiled using Bloomberg. Geopolitical risk between the U.S. and China is fading, Brexit is on some path toward completion, a dropping dollar is providing relief to emerging economies, and the global banking system is still intact despite an unnerving foray into the land of negative interest rates. So stocks are rallying as things improve. It’s as simple as that.
Macro concerns have been resolved bullishly, one by one. The reduction of macro risk has compressed risk premiums, and conversely, boosted P/E ratios.
In other words, the market is being priced for perfection.
Market potholes ahead?
Here are some possible potholes that investors should be concerned about. A Chinese delegation is expected to arrive in Washington next week January 13-15 to ink a Phase One trade agreement. Could any last minute details hold up the signatures?
Caixin reported that China will not raise its annual low-tariff grain import quotas, which could be an impediment to its commitment to purchase more American goods as part of the Phase One deal. To be sure, there are some ways that it could fudge imports, such as diverting current indirect Hong Kong imports from the US to direct imports. Nevertheless, this development could become a last minute roadblock to a deal.
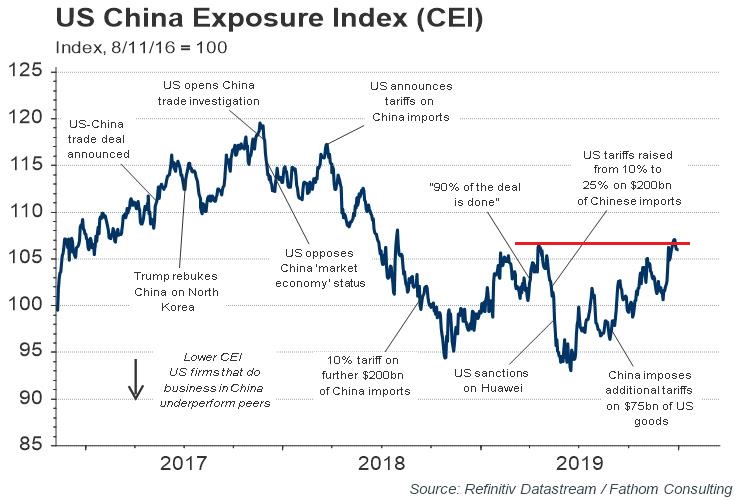
Fathom’s China Exposure Index (CEI), which measures the performance of US-listed firms that do business in China against their domestic peers, is already at highly elevated levels. What could possibly go wrong?
Even if the Phase One deal is concluded on time without any hitches, American trade negotiators are expected to turn their sights on the EU, which Trump has called “worse than China” on trade. EU trade negotiator Phil Hogan is scheduled to be in Washington next week for what could prove to be the start of contentious trans-Atlantic trade negotiations.
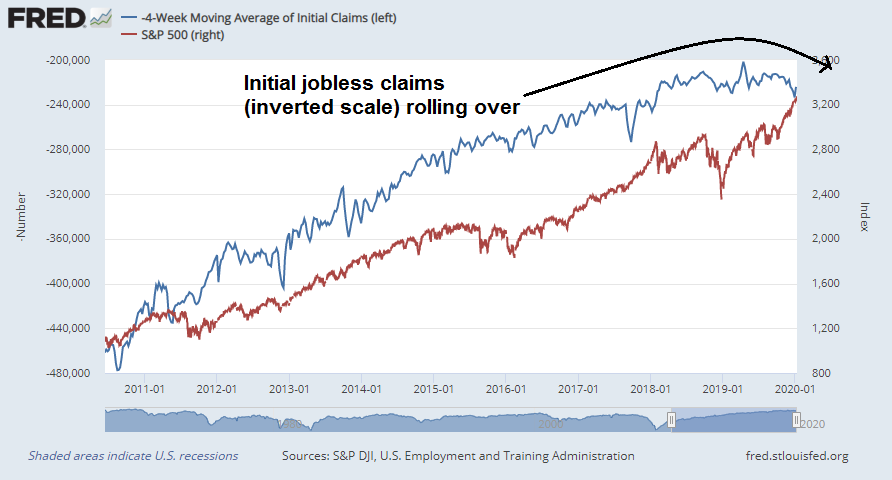
In addition, Friday’s weakish Jobs Report highlights the market vulnerability to weakening employment. Initial jobless claims has been inversely correlated to the SPX during this expansion cycle, but initial claims (blue line, inverted scale) are rolling over while stock prices (red line) continue to rise. How long can this negative divergence last?
New Deal democrat, who has done a stellar job of monitoring high frequency economic indicators, believes the jobs market is telling the story of a slowdown, but no recession.
This remains consistent with a significant slowdown. But there have been similar readings in 1967, 1985-6, 3 times in the 1990s, and briefly in 2003 and 2005, all without a recession following. So the threshold for continuing claims being a negative (vs. neutral) has not been met.
Giddy sentiment
Even as macro risks lurk, the sentiment backdrop tells the story of a market that is excessively bullish and vulnerable to a shock. Three of my real-time sentiment indicators are in the red. Each of these indicator capture a different dimension of investor and trader sentiment, but they are all flashing warning signs.
- VIX Bollinger Band width narrowing, indicating volatility compression.
- 10-day moving average of equity-only put/call ratio at historical lows, indicating bullish complacency.
- 10-day moving average of TRIN at historical lows, indicating persistent buying pressure.

For the ultimate sign of giddiness, here is a tweet by Helene Meisler, market commentator and contributor at Real Money.
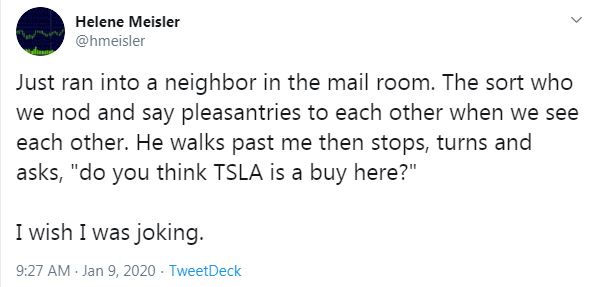
Joe Kennedy reportedly sold all of his stocks before the 1929 Crash when his shoeshine boy started giving him stock tips. Is this the modern day shoeshine boy moment?
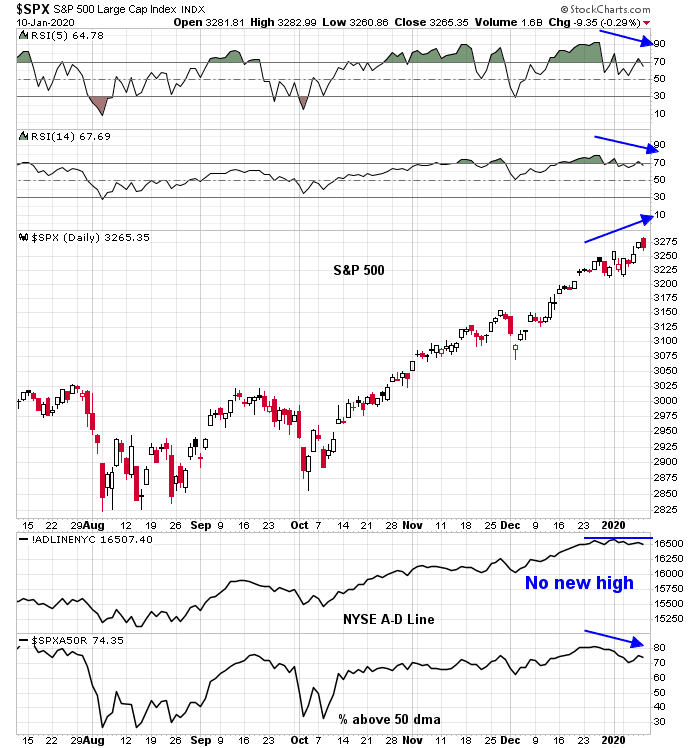
Negative divergences everywhere
At the same time, the market is flashing negative technical divergences even as the index pushed to fresh all-time highs. The 5 and 14 day RSI, NYSE Advance-Decline Line, and % above the 50-day moving averages all failed the confirm the new highs.
This is a market that is increasingly vulnerable to a setback. Valuations are stretched, the market is priced for perfection, sentiment is positively giddy, and market internals are bearish. We just need a bearish catalyst. While price momentum remains dominant in the current environment, and the major market indices could rally further, risk/reward is unfavorable,
That said, I believe that investors and traders should react to these conditions differently. For some context, the trader at Macro Charts recently warned about how “extreme and historic complacency [is] building in markets”. He concluded:
If history is a guide, the risk-reward over the next 1-2 months is moving towards “extremely poor”, and we shouldn’t rule out a compressed (front-loaded) decline either. All that’s needed is a “catalyst”, as always just a narrative/excuse to trigger deleveraging.
Sounds dire, right? However, he examined past episode during the 2001-2005 and 2009-2020 periods when he spotted similar conditions. Maximum peak-to-trough drawdowns ranged from -4% to -17%, with an average of -8.7% and a median of -7.5%. In many of the cases, the market edged higher by about 1% before falling, so downside risk was slightly smaller than those statistics. In effect, average downside risk is in the 5-10% range.
Should investors be worried about a pullback of that magnitude? Doesn’t that just represent normal risk of holding equities? We therefore believe that investment oriented accounts are advised to remain invested but to wait to deploy new cash. The risk of a prolonged bear market is low, and downside risk is limited to a 5-10% correction and valuation reset. My inner investor is therefore still bullishly positioned.
Lines in the sand
On the other hand, traders should exercise caution, and take steps to either de-risk their portfolios, or set up risk management triggers to de-risk or possibly go short.
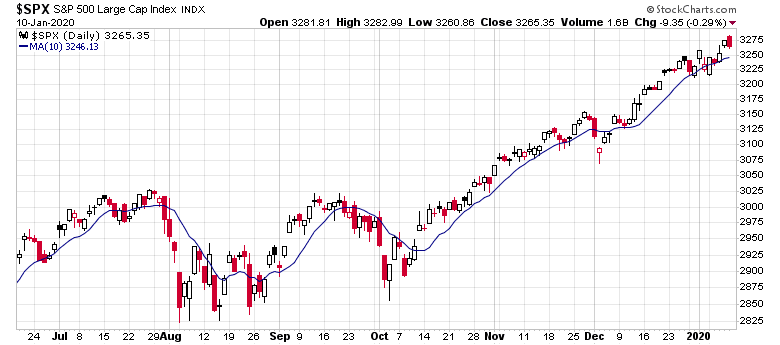
Subscribers received an email alert on Thursday indicating that I had taken profits in all of my long positions and I was in 100% in my trading account. Here are two lines in the sand that I am watching to become more aggressive and go short. The first is an SPX close below its 10 dma.
The second is a bond market rally. Either the 30-year yield or TLT has to break through the pictured trend lines. Since bond prices are roughly inversely correlated to stock prices, an upside TLT breakout is a signal that stocks may be in trouble.

My inner trader plans to take partial short positions in equities should either of these events occur. If both occur, he will take a full short position. Since both of these signals are a function of closing prices, I may not have sufficient time to alert subscribers with an email alert before the market close.
I agree totally that at the beginning of 2018 stocks were overpriced and sentiment was too optimistic.
But even with the same PE and similar high optimism, the market is not overvalued. In 2018 the Fed was starting QT and raising interest rates three times. They were attempting to do normal things. But at the first signs of economic stress, they gave up.
So the interest rate outlook is extremely different than the beginning of 2018. We are now in ‘lower forever’. We have a Fed who has signalled it will NEVER risk an economy wide recession. They gave up that notion this year. That makes this PE of 18.4 or 5.4% earnings yield with a 1.9% dividend a much better deal than last year.
As Cam says, there could easily be a 5-10% correction but stocks could go much higher than 18.4 times in the next few years in this Moonless world before they will be overvalued.
But at the beg. 2018 no tax cut in the US was in sight. And also if commodity is to start rise then the inflation can tick up and interest rates can start to move higher … Perhaps not the FED rates but market rates. But generally I agree that the stock will go higher (than they are today) in 2020.
I think that what is even more striking is that the P/Es for the last 10 years are as a group at high levels…look at what they were in the 50s, 60s, 70s. In those decades the financial health of those companies was better than now, the USA was not the global debtor. So yeah people expect money printing forever, only forever is kinda long.
When risk aversion comes for whatever reason, things will change. I remember in 1974 or so, could have been 75 buying a small amount of a stock that was traded OTC at a price so cheap that I feared fraud, so I bought only 400 shares. It was a nano cap and OTC, but earnings were growing such that the forward P/E was 3 (which turned out to be accurate, 96 cents for a rapidly growing computer stock that was around 2 1/2 at the time), but the kicker was it had no debt and something like 8-9 $ cash and nobody wanted it…How can a stock with almost 10$ in cash and no debt and growing at almost 100% a year in earnings (not revs, earnings) sell for less than 3 bucks? Risk aversion, period…well 74 was during a secular bear.
So for now risk on means prices can go to any level, but when the secular bear comes we may see P/Es at the low point of the previous 10 years only to watch them go even lower.
Just don’t know when the change happens, but if people start being repulsed by the Fed and not believing in the Fed would be a sign, but we need a few market train wrecks for that I think…so not tomorrow
Yea 74 was at the end of a secular bear (actually the 82-00 secular bull bottomed in 74). Also I think it’s important to compare average yield of s&p500 to bond yields. Stock yields have been lower than bonds for many decades. Right now TNX is only at 1.8%, so…
I offer some of my personal observations here for longer term time frame.
1. IR is in secular decline. Yeah, lower for longer.
2. As a result, equities can have PE expansion.
3. Equally important, with buyback (help from cheap money; hello AAPL), P can continue to rise without further PE expansion. A trick going popular now. It aligns mutual interest of share holders and management.
4. If your whole country’s financial future is riding on 401(k), do you think Government will not do anything to keep equity markets going?
5. Agree with Ken. Very unlikely to have wholesale market blow-up. Might have localized weakness. Might have rotating pause or small pull-back. Government’s hands are everywhere, e.g. recent Repo market maneuvering.
6. As a result, short Vol will be a very profitable trade.
For short term, especially when Q4 2019 earning report season coming up soon.
7. Expectation game is revving up again. Most recent estimate for SnP earnings has dropped by -4.7% in the last three months. So expect a lot of beating the estimates and higher share prices. Then again, it might not move much. And we will know it is already priced in.
Cam,
I like the two article format better on the weekend. Thanks.
Hi Cam, I also like the two article format better on the weekend, thanks.