Preface: Explaining our market timing models
We maintain several market timing models, each with differing time horizons. The “Ultimate Market Timing Model” is a long-term market timing model based on the research outlined in our post, Building the ultimate market timing model. This model tends to generate only a handful of signals each decade.
The Trend Model is an asset allocation model which applies trend following principles based on the inputs of global stock and commodity price. This model has a shorter time horizon and tends to turn over about 4-6 times a year. In essence, it seeks to answer the question, “Is the trend in the global economy expansion (bullish) or contraction (bearish)?”
My inner trader uses the trading component of the Trend Model to look for changes in the direction of the main Trend Model signal. A bullish Trend Model signal that gets less bullish is a trading “sell” signal. Conversely, a bearish Trend Model signal that gets less bearish is a trading “buy” signal. The history of actual out-of-sample (not backtested) signals of the trading model are shown by the arrows in the chart below. Past trading of the trading model has shown turnover rates of about 200% per month.
The latest signals of each model are as follows:
- Ultimate market timing model: Buy equities
- Trend Model signal: Bullish
- Trading model: Bullish
Update schedule: I generally update model readings on my site on weekends and tweet mid-week observations at @humblestudent. Subscribers will also receive email notices of any changes in my trading portfolio.
A China-led reflationary recovery?
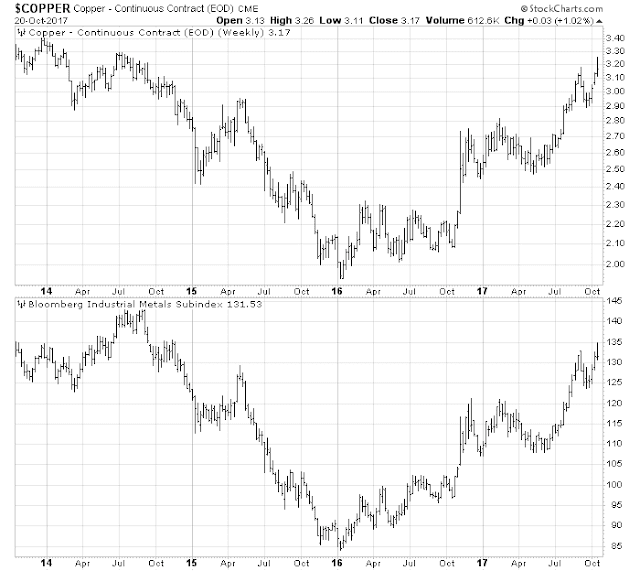
Copper and industrial metal prices have been on a tear lately. Prices bottomed out in early 2016, and the latest rally has seen a recovery to levels last seen in 2014.
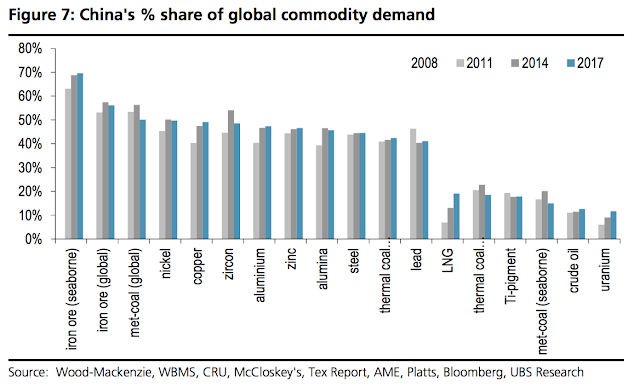
China is a major driver of commodity demand, and her economic growth has been surging recently. It is therefore no surprise that copper and industrial metal prices have been soaring.
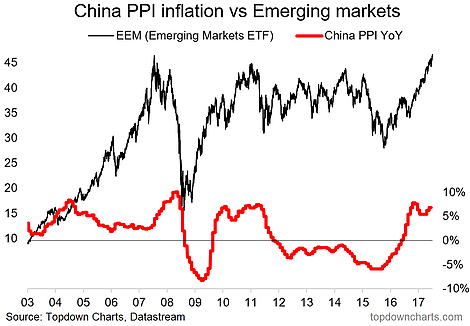
The latest upside surprise in Chinese PPI prompted David Ingles at Bloomberg to ask if China is leading a bout of global reflation.
Callum Thomas at Topdown Charts also observed that China is at the epicenter of the global reflation theme.
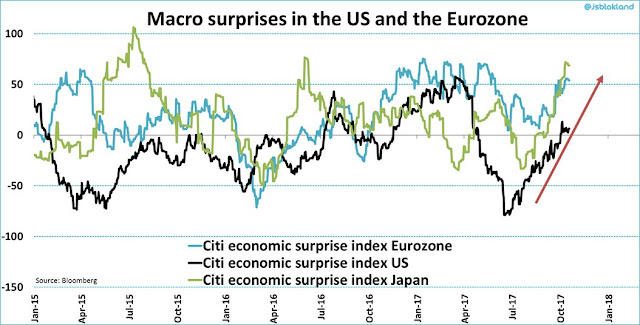
The developed markets are also experiencing a synchronized upswing.
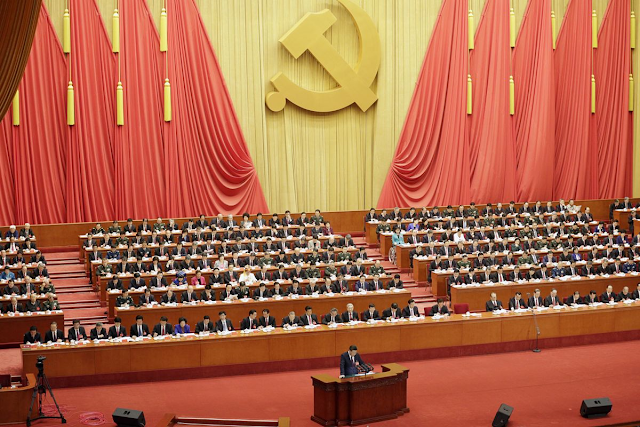
On the other hand, China is currently holding its 19th Party Congress. It doesn’t take a genius to understand that any bureaucrat who creates conditions that causes either a growth slowdown or financial instability during this critical period will have made his own life very difficult. In effect, Beijing has given a 19th Party Congress put option to the market, where nothing bad would be permitted to happen to the economy ahead of the meeting.
Skeptics could therefore ask if the current growth revival is real, or window dressing ahead of the Party Congress. What happens after the expiry of the 19th Party Congress Put as the meeting winds up next week?
Deleveraging with Chinese characteristics*
Despite the widespread concerns about the extended state of China’s debt levels and the lip service paid to deleveraging, Chinese authorities have been juicing the Chinese economy with credit driven growth ahead of the Party Congress. Tom Orlik had the perfect observation that describes China’s deleveraging efforts.
The latest September report of Total Social Financing (TSF), which represents the broadest measure of debt, rose 13% YoY and an astonishing 23% MoM. At a 13% growth rate, Christopher Balding pointed out that TSF growth has hardly slowed when compared to the past few years. Nominal TSF growth is well above nominal GDP growth, based on a real GDP growth rate of 6.8% and inflation rate of 1.6%.
This is deleveraging?
What`s even worse, the WSJ reported that the government has been supporting the real estate market by ordering local authorities to buy up surplus properties:
Under Beijing’s direction, more than 200 cities across China for the last three years have been buying surplus apartments from property developers and moving in families from condemned city blocks and nearby villages. China’s Housing Ministry, which is behind the purchases, said it plans to continue the program through 2020.
The strategy, supported by central-government bank lending, has rescued housing developers and lifted the property market, which accounts for a third of China’s economic growth according to Moody’s Investors Service…
China’s government used to build homes for families who lost theirs to development or decay. But last year, local governments, from the northeast rust belt to this city of 3.7 million amid the croplands of central Anhui province, spent more than $100 billion to buy housing from developers or subsidize purchases, according to Gavekal Dragonomics.
Underpinning the strategy is a cycle of debt. Cities borrow from state banks for purchases and subsidies, then sell more land to developers to repay the loans. As developers build more housing, they, too, accrue more debt, setting up the state to bail them out again. The burden on the state rises, as does the risk of collapse.
The government has tried other ways of filling apartments, such as offering cash subsidies to encourage rural migrants to buy in urban areas, but the program is the first large-scale case of the government becoming a home buyer itself.
Tom Orlik also pointed out that Beijing continues to follow the same-old same-old practice of infrastructure spending to drive economic growth.
Fathom Consulting had this brutal takedown of China`s policies:
Of the ten indicators included within our CMI 2.0 (see Fathom Consulting, ‘Our expanded China Momentum Indicator shows growth rebounding – for now’ for a detailed look at our CMI 2.0 indicator), half have expanded at significantly higher rates than in the slump of late 2015: railway and port freight, electricity consumption, real imports and the commodity price index. Meanwhile, growth in those indicators representative of the services sector of the economy remains subdued. This supports our call first presented to our clients in a note in the first half of 2016 (see Fathom Consulting, ‘China’s growth is bottoming out’) that Chinese policymakers have doubled down: recommitting to the model of export- and investment-led growth rather than a reorientation towards the consumer.
This amounts to a continuation of credit being channelled to unproductive assets within the economy. As we explained in a note sent to clients (See Fathom Consulting, ’Productivity puzzle the drugs won’t work’), the accumulation of non-financial debt beyond 250% of GDP stops being effective and starts to damage growth significantly. China passed this point in the third quarter of last year.
Translation: As China continues with its credit-driven growth model and makes little effort to rebalance its economy, the day of reckoning draws ever closer. Call this deleveraging with Chinese characteristics*.
Commodity bull with Chinese characteristics*
The current commodity bull may also turning out to be a bull with Chinese characteristics*. China Beige Book, which monitors the health of the Chinese economy from a bottom-up basis, recently wrote that the so-called “supply side reforms” of cutting commodity production capacity is a smokes and mirrors exercise. The withdrawal of supply is only a window dressing exercise ahead of the Party Congress:
Finally, and again contrary to government claims, China hasn’t slashed overcapacity in commodities sectors. Xi has incessantly touted what he calls “supply-side reforms,” which would seem to give Chinese companies very strong incentive to report results showing such cuts.
Yet for more than a year, firms have indicated the opposite. While some gross capacity has been taken offline to much fanfare, net capacity has continued to rise. From July through September, hundreds of coal, steel, aluminum and copper companies reported a sixth straight quarter of overall capacity rising, not falling.
This will soon come to a head. For over a year, blistering demand and flows of speculative capital have combined to keep metals prices rising and mask the lack of genuine supply cuts. In the third quarter, though, firms across sub-sectors reported poorer revenue and profit results. Most telling, domestic orders weakened sharply, signaling that there’s no quick rebound on the way. Unless true supply cuts are imposed, it’s a matter of when, not if, speculative inflows unwind and many investors find themselves running for cover.
More worrisome is the observation that it is Chinese speculative demand, not physical demand, that is driving the commodity rally. The WSJ reported that commodity trading volumes in China are overtaking traditional western venues, such as the LME, with *ahem* Chinese consequences:
Chinese speculation was “the key driver of the rally” in base metals this year, said Michael Widmer, chief metals strategist at Bank of America Merrill Lynch. “We’ve virtually not seen any improvement in underlying fundamentals.”
China has long been a focal point for commodities markets. The nation is the world’s largest metals consumer. But now, it has also become home to massive trading in metals. Because the government has taken steps to cool the property market and the country’s normally volatile stock market has calmed, Chinese retail investors have turned to base metals in recent years to generate rapid returns. Analysts said they prefer to trade on an exchange within the country because it is easier than trading on foreign exchanges like the LME…
On some days this year, the reactions in prices to reports left many in the metals market confounded. Prices rose even after information that typically sends copper and other base metals lower. On such days, some fundamental investors and analysts blamed speculators.
Data on Aug. 13 showed the pace of Chinese industrial output, retail and housing sales, and fixed-asset investments decelerated in July. Still, after two days of muted moves, prices of copper, aluminum and nickel went on to rally for the week and continued rising for the rest of August.
On Aug. 29, U.S. mining giant Freeport-McMoRan reached an agreement with the Indonesian government over a key mine—a potential blow to copper prices since disputes between the company and country had limited supply. Yet prices went on to advance in five of the next six sessions. Many analysts use copper as a benchmark to gauge the performance of the wider industrial-metals complex because of its widespread uses and prominence.
“Bullish news is being used to buy, but bearish news is being ignored,” said Daniel Briesemann, an analyst at Commerzbank .He said the 16% gain by an LME base metals gauge between May and August appeared largely driven by short-term players. Before then, the LME gauge had been roughly flat this year.
Copper prices have fallen 1.5% from a nearly three-year intraday high last month. After about a four-month rally earlier this year, prices of nickel and iron ore have each tumbled at least 8%. Still, prices of copper, aluminum and zinc are each up more than 20% this year.
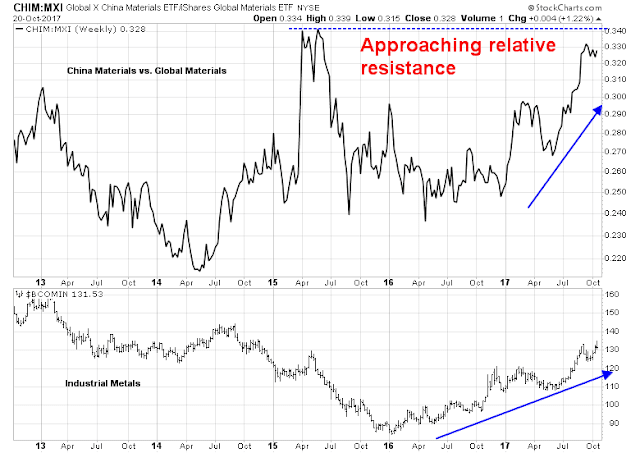
One measure of the surge in Chinese speculative demand is the relative performance of the China Materials ETF (CHIM) against the global Materials ETF (MXI). If market dynamics are stable, then the pair should trade in a fairly narrow band. As the chart below shows, China Materials stocks have been rising against their global counterparts and the rally is coincidental with the rally in industrial metal prices. The CHIM/MXI pair is rapidly approaching a key relative resistance level, which may be a signal that the China driven commodity rally is about to stall.
Other market internals are also deteriorating. The China Economic Surprise Index, which measures whether economic statistics are beating or missing expectations, is falling.
As well, the AUDCAD currency cross has been trending downwards. Both Australia and Canada are commodity producers and therefore their currencies have similar levels of commodity sensitivity. Australian commodity exports are geared towards bulk commodities and China, while Canadian exports have a greater US sensitivity and more exposed to the energy sector. The downtrend in AUDCAD represents a negative divergence, particularly when industrial metals have been outperforming oil prices.
Call this a commodity bull, but with Chinese characteristics*.
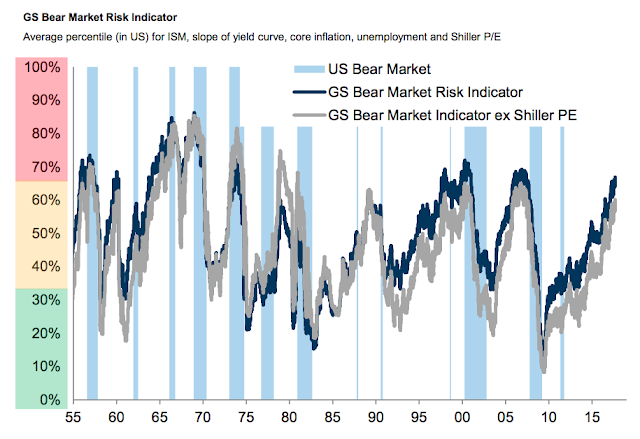
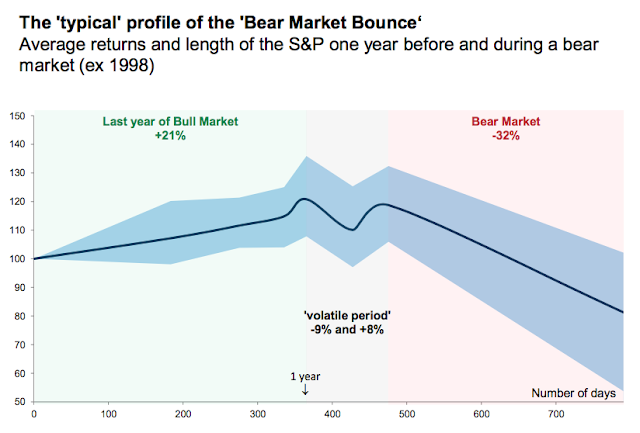
Business Insider reported that Goldman Sachs published a research note suggesting that the US stock market has an 88% chance of entering a bear market within 24 months.
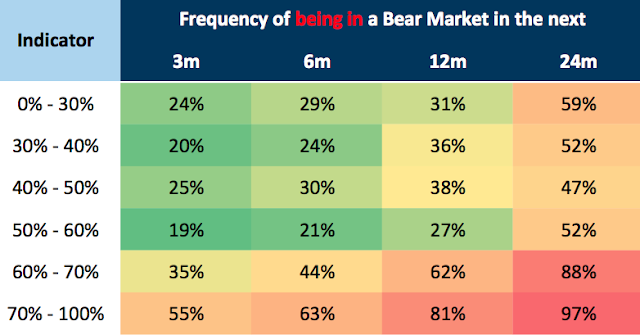
The GS Market Risk Indicator has risen to levels seen at previous tops and stands at 67%, which indicates that there is an 62% chance that US equities will enter into a bear market within 12 months, and 88% chance of a bear market within 24 months.
The typical profile of a bear market looks like this. The market tops, corrects, and rallies to make a double top before the actual slide begins.
This is consistent with my own observation that stock prices tend to top out when the DJ Global Index makes a double top with a negative RSI divergence (see Market melt-up and crash?).
As well, it is consistent with my past analysis that late cycle bulls are characterized by inflation hedge sector leadership such as Materials (see Buy the breakout?). I am continuing to monitor the relative performance of the gold, energy and materials sectors to see how this scenario is playing out.
Ned Davis Research confirmed my late cycle thesis when they observed that SP 500 sales growth ex-energy has been rolling over. Unless the economy comes through with better than expected growth, the fundamentals are likely to start stalling next year (chart annotation is mine).
The path forward
From a tactical viewpoint, we have not seen the first downside break in stock prices, as shown in the Goldman Sachs chart of the idealized top, nor in my DJ Global Index chart above. However, the market is significantly overbought, but exhibiting signs of powerful positive momentum. It is impossible to know ahead of time what will trigger the downside break.
China’s 19th Party Congress winds up next week, and which will signal the expiration of the Party Congress Put. However, that doesn’t mean that the Chinese economy and commodity prices will instantly tank, but that could be one trigger of market weakness.
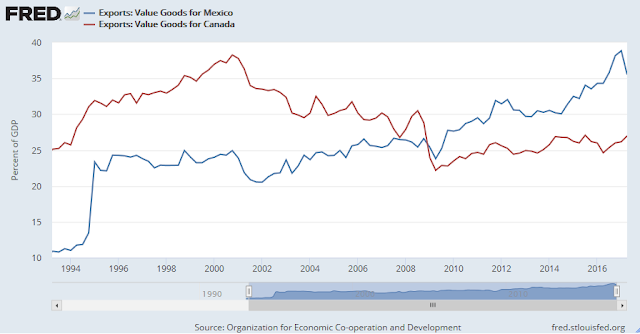
In the US, there is plenty potential for negative surprises. We could see the nomination of a hawkish Fed chair (see What would a Taylor Fed look like? and Melt-up and crash?). As well, Axios reported that it is a matter of when, not if, Trump sends a notice of withdrawal from NAFTA. Such a development would spark protectionism fears as the US has much to lose should it withdraw from NAFTA.
In the meantime, the stock market has not crossed my bearish lines in the sand. The latest update from John Butters of FactSet shows that Q3 earnings season results are beating both the top and bottom lines at an above average historical rates. Forward 12-month EPS is still rising, which indicates positive fundamental momentum. Butters also stated that “the market is rewarding upside earnings surprises more than average and punishing downside earnings surprises more than average”, which is an important indication of bullish undertones to market psychology.
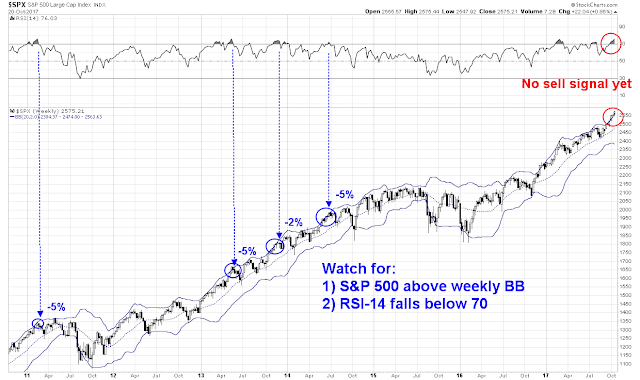
The SPX remains above its weekly upper Bollinger Band, and overbought on its weekly RSI. My inner trader is nervously long, and watching for a downside break as his sell signal.
Any early warning of a downside break should come from the daily chart. It would be seen first from RSI-5, followed by RSI-14. Neither has happened.
My inner investor remains constructive on the market. In all likelihood, we have not seen the final top yet, and his equity weight is roughly at the target set by his investment policy.
* In case readers don’t understand the reference, Mao called his rule of China as Socialism with Chinese characteristics because it differed from the Soviet implementation of Marxist thought.
Disclosure: Long SPXL








Cam—how does the speculative metal purchasing line up with increasing capital controls? Maybe speculative yuan devaluation flows were diverted to base metals? And if so, what might this suggest about the longevity of such speculation?
That question is difficult to answer. There is a great big ball of liquidity that sloshes from one asset class to another in China. You never know when it stops, nor do you know where it goes.
The most predictable (100%) phenomena in investment markets is the run up of the stock market in the nineteen months leading up to the U.S. presidential election followed by a downswing, although that second part is not 100%.
The same cycle may be in play in relation to the once-every-five-year Chinese ‘election’. If so, the next year could be volatile and negative especially for commodities.
Cam,
For us Canadian investors (vs traders), how and when to prepare for Trump pulling out of NAFTA? What stocks will be affected? Surely bank stocks?
I would not be overly concerned about a NAFTA pullout. Even if Trump were to give notice that he wants to pull out of NAFTA, there are procedural steps that need to be taken by Congress. NAFTA was implemented by a series of acts of Congress, and Congress would have to repeal them.
See these illustrations of counties and states most exposed to NAFTA exports and ask which Congressman and Senator would vote for repeal:
https://www.washingtonpost.com/graphics/business/trade-exposure/
https://www.washingtonpost.com/politics/i-was-all-set-to-terminate-inside-trumps-sudden-shift-on-nafta/2017/04/27/0452a3fa-2b65-11e7-b605-33413c691853_story.html
https://twitter.com/spectatorindex/status/817921865771454464/photo/1